
Listen to the summary
Key Data Snapshot
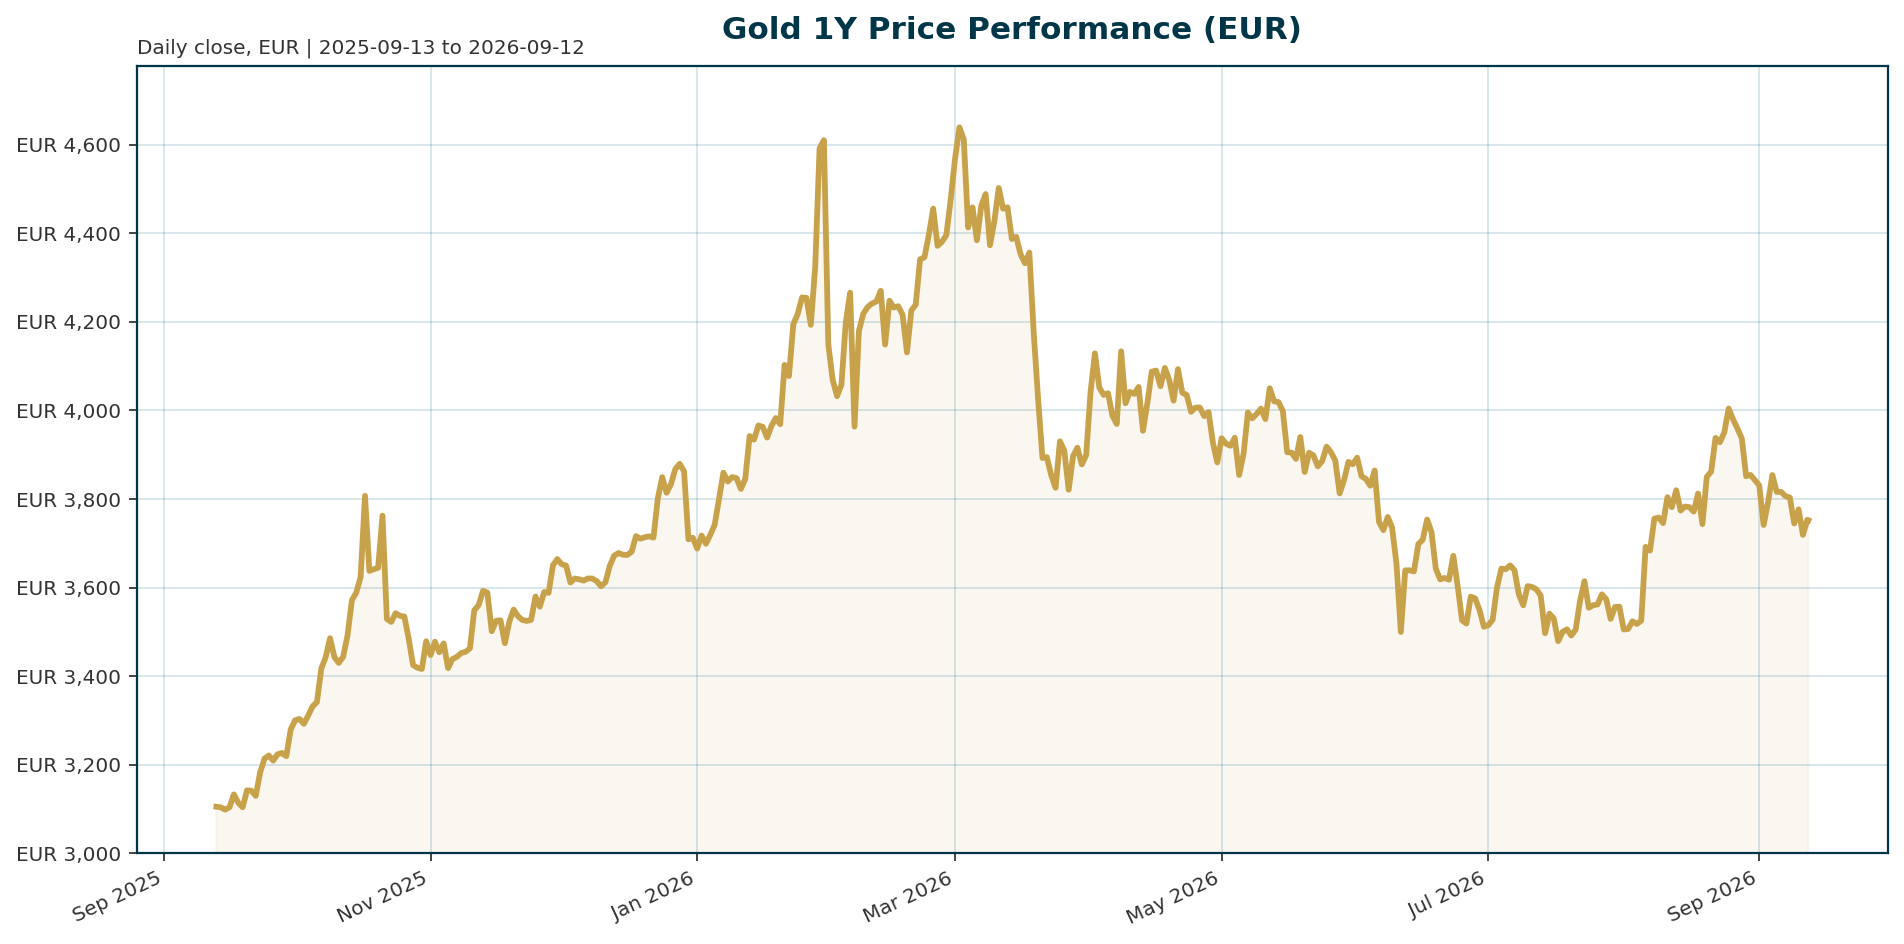
| Metric | Value | Interpretation |
|---|---|---|
| XAU/EUR spot | €3,753.23 | As of 2026-09-12 05:09 UTC |
| Performance | 24h: +0.42%; 7d: -1.8%; 30d: -0.8%; 200d: -16.0%; 1y: +19.3% | Positive one-year trend, but medium-term consolidation remains visible |
| 24h range | Low: €3,716.88; High: €3,792.85 | Range: €75.97, equal to 2.02% of spot |
| All-time high | €4,688.32 on 2026-01-28 | Current price is 19.95% below ATH; required gain to regain ATH: 24.9% |
| All-time low | €1,265.28 on 2019-11-17 | Current price is 196.63% above ATL |
| Euro Area AAA yields | 2Y: 3.10%; 10Y: 3.50%; 30Y: 3.83% | 10Y-2Y spread: 40.3 bp; 30Y-10Y spread: 32.3 bp |
| EUR/USD | 1.1619 | Five-day move: -0.02%, limiting near-term FX translation effects |
| Bundle-reported instrument metrics | Market cap: €1.625bn; 24h volume: €125.1mn | Turnover: 7.7%; this is not total above-ground gold market capitalization |
| Crypto context | BTC dominance: 58.24%; total crypto market cap: €2.289tn | BTC/EUR and ETH/EUR spot, returns and volatility are unavailable |
Macro Backdrop
Gold in EUR trades in a cross-asset environment that is mildly defensive but not uniformly supportive. The market-overview module shows neutral-to-negative risk sentiment, moderately negative equity momentum, rising euro-area yields with curve flattening, and mixed FX. DACH indicators are down 0.99% over five days versus -1.86% for global equity indicators. The Euro Area AAA 10Y yield is 3.50%, up 15.7 bp over five days, while EUR/USD is 1.1619, almost unchanged over five days at -0.02%.
For gold, the key macro variable is not geopolitics in isolation. ING argues that gold direction depends more on how geopolitical events affect inflation, monetary-policy expectations and real rates than on headlines alone [T5]. UBS similarly links recent pressure in gold to higher real yields after energy and inflation concerns shifted expectations toward the Fed keeping policy rates unchanged for the time being [T4]. This matters for EUR-based investors because euro nominal yields are also rising, increasing the opportunity-cost hurdle for holding a non-yielding asset.
The bullish macro counterpoint is that softer US employment, inflation and consumer data have reduced pressure on the Fed to tighten further, while the Bloomberg Dollar Index has begun to roll over after earlier strength, according to Saxo commentary [T2]. If that mix persists, gold can regain support from less restrictive real yields and a weaker dollar. If inflation or labour data reaccelerate, the opposite mix becomes the main tactical risk.
Investment Thesis
Our base thesis is balanced: gold remains a strategic reserve asset and policy-uncertainty hedge, but the next leg in XAU/EUR depends on whether real-yield and dollar conditions stop tightening.
The structural case has improved relative to the pre-2022 regime. Societe Generale describes a post-2022 regime shift in which gold has traded near record highs despite persistently positive real yields, supported by central-bank purchases, dedollarisation, geopolitical uncertainty and sovereign-debt concerns [T1]. UBS also expects medium-term support from central banks systematically buying gold to diversify reserve holdings [T4]. J.P. Morgan notes that a record 43% of 73 global monetary authorities expect their own gold reserves to increase over the next year, with reserve diversification, sanctions risk and inflation volatility cited as motives [T6].
The tactical case is less one-sided. XAU/EUR is still up 19.3% over one year, but it is down 16.0% over 200 days and 19.95% below the January 2026 high. This means investors should distinguish the strategic allocation argument from the timing argument. Structurally, reserve diversification raises the floor. Cyclically, rising real yields and renewed dollar strength can still pressure gold.
Bullish Drivers
- Less restrictive real-yield backdrop: Gold benefits when real yields fall or become less burdensome. Saxo argues that softer US data have shifted the interest-rate backdrop clearly in gold’s favour by reducing pressure on the Fed to tighten further [T2].
- Dollar rollover: A weaker dollar usually supports USD gold and can also support EUR gold if the move is driven by broader easing in global financial conditions. Saxo identifies a rolling-over Bloomberg Dollar Index as a second tailwind [T2].
- Central-bank demand: Saxo flags 289 tonnes of central-bank demand [T2]. UBS and J.P. Morgan frame reserve diversification as a medium-term source of support [T4][T6].
- ETF flows: Societe Generale notes that gold ETF inflows have moderated sharply but remain positive [T1]. Positive flows are not a standalone bull market signal, but they help validate allocation demand.
- Stagflation hedge: ING argues that slower growth alongside persistent inflation would remain supportive for gold over the longer term [T5]. This is important because a stagflationary setting can lift strategic demand even when nominal rates remain restrictive.
- Resilience to higher real yields: J.P. Morgan notes that real yields rose sharply after early 2022, yet gold remained resilient and posted a +13% return in 2023, ending that year at a then-record USD 2,068 per ounce [T6].
The bullish setup becomes more compelling if these drivers align: softer inflation, softer labour data, weaker dollar, positive ETF demand and persistent reserve accumulation. Without that alignment, gold can remain strategically attractive but tactically rangebound.
Relative Positioning vs Bitcoin and Ethereum
Gold’s role differs from Bitcoin and Ethereum. In this bundle, gold has direct XAU/EUR price data, performance history, intraday range and drawdown metrics. Bitcoin and Ethereum have no supplied spot prices, returns, volatility, drawdowns or flow data. Those metrics are unavailable, so the comparison must remain qualitative.
The available crypto context shows Bitcoin dominance at 58.24%, total crypto market capitalization of €2.289tn and total crypto 24h volume of €90.6bn. The aggregate crypto volume-to-market-cap ratio is therefore 4.0%: €90.6bn divided by €2.289tn. This supports the observation that crypto markets remain liquid, but it does not provide an asset-specific signal for BTC/EUR or ETH/EUR.
Gold should be positioned as the lower-beta reserve and policy hedge. Societe Generale, UBS and J.P. Morgan emphasize gold’s role in reserve diversification, dedollarisation and policy uncertainty [T1][T4][T6]. The provided source set does not supply an equivalent central-bank reserve-flow case for Bitcoin or Ethereum. CryptoRank notes that low or falling real rates and potential rate cuts can support gold and related risk assets, including crypto and DeFi tokens [T7]. The shared liquidity channel is therefore relevant, but the institutional use case differs: gold is a monetary reserve asset, while Bitcoin and Ethereum remain more exposed to risk appetite, liquidity and adoption cycles based on the information supplied.
Scenario Framework
| Scenario | Macro path | XAU/EUR implication | Key levels and calculations |
|---|---|---|---|
| Base case | Inflation cools slowly; central banks remain cautious; EUR/USD broadly stable | Consolidation after a strong one-year gain | Current price €3,753.23; 24h range €3,716.88 to €3,792.85 |
| Bull case | Softer inflation and labour data allow the Fed to turn more moderate; dollar weakens; real yields fall | Gold retests higher ranges as ETF and reserve demand reinforce macro support | Regaining ATH requires +24.9%: €4,688.32 divided by €3,753.23 minus 1 |
| Bear case | Inflation or employment reaccelerates, lifting real yields and the dollar together | Correction extends; opportunity cost dominates structural demand | A 6% to 8% correction from spot implies €3,528 to €3,453 |
| Stagflation case | Growth weakens while inflation remains persistent | Near-term policy ambiguity may cap rallies, but strategic hedging demand improves | Support depends on whether real yields rise or growth fears pull policy expectations lower |
| EUR translation case | EUR/USD weakens while USD gold is stable | EUR gold can be cushioned by FX translation | At EUR/USD 1.1619, USD 4,500 gold translates to €3,873 |
Saxo identifies the clearest risk as renewed inflation or employment strength reviving both real yields and the dollar together [T2]. UBS sees a more constructive path if inflation pressure does not trigger broad second-round effects and the Fed can adopt a more moderate tone later in the year [T4]. ING notes that the Fed left rates unchanged and that further easing requires clearer inflation progress, while its US economist still expects two 25 bp cuts later this year [T5].
External USD reference levels require caution in a EUR report. Saxo cites USD 4,500 as a key technical test and USD 4,200 as a level below which consolidation would remain dominant [T2]. Using EUR/USD 1.1619 as a static conversion, these levels equal approximately €3,873 and €3,615. These are translation references, not XAU/EUR forecasts.
Valuation Discussion
Gold has no cash flow, so valuation depends on macro regimes rather than discounted earnings. The core inputs are real yields, inflation risk, the dollar, central-bank demand, ETF flows and currency translation. CryptoRank states that gold is a non-yielding asset, so rising rates increase its opportunity cost, while falling rates make it more attractive [T7]. J.P. Morgan also highlights gold’s historical inverse relationship with real yields, while acknowledging that the relationship has broken down in some recent periods [T6].
The current EUR price is elevated versus history but no longer extended versus the January 2026 peak. At €3,753.23, gold is 19.95% below the ATH of €4,688.32 and 196.63% above the 2019 low of €1,265.28. This supports a valuation framing of cyclical consolidation within a longer-term bull structure.
The central valuation debate is whether the post-2022 regime has raised fair value. Societe Generale argues that gold has broken away from historical models that would imply significantly lower prices despite positive real yields, because central-bank buying, dedollarisation and sovereign-debt concerns have lifted the floor [T1]. If that regime persists, real-yield models may understate fair value. If the historical real-yield relationship reasserts itself, positive or rising real yields can still force a lower valuation range.
USD target references also need FX discipline. Business Standard reports that MOFSL sees medium-term strength but also scope for a 6% to 8% correction before potential upside toward USD 4,800 and later above USD 5,500 over 12 to 15 months [T3]. At a static EUR/USD rate of 1.1619, USD 4,800 translates to €4,131 and USD 5,500 to €4,734. These conversions are mechanical and do not account for future FX changes.
Risks
- Real-yield and dollar shock: Saxo identifies the most challenging backdrop as renewed inflation or employment strength that revives both real yields and the dollar [T2]. This is the cleanest bearish scenario for gold.
- Higher-for-longer policy risk: ING argues that rising geopolitical tensions can push energy prices higher, keep inflation elevated and complicate the path to monetary easing [T5]. If this raises real yields, it can be gold-negative despite geopolitical risk.
- Energy-driven inflation transmission: Business Standard reports that tariffs and conflict-related energy effects have lifted production costs, inflation expectations, real Treasury yields and the dollar, limiting gold gains in some episodes [T3].
- Flow risk: Societe Generale notes that gold ETF inflows have moderated sharply, although they remain positive [T1]. Further moderation would weaken tactical support.
- Central-bank demand slowdown: ING states that central banks remain supportive but buying may slow [T5]. A slower reserve bid would reduce the structural floor.
- EUR rates headwind: Euro Area AAA 10Y yields rose 15.7 bp over five days. For EUR investors, higher local yields raise the opportunity cost of holding gold.
- Data limitations: No direct real-yield series, DXY level, Fed funds futures, ECB policy-pricing series, BTC/EUR data or ETH/EUR data are supplied. Quantitative cross-asset comparison is therefore limited.
Appendix
Selected Calculations
- Distance to ATH: (€3,753.23 / €4,688.32 – 1) = -19.95%.
- Upside to regain ATH: (€4,688.32 / €3,753.23 – 1) = +24.9%.
- Gain from ATL: (€3,753.23 / €1,265.28 – 1) = +196.63%.
- 24h range: €3,792.85 – €3,716.88 = €75.97; €75.97 / €3,753.23 = 2.02%.
- Bundle-reported turnover: €125.1mn / €1.625bn = 7.7%.
- Euro curve spreads: 10Y-2Y = 3.5032% – 3.1006% = 40.3 bp; 30Y-10Y = 32.3 bp; 5Y-2Y = 11.0 bp.
- Hypothetical EUR translation: USD 4,500 / 1.1619 = €3,873; USD 4,200 / 1.1619 = €3,615; USD 4,800 / 1.1619 = €4,131; USD 5,500 / 1.1619 = €4,734.
- Hypothetical 6% to 8% correction from spot: €3,753.23 x 0.94 = €3,528; €3,753.23 x 0.92 = €3,453.
- Crypto aggregate turnover: €90.6bn / €2.289tn = 4.0%.
Data Notes
Gold market data were retrieved at 2026-09-12 05:09 UTC. Market-overview data were generated at 2026-09-12 05:09 UTC. Euro Area AAA yield data are as of 2026-09-10. FX data are as of 2026-09-12. The bundle-reported market capitalization, supply and fully diluted valuation relate to the supplied instrument data feed and should not be read as total physical gold market capitalization. BTC/EUR and ETH/EUR spot prices, returns, drawdowns, volatility and flows are unavailable in the supplied bundle.
Sources
- [T1] It’s time to get bullish on gold again, says SocGen | Kitco News
- [T2] ICYMI: ETF flows return to gold as Saxo flags 289-tonne central bank demand
- [T3] Gold looks beyond war as inflation, monetary policy steer prices: Report | Business Standard
- [T4] Gold: Between inflation fears and diversification of reserves | UBS Global
- [T5] Geopolitics alone isn’t enough to lift gold | ING THINK
- [T6] Is it a golden era for gold? | J.P. Morgan Private Bank U.S.
- [T7] Gold and Interest Rates: How Fed Policy Shapes the Precious Metal’s Appeal | CryptoRank.io
This report is AI-generated, for informational purposes only, and does not constitute investment advice, an offer, or a solicitation to buy or sell any financial instrument.
Important Note / Wichtiger Hinweis:
EN: This report may have been generated using AI. It processes data from publicly available sources. The content is provided for informational purposes only.DE: Dieser Bericht kann mithilfe von KI erstellt worden sein. Dabei werden Daten aus öffentlich zugänglichen Quellen verarbeitet. Die Inhalte dienen ausschließlich Informationszwecken.
* DE: Die ergänzenden Inhalte können KI-generiert sein. EN: The additional content may be AI-generated.