
Listen to the summary
Key Data Snapshot
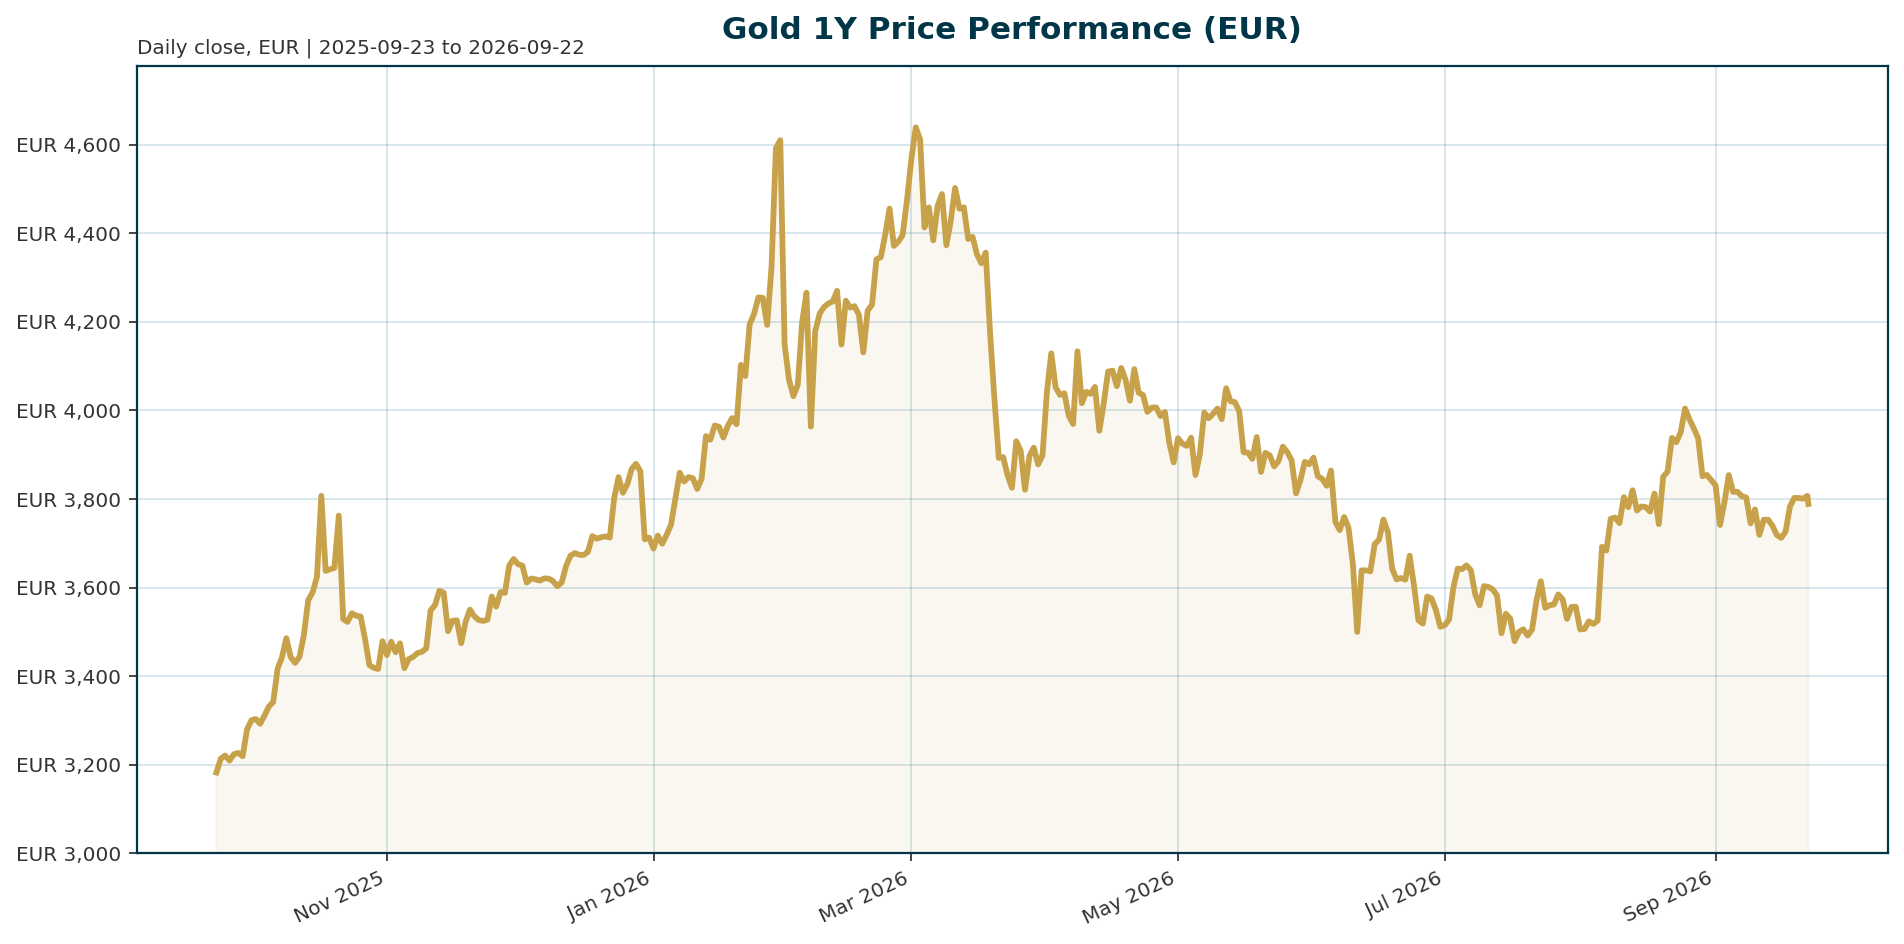
XAU/EUR trades at 3,777.87 EUR as of 2026-09-22 04:37 UTC. The 24-hour band is contained between 3,769.79 and 3,807.22, a range of 37.43 EUR or 0.99% of spot (37.43 / 3,777.87 × 100 = 0.99%), indicating orderly consolidation rather than stress. Short-term momentum is soft, the medium-term drawdown is meaningful, and the one-year trend remains strongly positive.
| Metric | Value | Comment |
|---|---|---|
| Price (XAU/EUR) | 3,777.87 | Reference level, retrieved 2026-09-22 |
| 24h change | -0.47% | Mild daily softness |
| 7d change | +0.57% | Stabilization attempt |
| 14d change | -1.89% | Corrective drift |
| 30d change | -5.38% | Material pullback |
| 200d change | -15.52% | Deep medium-term drawdown |
| 1y change | +17.53% | Structural uptrend intact |
| All-time high | 4,688.32 (2026-01-28) | Spot is 19.42% below ATH |
| All-time low | 1,265.28 (2019-11-17) | Spot is +198.58% above ATL |
| Market cap / 24h volume | 1.64bn / 169.7m EUR | Proxy (PAXG) instrument data, not physical gold market size |
| Circulating supply | 434,499.37 oz-equivalent units | Tokenized proxy supply only |
Data caveat: Market cap, supply, and rank fields derive from a tokenized gold proxy (coingecko_id pax-gold). They measure instrument size and liquidity, not the global above-ground gold market. US real yields, DXY, inflation breakevens, and ETF flow data are unavailable in this dataset and are treated qualitatively via cited research.
Macro Backdrop
The cross-asset backdrop is neutral to positive on risk, which is not the environment in which gold typically leads. Equity momentum is mixed: the Nasdaq Composite posted the strongest 5-day move at 4.39%, while DACH indicators average 1.48% over 5 days versus 2.68% globally, with the DAX the weakest at 0.68%. Euro-area rates are mixed rather than decisively tighter: the AAA 10Y yield sits at 3.53%, down 1.1 bp over 5 days, and the 10Y-2Y spread is 31.5 bp. FX is mixed, with EUR/USD at 1.1484, down 0.08% over 5 days and 1.75% over one month. That EUR softness mechanically cushions XAU/EUR when USD gold is flat.
The gold-specific macro tension is well defined in current research. ING argues that geopolitics alone is insufficient, since the Iran conflict has coincided with falling gold prices; the transmission runs through real yields, the dollar, and rate expectations, and higher energy prices risk entrenching inflation and keeping real yields elevated [T2]. CEOWORLD makes the same point from the bearish side: higher-for-longer policy rates and positive real yields raise the opportunity cost of a non-yielding asset [T8]. Against this, SocGen identifies a post-2022 regime shift in which gold has held near record highs despite persistently positive real yields, supported by central bank purchases, dedollarisation, geopolitical uncertainty, and sovereign debt concerns [T1]. J.P. Morgan confirms the historical inverse real-yield relationship while acknowledging it has broken down over the past two years [T4].
Investment Thesis
The core thesis for EUR-based allocators: gold is a monetary and fiscal-credibility hedge whose downside is structurally floored by official-sector demand, but whose upside is cyclically capped by elevated real yields and rate-competition from fixed income. Gold competes with real returns, not nominal policy rates; a central bank can tighten while inflation expectations rise faster, leaving real rates unchanged or lower [T6]. SocGen remains strategically bullish, framing gold as a hedge against monetary and policy uncertainty with a higher structural floor [T1]. Lombard Odier sees the macro context still favoring real assets amid fiscal uncertainty and gradual erosion of purchasing power, and views current headwinds (higher yields, stronger USD) as temporary rather than structural [T5]. J.P. Morgan documents the reserve diversification motives: sanctions vulnerability, geopolitical risk proximity, and inflation protection [T4].
For a euro investor the position has two return engines: the underlying bullion price and the EUR/USD translation. With EUR/USD down 1.75% over one month, EUR-denominated gold has outperformed USD gold over that window even as both corrected. The thesis is therefore constructive but conditional: it requires that structural reserve flows and fiscal concerns offset, but do not need to overpower, real-yield pressure.
Bullish Drivers
Structural: official-sector demand. Central banks purchased more than 3,200 tonnes between 2022 and 2024, roughly 1,136t in 2022, 1,037t in 2023, and 1,045t in 2024, three consecutive years above 1,000t, the fastest accumulation since the 1960s [T7]. J.P. Morgan reports a record 43% of 73 monetary authorities expect their own reserves to rise over the next year [T4]. A 2024 survey showed 29% of respondents planned to increase holdings, and by 2025 about 44% of reserve managers actively manage their gold books with risk management as a key motive [T7]. ING notes any deeper pullback would likely attract central bank and long-term buyers [T2].
Cyclical: policy and inflation path. SocGen argues inflation risks remain underpriced, since even expected Fed tightening falls short of the Atlanta Fed Taylor Rule prescription [T1]. ING’s US economist still expects two 25bp cuts in September and December, and a stagflationary mix of slower growth with persistent inflation would be supportive over the longer term [T2]. ETF inflows have moderated sharply but remain positive, and lower volatility is improving gold’s appeal to longer-term reserve managers [T1]. Lombard Odier adds that fiscal uncertainty and purchasing-power erosion favor real assets [T5].
Relative Positioning vs Bitcoin and Ethereum
Comparable BTC and ETH price, return, and market-cap data are not available in this dataset, so no numerical relative-performance claims can be made. What the data do support: total crypto market capitalization stands at 2.54trn USD with 138.6bn USD in 24h volume, and Bitcoin dominance is 58.79%. Gold’s proxy instrument shows a 24h volume-to-market-cap ratio of 10.34% (169.7m / 1,641.4m × 100), a high turnover for a store-of-value vehicle, but the two liquidity figures are not directly comparable given different market structures.
The qualitative framing: with risk sentiment neutral to positive and equity momentum led by Nasdaq, the liquidity regime currently favors risk assets, including crypto. Gold’s differentiation is its reserve-asset status and independence from speculative liquidity cycles; its thesis rests on real yields, fiscal credibility, and central bank flows rather than risk appetite. If the current neutral-to-positive backdrop matures into a broader liquidity-driven rally, Bitcoin and Ethereum would likely outperform. If policy credibility erodes or reserve diversification accelerates, gold’s lower-volatility monetary hedge profile becomes the more durable allocation. This is a framing assessment, not a measured ranking.
Scenario Framework
Base (highest probability): Real yields stay elevated but do not spike; central bank accumulation persists at a moderating pace; ETF flows stay slightly positive. XAU/EUR consolidates in a broad range, with downside cushioned by reserve flows and EUR/USD translation. The 30d decline of 5.38% reads as correction, not reversal.
Bull: Inflation expectations stay sticky while fiscal credibility concerns rise (US debt above 40trn USD, doubled long-term issuance, yields at two-decade highs [T3]); central banks keep buying; the Fed cuts into persistent inflation; EUR weakens further. XAU/EUR challenges the 4,688.32 ATH over the medium term. SocGen’s higher structural floor argument applies [T1].
Bear: Real yields rise further, the USD strengthens, rate cuts are delayed or reversed, and ETF plus physical demand soften while official buying slows. XAU/EUR extends the correction below the January high; the 200d drawdown of 15.52% deepens. Lombard Odier flags exactly this combination as the key negative risk set [T5].
Stagflation: Growth slows while inflation persists. Gold benefits as a real-asset hedge even with restrictive nominal policy, since real rates fail to rise with inflation expectations [T2]. Historically the strongest regime for gold, per the post-2022 evidence.
Valuation Discussion
Gold has no cash-flow valuation anchor, so fair value is a contest between two frameworks. Under the traditional real-yield model, spot should be materially lower given positive real yields; this model would have failed to explain the entire post-2022 rally [T1] [T4]. Under the regime-shift framework, the structural premium is justified by a reserve-flow floor: three years of 1,000t-plus official purchases [T7], dedollarisation, and fiscal credibility concerns [T1] [T3].
The current drawdown suggests the market is re-testing how much of the structural premium is durable. Spot at 3,777.87 is 19.42% below the 4,688.32 ATH (verified: 3,777.87 / 4,688.32 – 1 = -19.42%) yet still 198.58% above the 2019 ATL (verified: 3,777.87 / 1,265.28 – 1 = +198.58%). A reasonable interpretation: the market has repriced the cyclical component (real-yield opportunity cost, profit-taking after a 6% YTD run per ING [T2]) while the structural floor, implied by central bank behavior on dips [T2] [T7], is being tested rather than broken. For EUR investors, the implied USD-equivalent reference is 3,777.87 × 1.1484 = 4,338.51 USD, useful only as a translation cross-check since no independent USD spot series is provided. If EUR/USD keeps sliding at the recent 1m pace of -1.75%, XAU/EUR gains roughly 1.75 percentage points of relative return versus USD gold per month, all else equal.
Risks
Real-yield risk. Higher-for-longer real yields are the most cited downside driver [T2] [T5] [T8]. If the Fed keeps policy restrictive while inflation expectations fall, opportunity-cost pressure on a non-yielding asset intensifies.
USD risk. A firmer dollar pressures USD-denominated gold and tightens global financial conditions; for EUR investors this cuts both ways, since EUR/USD weakness has been the main cushion for the local-currency return [T8].
Demand-composition risk. ING notes central bank buying remains supportive but may slow [T2]. Lombard Odier flags prolonged ETF-demand decline and softer physical demand, including jewellery, as negative factors [T5]. If reserve diversification stalls, the post-2022 regime-shift thesis loses its explanatory power and the market reverts to the real-yield model at lower prices.
Momentum risk. With 200d performance at -15.52% and 30d at -5.38%, trend-following and CTA flows can amplify downside before fundamental buyers step in.
Data risk. Proxy market cap and supply figures must not be read as total gold market metrics. BTC and ETH comparison data are missing, so relative positioning remains qualitative. Several cited summaries lack publication dates and should be treated with recency caution.
Appendix
Data provenance. Report generated 2026-09-22T04:37:33Z; market data retrieved 2026-09-22T04:37:24Z. Euro-area yield data are as of 2026-09-18 (ECB yield curve); FX data are as of 2026-09-22. Market overview returned no errors. Missing inputs: US real yields, DXY, breakevens, Fed funds pricing, USD gold spot, ETF flow series, physical demand data.
Calculations shown.
- 24h range: 3,807.22 – 3,769.79 = 37.43 EUR; 37.43 / 3,777.87 × 100 = 0.99% of spot.
- ATH drawdown: (3,777.87 / 4,688.32 – 1) × 100 = -19.42%.
- ATL appreciation: (3,777.87 / 1,265.28 – 1) × 100 = +198.58%.
- Proxy turnover: 169,689,678 / 1,641,376,945 × 100 = 10.34% (instrument-level only).
- Euro-area curve: 10Y minus 2Y = 3.5298% – 3.2152% = 31.45 bp; 30Y minus 10Y = 3.7471% – 3.5298% = 21.74 bp.
- USD-equivalent reference: 3,777.87 × 1.1484 = 4,338.51 USD (translation cross-check only).
Source quality note. Institutional research (SocGen, ING, J.P. Morgan, Lombard Odier) carries the most weight. The EBC and Investing.com summaries supply central bank purchase figures that should be verified against primary World Gold Council data before reliance. The FXStreet-derived item [T3] is used only for fiscal-narrative context, not as a primary source.
Sources
- [T1] It’s time to get bullish on gold again, says SocGen | Kitco News. https://www.kitco.com/news/article/2026-09-03/its-time-get-bullish-gold-again-says-socgen
- [T2] Geopolitics alone isn’t enough to lift gold | ING THINK. https:/.ing.com/articles/geopolitics-alone-isnt-enough-to-lift-gold
- [T3] Gold Broke Its Old Rule. Here’s Why | FXStreet (via Facebook). https://www.facebook.com/FXstreet/posts/gold-broke-its-old-rule-heres-whyreal-interest-rates-not-nominal-rates-have-hist/1672265398239049
- [T4] Is it a golden era for gold? | J.P. Morgan Private Bank. https://privatebank.jpmorgan.com/nam/en/insights/markets-and-investing/is-it-a-golden-era-for-gold
- [T5] Gold’s slowdown doesn’t signal a reversal | Lombard Odier. https://www.lombardodier.com/insights/2026/may/gold-s-slowdown.html
- [T6] Central Banks Are Hiking Again, Yet Gold Keeps Climbing | Investing.com. https://www.investing.com/analysis/central-banks-are-hiking-again-yet-gold-keeps-climbing-200687932
- [T7] How Geopolitics and Central Banks Are Driving Gold Higher | EBC Financial Group. https://www.ebc.com/forex/how-geopolitics-and-central-banks-are-driving-gold-higher
- [T8] Hawkish Fed, Costly Oil, Falling Gold | CEOWORLD magazine. https://ceoworld.biz/2026/03/22/hawkish-fed-costly-oil-falling-gold-whats-really-driving-the-precious-metals-rout
Disclaimer: This report is AI-generated and provided for informational purposes only. It does not constitute investment advice, a recommendation, or an offer to buy or sell any financial instrument. Market data may be delayed or incomplete, and cited third-party views are not independently verified. Investors should conduct their own analysis and consult a licensed advisor before making allocation decisions.
Important Note / Wichtiger Hinweis:
EN: This report may have been generated using AI. It processes data from publicly available sources. The content is provided for informational purposes only.DE: Dieser Bericht kann mithilfe von KI erstellt worden sein. Dabei werden Daten aus öffentlich zugänglichen Quellen verarbeitet. Die Inhalte dienen ausschließlich Informationszwecken.
* DE: Die ergänzenden Inhalte können KI-generiert sein. EN: The additional content may be AI-generated.