
Listen to the summary
Key Data Snapshot
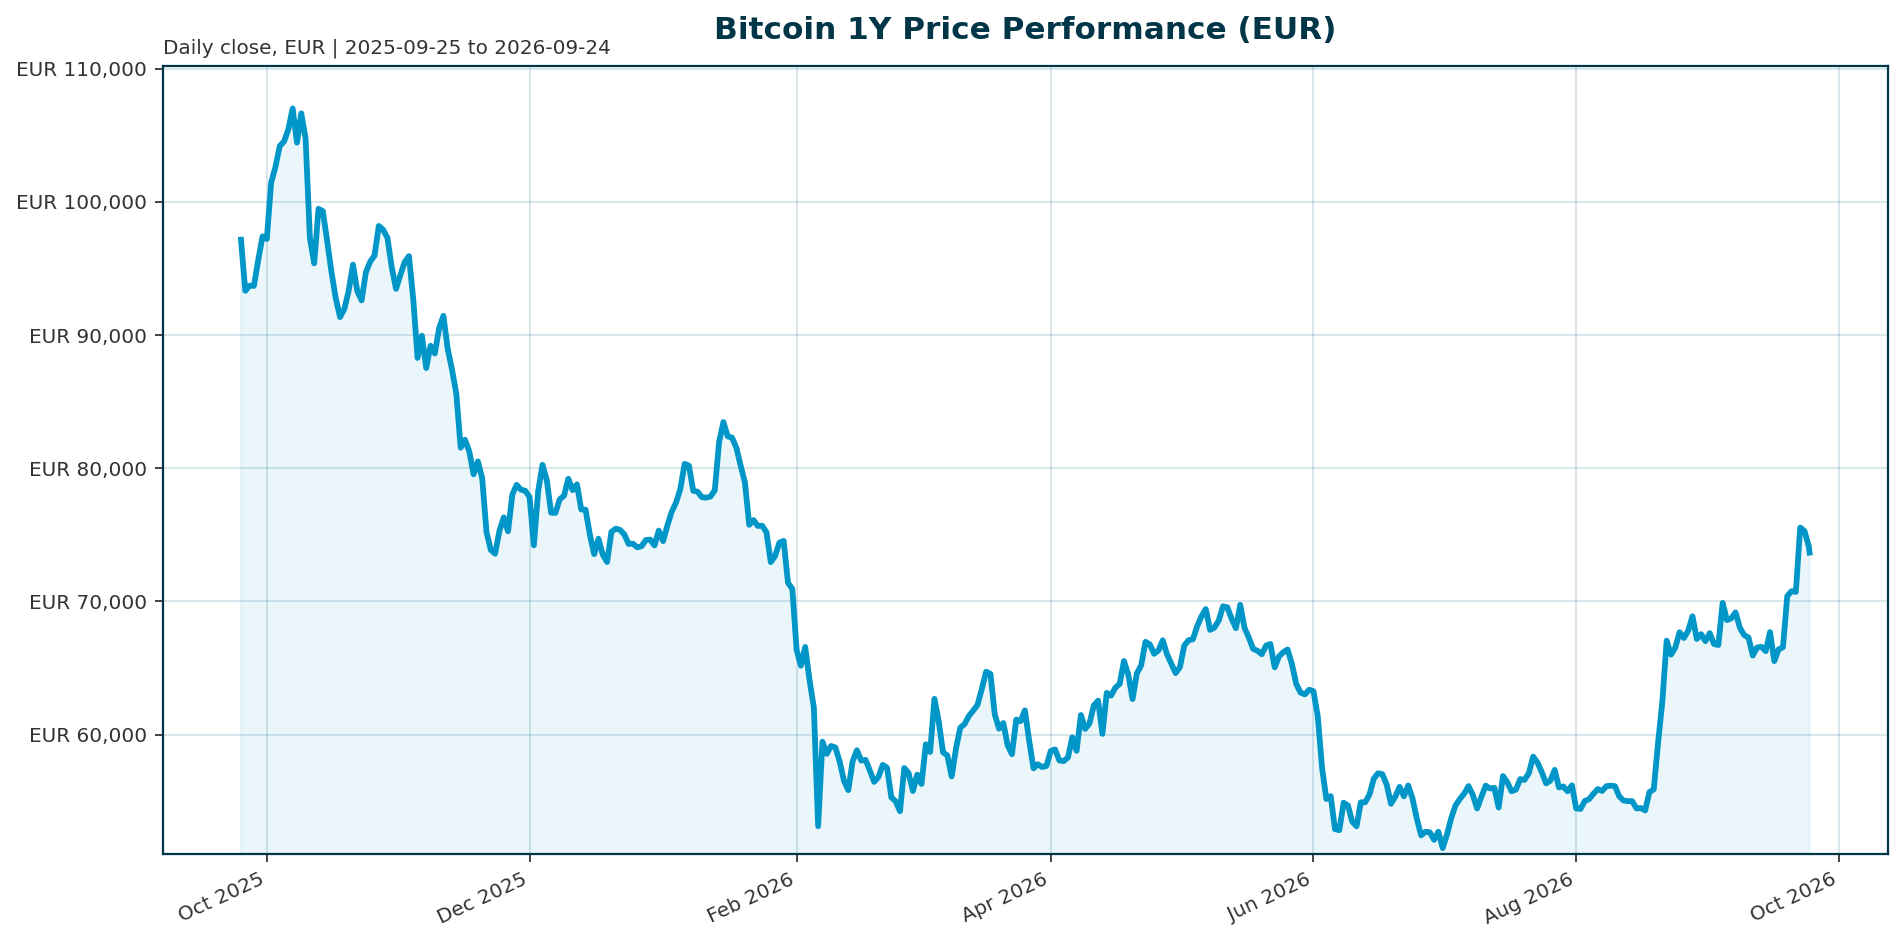
| Metric | Value | Detail |
|---|---|---|
| Price | EUR 73,687 | 24h range EUR 73,524 to 76,604; price sits 5.3% of the way up the daily range ((73,687 − 73,524) / (76,604 − 73,524) = 163 / 3,080), closing near the low |
| Performance | 1h −0.59% / 24h −3.05% / 7d +9.89% / 14d +7.05% / 30d +3.99% / 200d +25.30% / 1y −25.27% | Recovering trend within a negative annual return |
| All-Time High | EUR 107,662 (2025-10-06) | Drawdown (73,687 − 107,662) / 107,662 = −31.56%; recovery required to ATH: 107,662 / 73,687 = 1.461x (+46.1%) |
| Market Cap | EUR 1,480.23bn | Rank 1; market cap change 24h: −3.45% (−EUR 52.97bn) |
| Fully Diluted Valuation | EUR 1,480.23bn | FDV/market cap ratio 1.00; no unlock overhang |
| Volume 24h | EUR 38.13bn | Turnover ratio 38.13bn / 1,480.23bn = 2.58% of market cap |
| Supply | 20,088,550 / 21,000,000 BTC | 95.66% mined; 911,450 BTC remain |
| BTC Dominance | 58.69% | Total crypto market cap EUR 2,514.67bn; cross-check: 1,480.23 / 2,514.67 = 58.9% (minor definitional difference) |
| All-Time Low | EUR 51.30 (2013-07-04) | Current price +143,543.8% above ATL |
Data retrieved 2026-09-24 04:15 UTC.
Market Setup
The surrounding market is neutral in risk sentiment with mixed equity momentum and DACH equities lagging globally: DACH indicators average 0.07% over 5 days versus 1.50% for global peers, with the DAX the weakest 5-day performer at −0.50% and the Nikkei 225 the strongest at +3.59%. The euro rates backdrop shows mixed yields with curve flattening: the euro area AAA 10Y yield stands at 3.45%, down 8.1bp over 5 days, while the 10Y-2Y spread sits at 31.7bp and the 2Y yield is up 102.7bp year-to-date. FX is mixed, with EUR/USD at 1.1444 (−0.40% over 5 days) providing a mildly dampening effect on EUR-quoted risk assets. This context matters for Bitcoin secondarily: the primary variable is the US policy path, where the Fed under Chair Kevin Warsh is expected to hold rates through Q3 2026, limiting the policy easing that historically supported risk-asset recoveries [T2]. Inflation concerns, the higher-for-longer debate, energy prices and fiscal pressures tie Bitcoin performance to broader liquidity conditions [T3]. Institutionalization has fused Bitcoin into the global capital machinery, making it sensitive to rates, equity rotations and margin demands rather than crypto-native dynamics alone [T6]. For a EUR-quoted investor, elevated euro short-dated yields raise the hurdle rate for a carry-free asset.
Investment Thesis
Bitcoin has transitioned from a halving-cycle speculative asset to a flow-driven, institutionally-wrapped risk asset. Price is now governed by three variables: market structure, institutional fund flows, and the macroeconomic environment, a shift away from the four-year halving cycle that historically dominated [T5]. ETF flows have effectively become Bitcoin’s new macro indicator; record outflows from US-listed BTC and ETH ETFs in Q4 2025 coincided with breaks of key support near USD 98,000, underscoring the coupling of price to regulated capital movement [T1].
The structural base is substantial. By end-2025, 6.7 million BTC sat across ETFs, exchanges and treasuries, roughly 33.4% of circulating supply (6,700,000 / 20,088,550 = 33.35%), a period Glassnode described as Bitcoin’s institutional supply era [T1]. Regulated custody platforms hold a further 5-7% of circulating supply (roughly 1.0 to 1.4 million BTC), wealth managers are embedding spot ETFs into model portfolios, and legal clarity has allowed insurers and pension funds to underwrite digital asset risk [T6]. Volatility compression from 84% to 43% supports the evolution into a more stable institutional asset, though the 2025 correction showed high-beta behavior persists [T1].
Near term, price depends on ETF flow sustainability. Longer term, value rests on structural adoption, fixed supply, and a potential regulatory catalyst: the CLARITY Act would establish a federal market-structure framework and could unlock broader institutional participation if passed [T2].
Bullish Drivers
- Flow recovery: ETF inflows revived bullish sentiment and institutional demand is visible again; reclaiming the USD 80,000 level reasserted the bullish structure, though holding that floor is the next test [T3].
- Accumulation behavior: In April 2026, ETF investors treated drawdowns as accumulation opportunities, recording their largest inflows since late February despite a harsh macro backdrop [T8].
- Supply scarcity: 95.66% of the 21 million cap is mined, with only 911,450 BTC left. Marginal demand from flows has outsized price impact in this regime.
- Broadening access: Regulatory clarity in custody, market structure and tax treatment could widen participation among sidelined institutions; product innovation such as covered-call ETFs, multi-asset index products and model portfolios makes ETF flow data more central to allocation [T7].
- Model portfolio integration: Large wealth managers standardizing BTC exposure in automated advisor models converts tactical interest into recurring, systematic demand [T6].
- Regulatory catalyst optionality: CLARITY Act passage would be a step-function demand event for institutions still on the sidelines [T2].
- Flow sustainability logic: If inflows continue for several weeks, they provide structural support for rallies, especially when futures-driven liquidity is weaker [T7].
Relative Positioning vs Gold and Ethereum
Vs Gold: Bitcoin lagged traditional assets including gold and bonds during the 2025 peak-to-correction year, in which over USD 1 trillion of crypto market value was erased and BTC fell nearly 30% from its peak [T1]. Behaviorally, the digital-gold narrative is not yet realized: gold retained the hedge mandate in 2025 while BTC traded as a high-beta risk asset even in its institutional era. If a stagflation or debasement regime emerges and BTC decouples positively from equities, the gold-comparison thesis strengthens; until then, BTC should be sized as a risk asset rather than a gold substitute. Note: the bundle contains no current gold price data, so no precise gold performance figure can be quoted here.
Vs Ethereum: BTC and ETH share a flow regime. Record Q4 2025 outflows hit both US-listed BTC and ETH ETFs simultaneously, and their inflows rebound jointly, so practitioners monitor the two flow series together [T1, T7]. A structural divergence is emerging in Asia: institutional adoption there centers on real-world-asset tokenization and regulated stablecoins (for example Hong Kong’s Stablecoins Ordinance with full reserve backing and redemption rights), where pure bitcoin ETFs play a smaller strategic role than in North America and Europe [T2]. Bitcoin’s edge remains monetary scarcity and market weight: at 58.69% dominance, it is still the core allocation vehicle within the EUR 2.51 trillion crypto complex, while ETH-adjacent infrastructure may capture flow share if tokenization legislation drives the next adoption wave.
Scenario Framework
- Bull scenario: CLARITY Act passes AND ETF inflows sustain for multiple weeks AND the Fed turns dovish earlier than the Q3-2026 hold expected under Warsh. Structural flow support compounds with a regulatory unlock, opening a path toward a re-rating of the −31.56% ATH discount. Signposts: 4+ consecutive weeks of net ETF inflows, legislative progress, dovish Fed communication [T2, T3, T7].
- Base scenario: Fed holds through Q3 2026, flows remain choppy and price-sensitive as they did after the April surge faded, and BTC consolidates between the USD 80,000-equivalent floor and the next resistance zone. Recovery continues but is momentum-dependent; the asset trades as a high-beta liquidity vehicle with ETF data as the real-time sentiment gauge [T2, T3, T4].
- Bear scenario: Flows reverse in the Q4 2025 pattern (record outflows coinciding with support breaks near USD 98,000), or macro stress or a geopolitical shock hits. The April 2026 episode, when BTC briefly touched USD 70,000 on Iran ceasefire headlines, illustrates how quickly levels can flush [T1, T8]. A failed USD 80,000-equivalent floor would retest lower ranges [T3].
Valuation Discussion
Bitcoin’s valuation profile is flow-elastic rather than supply-shock-driven. With 95.66% of supply mined and roughly one-third of circulating supply (6.7 million BTC) held across ETFs, exchanges and treasuries [T1], marginal flow demand has disproportionate price impact. Market cap equals fully diluted valuation at EUR 1,480.23bn (ratio 1.00), meaning there is no token-unlock overhang; remaining issuance is minimal and halving-scheduled.
The dominant valuation tension is between mean reversion and trend: price sits 31.56% below the EUR 107,662 ATH of October 2025 (requiring +46.1% to recover), the 1-year return is −25.27%, yet the 200-day return is +25.30% and the 7d/30d momentum is positive. If the halving cycle is truly dead as the market-structure literature argues [T5], ATH reversion requires a flow or regulatory catalyst rather than calendar-driven cycle timing. Volatility compression from 84% to 43% [T1] materially changes position-sizing math for allocators: at roughly half the historical volatility, risk budgets permit larger allocations at equal portfolio risk, a quiet but real structural tailwind for demand. In EUR terms, the 1.1444 EUR/USD rate means EUR-quoted returns trail USD-quoted returns when the euro strengthens; the YTD EUR/USD move of −2.62% (dollar stronger) worked in EUR investors’ favor on USD-linked crypto pricing. BTC dominance of 58.69% is the key relative-value metric: a sustained slide below that level would signal rotation pressure toward ETH-adjacent or tokenization narratives.
Risks
- Macro/rates dependency: With the Fed expected to hold under Chair Warsh through Q3 2026, the historical easing tailwind is absent. Hotter inflation, energy prices, geopolitical tensions and fiscal pressures all pressure BTC through the liquidity channel that now dominates its pricing [T2, T3].
- ETF flow reversibility: The flow slowdown after April’s surge shows allocators remain price- and macro-sensitive. Flows can reverse on inflation data or Fed repricing; the same wrapper that legitimizes Bitcoin makes it legible to traditional risk-off behavior [T4]. Note: no current September 2026 flow figures are available, so the flow narrative rests on April/May 2026 data and may be stale.
- Residual high-beta behavior: Despite volatility compression to 43%, 2025 delivered a nearly 30% peak-to-trough decline, over USD 1 trillion in value erased, and underperformance versus gold and bonds. The institutional era still delivers old-fashioned crypto volatility when support floors fail [T1, T3].
- New systemic volatility profile: Institutionalization tied Bitcoin to rates, equity rotations and margin demands. Creation/redemption loops and delta-neutral strategies have smoothed retail volatility but introduced correlation with traditional markets precisely when diversification is most needed [T6].
- Regulatory execution risk: CLARITY Act passage is conditional, not assured. Failure or dilution removes the anticipated institutional participation catalyst and extends consolidation [T2].
- Geopolitical shock risk: The April 2026 flush to USD 70,000 on Iran ceasefire headlines demonstrates headline-driven air pockets remain possible [T8].
- Relative-performance risk: A repeat of 2025’s underperformance versus gold and bonds undermines the monetary-hedge allocation case and keeps BTC sized as a satellite risk asset [T1].
- Flow dependence caution: As CoinShares noted, the balance of risks has improved but remains highly dependent on flows and macro conditions; ETF inflows do not make the asset risk-free [T3].
Appendix
Methodology and Data Provenance
- BTC market data retrieved 2026-09-24T04:15:08 UTC via the CoinGecko-based data bundle; all price and market data are EUR-quoted.
- Macro data as-of dates: equity indices 2026-09-23/24 (DAX, ATX via Wiener Börse, Euro Stoxx 50, S&P 500, Nasdaq, Nikkei, Hang Seng), ECB AAA yield curve 2026-09-22, FX (Frankfurter) 2026-09-24.
- News sources retrieved 2026-09-24T04:15:11 UTC. News items carry no published_at timestamps; dating is inferred from content (for example, the Q2 2026 Digital Asset Review, and April 2026 references in T8). Where source levels are USD-denominated (USD 80,000, USD 98,000, USD 70,000), they are labeled as USD reference levels and not conflated with EUR-quoted figures in this report.
- Definitions: BTC dominance is Bitcoin’s share of total crypto market capitalization (reported 58.69%; a direct calculation against the bundle’s total crypto cap yields 58.9%, a minor definitional difference). FDV is price times maximum supply. Supply-mined percentage is circulating supply divided by max supply. Volume/market-cap turnover is 24h volume divided by market cap.
- Data gaps: no current gold or Ethereum price data in the bundle, so benchmark comparisons are qualitative; no current ETF flow figures; no Fed funds rate level provided.
Sources
- [T1] Crypto Market 2025: Year-End Review & Expert Insights, TradingView (99Bitcoins): link
- [T2] Q2 2026 Digital Asset Review, CoinDesk Indices: link
- [T3] Bitcoin Holds Near $80K–$81K as ETF Inflows Revive Bullish Sentiment, HedgeCo: link
- [T4] Bitcoin ETF Flows Lose Momentum After April Surge, HedgeCo: link
- [T5] Bitcoin Price Faces a Pivotal Shift: New Market Structure, Institutional Funds, and Macroeconomics Now Drive Value, CryptoRank: link
- [T6] Bitcoin ETF Flows Remain a Key Market Driver, moomoo Community: link
- [T7] Bitcoin and Ether ETF Inflows Rebound, Blockchain Council: link
- [T8] Bitcoin (BTC) price touches $70,000 as ETF inflows signal institutional interest: Crypto Daybook Americas, CoinDesk: link
Disclaimer
This report is AI-generated and for informational purposes only. It does not constitute investment advice, a recommendation, or an offer to buy or sell any financial instrument. Data may be incomplete, delayed, or inaccurate, and cited news sources vary in quality and timing. Readers should conduct their own due diligence and consult a licensed financial advisor before making investment decisions.
Important Note / Wichtiger Hinweis:
EN: This report may have been generated using AI. It processes data from publicly available sources. The content is provided for informational purposes only.DE: Dieser Bericht kann mithilfe von KI erstellt worden sein. Dabei werden Daten aus öffentlich zugänglichen Quellen verarbeitet. Die Inhalte dienen ausschließlich Informationszwecken.
* DE: Die ergänzenden Inhalte können KI-generiert sein. EN: The additional content may be AI-generated.