
Listen to the summary
Key Data Snapshot
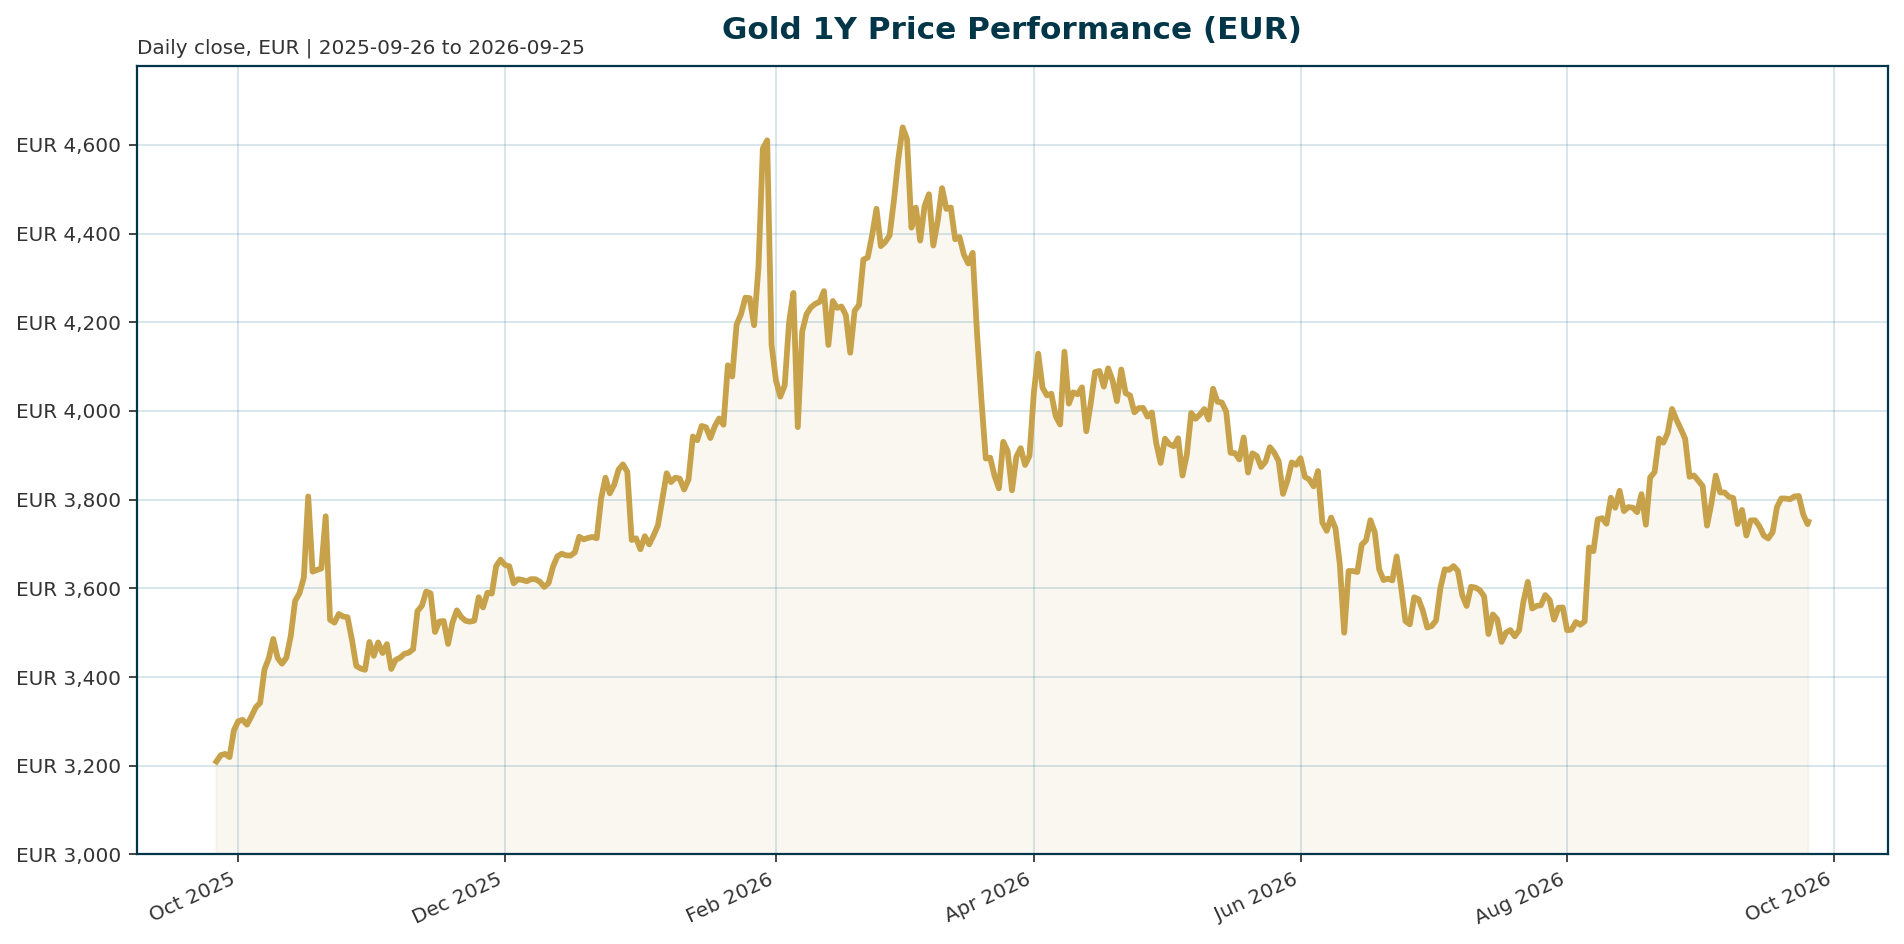
| Metric | Value | Comment |
|---|---|---|
| XAU spot (EUR) | EUR 3,750.43 | Proxied by PAXG/EUR; see Appendix |
| 24h range | EUR 3,731.58 to 3,775.29 | 24h change -0.36% |
| 7d / 14d return | -1.77% / -1.47% | Short-term drift lower |
| 30d / 200d return | -8.27% / -16.44% | Cyclical correction phase |
| 1y return | +13.95% | Positive on all horizons beyond 200d |
| All-time high | EUR 4,688.32 (2026-01-28) | Drawdown -20.0% (3,750.43 / 4,688.32 – 1) |
| Recovery requirement | +25.0% | (4,688.32 / 3,750.43 – 1) to retest ATH |
| All-time low | EUR 1,265.28 (2019-11-17) | +196.4% above ATL |
| Euro AAA 10Y yield | 3.52% | +57.6bp YTD, +24.3bp 1m |
| Euro AAA 2Y yield | 3.22% | +111.0bp YTD, +42.2bp 1m |
| Euro 10Y-2Y spread | 30.5bp | 3.5237% – 3.2183% = 0.305pp |
| EUR/USD | 1.1400 | -0.72% 5d, -2.36% 1m, -3.00% YTD |
| Total crypto market cap | USD 2.53tn | BTC dominance 58.55% |
| US 10Y TIPS real yield | Unavailable | Not in data bundle |
The snapshot shows a two-month cyclical correction: euro area front-end yields have repriced sharply higher YTD (2Y +111bp), raising the euro-denominated opportunity cost of a zero-yield asset, while EUR/USD firmness of -2.36% over one month only partially offsets the underlying softness. The +13.95% one-year return keeps the structural uptrend intact despite the -16.44% 200-day drawdown.
Macro Backdrop
Market overview: Risk sentiment is neutral and equity momentum is mixed, with DACH indicators averaging -0.26% over five days versus +0.75% for global equity peers (DAX -3.81% over one month against ATX +3.14%). The rates backdrop shows mixed euro yields, with the Euro Area AAA 10Y at 3.52% and the 2Y at 3.22% (+42.2bp over one month), while the FX backdrop is mixed: EUR/USD at 1.1400 (-0.72% 5d), EUR/JPY at 180.47 and EUR/GBP at 0.8593 (strongest 5-day FX move at +0.20%). Nikkei 225 leads five-day equity performance at +3.70%; Hang Seng is weakest at -2.99%. This environment leaves gold driven primarily by inflation data and central bank reaction functions rather than sentiment alone.
For gold specifically, the cyclical picture is dominated by rates. Rising Treasury yields, a firmer dollar and a more resilient US economy have created near-term headwinds, with oil-price spillovers complicating the inflation and rate-expectations path [T1]. The Federal Reserve held rates this week, with Powell requiring clearer progress on inflation before further easing; ING still expects two 25bp cuts later in the year, though the September timing has passed and delivery remains unconfirmed as of this report [T3]. Front-end euro repricing (+42.2bp on the 2Y over one month versus +24.3bp on the 10Y) is the live hawkish channel for EUR-quoted gold. On the structural side, central banks continue to diversify reserves, sovereign debt levels keep climbing, and geopolitical fragmentation remains a powerful long-term tailwind [T1]. The tension between these two layers defines the current trade.
Investment Thesis
The core thesis is a dual-driver framework: structural official-sector demand sets the floor, while the real-yield path sets the cycle. Societe Generale describes a clear post-2022 regime shift in which gold trades near record highs despite persistently positive real yields, breaking away from historical models that would imply significantly lower prices. Sustained central bank purchases, dedollarisation trends, geopolitical uncertainty and sovereign debt concerns provide a higher floor that limits the downside impact of elevated real rates [T2].
The structural layer is quantifiable. Central banks have accumulated an average of roughly 1,000 tonnes of gold per year over the past four years, double the ~500t annual average of the preceding decade, according to the World Gold Council’s 2026 survey of 76 monetary authorities, the highest participation on record [T6]. A record 43% of 73 surveyed authorities expect their own gold reserves to rise over the next year, with sanction-risk hedging and volatile inflation cited as motives [T7]. China has extended its buying streak to 18 consecutive months, Poland remains a major buyer, and Eastern European and Asian central banks dominate purchases [T1].
Against this, the cyclical layer is currently negative. The -20.0% drawdown from the January 2026 high reflects a hawkish repricing of euro front-end yields and a firm dollar. Our base case treats this as cyclical consolidation within a structurally elevated range rather than a regime break: deeper pullbacks are expected to attract official-sector and longer-term buyers, which is precisely the floor mechanism SocGen and ING describe [T2][T3]. The alternative thesis, a sharp monetary policy reversal driving a rapid real-yield rise, would let the cyclical driver dominate and test the structural floor at successively lower levels [T4].
Bullish Drivers
- Underpriced inflation risk: SocGen notes markets were pricing only modest additional Fed tightening, and even that would not bring policy in line with the Atlanta Fed’s Taylor Rule model, suggesting inflation risks remain underpriced [T2].
- Record official-sector demand: The ~1,000t four-year purchase average is a structural supply absorber. 90% of surveyed central banks cite gold’s crisis performance as highly relevant, and 95% of emerging-market institutions view geopolitical instability as a key allocation driver versus 67% in advanced economies [T6].
- Debt and financial repression: Public debt-to-GDP ratios in many advanced economies sit at or near post-war highs. History suggests such burdens are resolved through financial repression, inflation or currency depreciation, all scenarios in which gold tends to outperform [T5].
- Reserve diversification momentum: IMF data show central banks added significant net tonnage last quarter, continuing multi-year diversification away from fiat currencies [T8]. Central banks now reportedly hold more gold than Treasuries in aggregate [T5].
- Safe-haven demand: Persistent conflicts in Eastern Europe and the Middle East continue to underpin crisis hedging, while energy-price risk keeps inflation elevated [T8][T3].
- Flow floor mechanism: ETF inflows have moderated but remain positive, and any deeper pullback would likely attract central bank and longer-term investor demand, dampening downside [T2][T3].
Relative Positioning vs Bitcoin and Ethereum
Precise BTC/EUR and ETH/EUR spot prices are unavailable in the current data bundle, so a full relative-return calculation cannot be presented; the comparison below uses aggregates and qualitative differentiation. The total crypto market cap stands at USD 2.53tn with 24h volume of USD 94.0bn and Bitcoin dominance at 58.55%. Gold’s EUR-quoted one-year return of +13.95% was achieved with a maximum drawdown profile far shallower than typical crypto assets, and SocGen notes that lower volatility is improving gold’s appeal to longer-term reserve managers rather than short-term momentum traders [T2].
The structural contrast matters for allocation. Gold is currently priced by fundamental shifts in global reserve management rather than speculative flows [T4], whereas the crypto complex remains risk-asset correlated and flow-driven. In risk-on scenarios, BTC and ETH can be expected to outperform on improving sentiment, narrowing gold’s role to portfolio insurance. In risk-off or geopolitical stress scenarios, gold’s crisis-hedge property, cited by 90% of surveyed central banks [T6], should drive relative outperformance versus both BTC and ETH. For EUR-based allocators, gold’s diversification benefit derives precisely from this asymmetric payoff profile, though the lower realized volatility also implies lower upside capture in broad risk rallies.
Scenario Framework
Scenario A, higher-for-longer (base case, probability ~45%): Sticky energy-driven inflation delays cuts; euro front-end yields stay elevated. Gold consolidates in a EUR 3,500 to 3,900 range with the official-sector floor limiting downside. Verification: 2Y euro AAA yield holding above ~3.20% and no delivered Fed cut by year-end.
Scenario B, easing pivot (~35%): Clearer inflation progress allows the anticipated cuts to be delivered, real yields fall, and gold trends back toward the EUR 4,400 to 4,688 zone. The +25.0% recovery hurdle to the ATH becomes achievable over two to three quarters. Verification: delivered rate cuts, 2Y euro yield below ~3.00%.
Scenario C, stagflation or policy misfire (~20%): Growth slows while inflation persists. ING explicitly flags this combination as supportive for gold over the longer term [T3], and financial-repression outcomes historically favor bullion [T5]. New highs above EUR 4,688 are plausible as both crisis-hedge and debt-suppression demand compound. Verification: rising inflation alongside falling growth prints, steepening long-end with policy hold.
Near-term catalysts across all scenarios are the US data calendar (CPI, Retail Sales, NFP), which drives dollar and real-yield expectations [T8], plus oil-price spillovers into inflation expectations [T1]. Monitoring points also include the pace of the policy pivot, fiscal consolidation versus financial repression debates, and reserve-policy announcements from Asia and the Middle East [T5].
Valuation Discussion
Gold cannot be valued on cash flows, so the relevant question is whether the current price is cheap or expensive relative to its own regime. By historical real-yield models, gold is expensive: SocGen states that historical models would imply significantly lower prices at current positive real yields, and the gap between model price and market price is the structural premium attributable to official-sector buying, dedollarisation and debt concerns [T2]. J.P. Morgan documents the same breakdown: real yields rose to the highest levels since 2008 after 2022, yet gold remained resilient and posted a +13% return in 2023 [T7].
In EUR terms, the current price sits 20.0% below the January 2026 ATH and 196.4% above the 2019 ATL. A simple FX decomposition shows the distinction between quote currencies: the EUR-terms one-year return of +13.95% versus EUR/USD YTD change of -3.00% implies a materially higher USD-terms YTD gold return, approximately 13.95% – (-3.00%) = +16.95%, as a first-order approximation ignoring timing and carry effects. ING’s figure of roughly 6% YTD in USD terms [T3] reflects a different measurement date and should be read as USD-quoted; the discrepancy illustrates why quote-currency convention matters. The carry disadvantage of holding gold versus euro AAA paper is explicit: the 2Y yield of 3.22% represents the annualized opportunity cost of a zero-yield position, meaning gold needs roughly 3.2% annualized price appreciation just to match short-dated euro sovereign carry.
Valuation verdict: gold is not cheap against broken historical models, but at -20.0% from its regime-shifted peak it is cheap relative to the structural floor the official sector has established. Entry discipline favors staged accumulation on pullbacks toward the consolidation range floor rather than momentum chasing.
Risks
- Real-yield shock: A sharp monetary policy reversal driving a rapid rise in real yields is the flagged headwind and would compress the structural premium toward model-implied levels [T4].
- Hawkish data surprise: Hotter-than-expected CPI or NFP prints would reinforce a hawkish Fed stance, strengthen the dollar and pressure gold [T8].
- Slowing official-sector purchases: ING warns central bank buying may slow; a deceleration from the 1,000t pace would remove the price floor and increase sensitivity to speculative flows [T3].
- Profit-taking vulnerability: After YTD gains, the market remains prone to bouts of profit-taking; geopolitics alone is insufficient to lift prices [T3].
- Oil and inflation two-way risk: Oil-price spillovers into inflation and rate expectations cut both ways; higher oil can support gold as an inflation hedge but also supports the hawkish-yields channel [T1].
- Data-quality caveats: Market data are proxied by the PAXG tokenized-gold aggregate (market cap EUR 1.63bn, rank 54), not physical-bullion aggregates. The bundle lacks a US 10Y TIPS real-yield series and BTC/ETH spot prices, so the core cyclical driver is inferred from euro AAA yields plus qualitative source statements. Several sources date to June 2026 and carry ambiguous timestamps, so flow figures (1,000t average, China’s 18-month streak) are secondary coverage of WGC/IMF data rather than primary publications.
Appendix
Methodology and provenance: Price and return data are sourced via Coingecko using PAXG as the XAU/EUR proxy, retrieved 2026-09-25T04:26:58Z. Euro area AAA yields come from the ECB yield curve as of 2026-09-23. FX rates come from Frankfurter as of 2026-09-25. Equity data come from FMP, Wiener Boerse and Yahoo Finance as of 2026-09-24/25. All returns are EUR-denominated; FX translation effects are separated explicitly where relevant. The PAXG proxy reflects a tokenized product with circulating and total supply of 434,898.6 tokens and does not represent the global above-ground gold stock.
Calculation notes: Drawdown from ATH: 3,750.43 / 4,688.32 – 1 = -20.0%. Recovery to ATH: 4,688.32 / 3,750.43 – 1 = +25.0%. Euro curve slope: 3.5237% – 3.2183% = 30.5bp. USD-terms return approximation: EUR-terms 1y return +13.95% minus EUR/USD YTD change -3.00% gives approximately +16.95%, ignoring timing and FX carry.
Sources
- [T1] Central banks keep gold bullish long term | The Star. https://www.thestar.com.my/business/business-news/2026/06/08/central-banks-keep-gold-bullish-long-term
- [T2] It’s time to get bullish on gold again, says SocGen | Kitco News. https://www.kitco.com/news/article/2026-09-03/its-time-get-bullish-gold-again-says-socgen
- [T3] Geopolitics alone isn’t enough to lift gold | ING THINK. https://www.ing.com/articles/geopolitics-alone-isnt-enough-to-lift-gold
- [T4] Gold’s Dual Drivers: Central Bank Flows and Real Yields, According to Societe Generale | CryptoRank.io. https://cryptorank.io/news/feed/e43c1-gold-central-bank-flows-real-yields-societe-generale
- [T5] Report: Central Banks Now Hold More Gold Than Treasuries | CEOWORLD magazine. https://ceoworld.biz/2026/06/15/report-central-banks-now-hold-more-gold-than-treasuries-what-that-means-for-global-capital-and-currencies
- [T6] Central Bank Gold Purchases Hit 1,000t Average: WGC Survey | Mexico Business News. https://mexicobusiness.news/mining/news/central-bank-gold-purchases-hit-1000t-average-wgc-survey
- [T7] Is it a golden era for gold? | J.P. Morgan Private Bank. https://privatebank.jpmorgan.com/nam/en/insights/markets-and-investing/is-it-a-golden-era-for-gold
- [T8] Gold Price Holds Firm Above $4,700 as Traders Await US Data | CryptoRank.io. https://cryptorank.io/news/feed/f2179-gold-price-us-data-market-analysis
Disclaimer: This report is AI-generated and for informational purposes only. It does not constitute investment advice, a recommendation, or an offer to buy or sell any security or asset. Data are provided as retrieved and may contain errors or be subject to revision. Readers should conduct their own research and consult a licensed financial advisor before making investment decisions.
Important Note / Wichtiger Hinweis:
EN: This report may have been generated using AI. It processes data from publicly available sources. The content is provided for informational purposes only.DE: Dieser Bericht kann mithilfe von KI erstellt worden sein. Dabei werden Daten aus öffentlich zugänglichen Quellen verarbeitet. Die Inhalte dienen ausschließlich Informationszwecken.
* DE: Die ergänzenden Inhalte können KI-generiert sein. EN: The additional content may be AI-generated.