
Listen to the summary
Key Data Snapshot
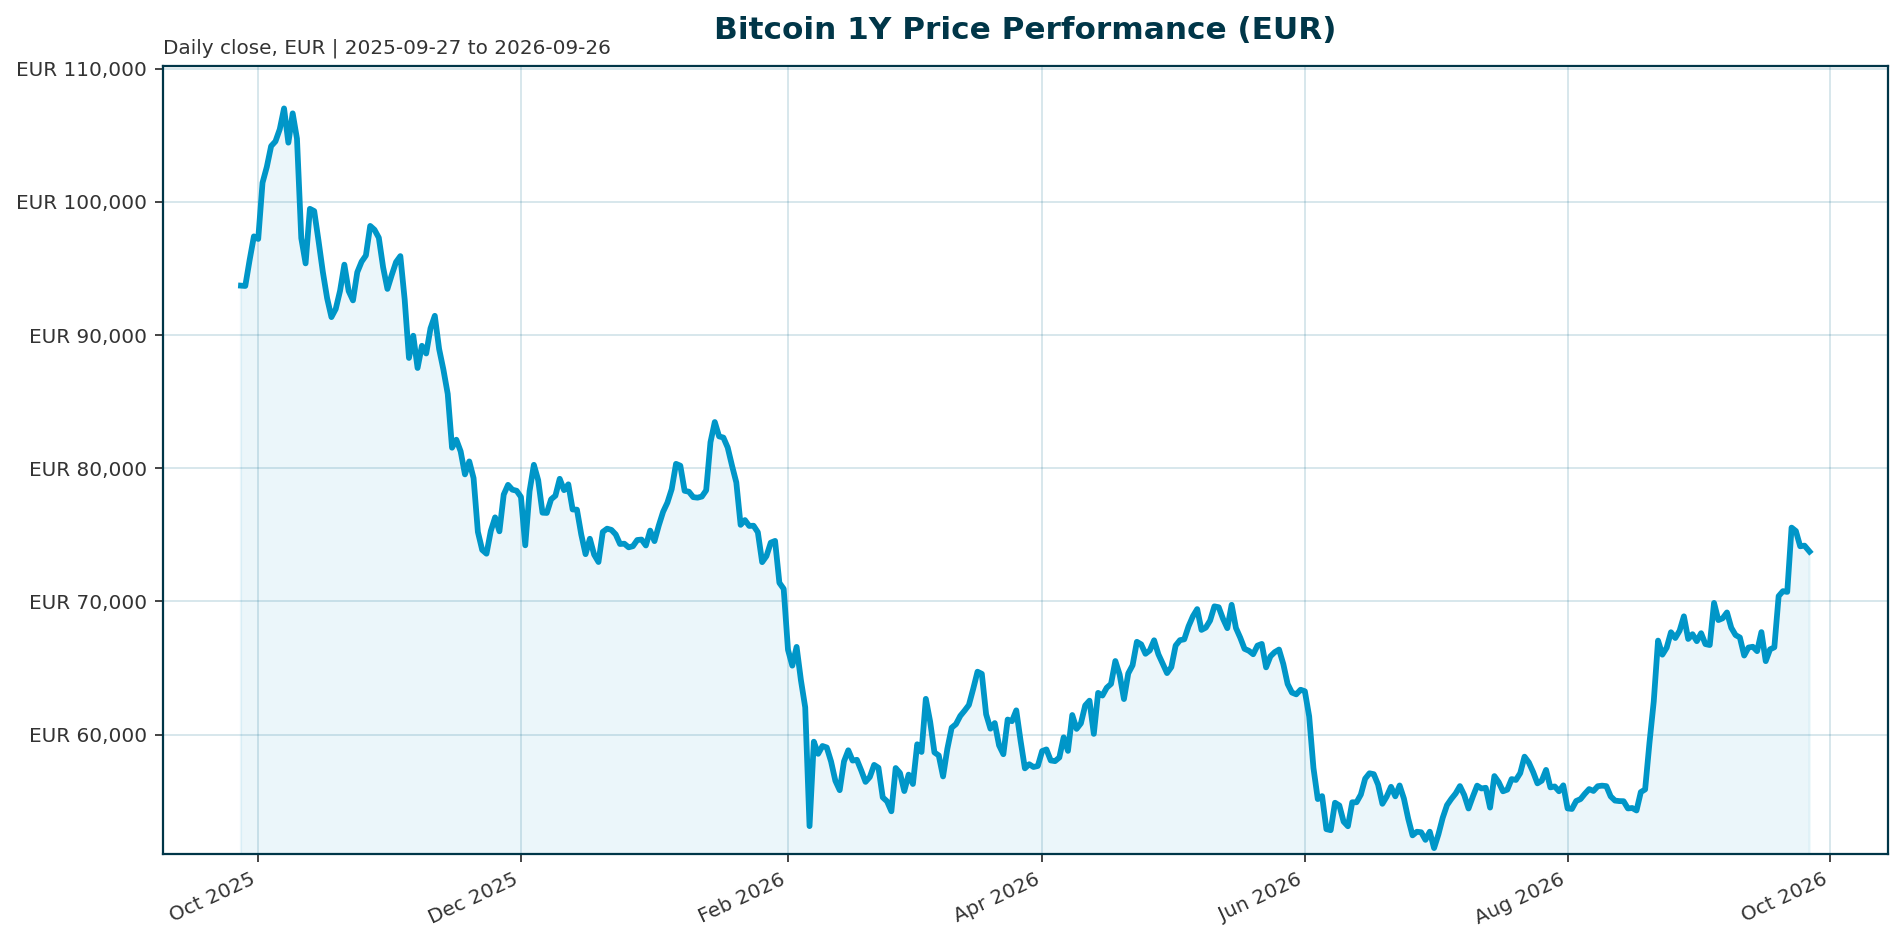
| Metric | Value | Comment |
|---|---|---|
| Price (EUR) | 73,721 | -0.33% over 24h; 24h range 73,062 to 74,799 |
| Market cap (EUR) | 1.481 trillion | Rank 1; equals fully diluted valuation |
| 24h volume (EUR) | 29.91 billion | ~2.02% of market cap (29,908,473,489 / 1,481,079,720,415) |
| Change 7d / 14d / 30d | +3.26% / +8.64% / +6.62% | Short-horizon momentum positive, a basing attempt |
| Change 200d / 1y | +19.36% / -23.47% | Drawdown-and-recovery shape: year-over-year still negative |
| ATH (EUR) | 107,662 (2025-10-06) | Current price -31.52% below ATH ((73,721 – 107,662) / 107,662) |
| Circulating supply | 20,089,409 of 21,000,000 | 95.66% mined; ~910,591 BTC of issuance left |
| BTC dominance | 58.28% | Of EUR 2.54 trillion total crypto market cap |
| Total crypto market cap (EUR) | 2.538 trillion | 24h total volume 91.57 billion |
Gold and Ethereum live prices were not available in the data bundle at publication time; the relative positioning section therefore relies on narrative evidence rather than live benchmark quotes.
Market Setup
Risk sentiment is neutral and equity momentum is mixed. Global equity indicators average +0.31% over 5 days while DACH indicators sit at -0.01%, with the Nikkei 225 the strongest 5-day performer at +3.82% and the Hang Seng the weakest at -2.13%. The rates backdrop is mixed: the euro area AAA 10Y yield stands at 3.57%, up 62bp year to date, with the 10Y-2Y spread at a positively sloped 33.7bp. FX is likewise mixed: EUR/USD trades at 1.1398, down 0.72% over 5 days and 3.01% year to date. Against this backdrop, Bitcoin trades below $82,000-equivalent resistance levels as tighter liquidity and elevated yields raise the opportunity cost of holding a non-yielding asset [T3]. Fed Chair Kevin Warsh is expected to hold rates through Q3 2026, limiting the policy easing that has historically supported risk-asset recoveries [T2]. For EUR-based investors, the 3.0% year-to-date depreciation of EUR/USD cushions EUR-quoted BTC drawdowns whenever the dollar strengthens.
Investment Thesis
Bitcoin has completed a structural transition from a halving-cycle, speculation-driven asset to a flow-driven, allocatable institutional line item. Price is now governed by three variables: market structure, institutional fund flows, and the macro environment [T6]. ETF flows have effectively become Bitcoin’s new macro indicator; in Q4 2025, record outflows from U.S.-listed BTC and ETH ETFs coincided with Bitcoin breaking support near $98,000 (about EUR 86,000 at the current EUR/USD rate of 1.1398) and retesting the low $90,000 range (about EUR 79,000) [T1]. Glassnode data show 6.7 million BTC held across ETFs, exchanges, and treasuries, a supply share the platform calls the institutional supply era [T1]. Volatility has compressed from 84% to 43%, supporting the view that BTC is maturing into a more stable institutional asset, though it remains a high-beta corner of global markets [T1].
The core thesis for EUR-based allocators: Bitcoin is a permanent, regulated institutional exposure whose near-term direction is set by ETF flow data. In Q1 2026, Bitcoin ETFs recorded $18.7 billion in inflows, cementing the ETF wrapper as a fixture in institutional portfolios [T4]. But flows are tactically macro-sensitive: April 2026 showed what the ETF engine looks like when running, May showed it can sputter when macro uncertainty rises [T5]. Dominance of 58.28% confirms BTC remains the core crypto allocation. The strategic adoption thesis is intact; the timing risk is flow-dependent.
Bullish Drivers
- Regulatory catalyst pipeline. The CLARITY Act would establish a federal market-structure framework for digital assets in the U.S. and could unlock broader institutional participation if passed [T2]. Regulatory clarity on custody, market structure, and tax treatment could widen participation among institutions still on the sidelines [T7].
- Institutional product depth. BlackRock’s ETF market dominance, Goldman’s entry, and Citigroup’s portfolio-optimization research give the institutional bid breadth beyond a single provider [T4]. Product innovation, including covered-call crypto ETFs and multi-asset index products, deepens the demand channel [T7].
- Demonstrated flow capacity. $18.7 billion in Q1 2026 ETF inflows [T4] and roughly $467 million of net inflows on May 5 alone, the fourth consecutive positive day, show the demand engine can operate at scale when macro conditions cooperate [T8].
- Supply scarcity. With 95.66% of the 21 million cap mined, marginal price is set almost entirely by demand flows; each unit of sustained inflow meets a largely fixed float.
- Volatility compression. The fall from 84% to 43% volatility [T1] lowers the risk-budget cost of allocation, potentially widening the eligible institutional base.
Relative Positioning vs Gold and Ethereum
Against gold, the 2025 evidence is unfavourable: during the Q4 2025 correction Bitcoin lagged traditional assets including gold and bonds, and more than $1 trillion of crypto market value was erased as BTC fell nearly 30% from its peak [T1]. Gold retains the defensive-hedge mandate edge while yields stay elevated; rising Treasury yields improve the relative appeal of government debt and raise the opportunity cost of holding BTC [T3]. Bitcoin’s bull case versus gold is asymmetric upside: gold’s supply grows with mining, while BTC issuance is nearly exhausted at 95.66% of max supply.
Against Ethereum, BTC holds the dominance advantage at 58.28%. Q4 2025 saw record outflows from both BTC and ETH ETFs, and flow data bundle the two assets, so ETH demand patterns tend to amplify rather than differentiate BTC positioning [T1]. In Asia, adoption is shifting toward tokenization and regulated stablecoins under frameworks such as Hong Kong’s Stablecoins Ordinance, and pure bitcoin ETFs play a smaller strategic role there than in North America and Europe [T2]. Within multi-asset crypto allocations, BTC remains the core holding; ETH is the higher-beta satellite.
Scenario Framework
Price anchors in USD terms are converted to EUR at EUR/USD 1.1398 (as of 2026-09-26). Conversions: $80,000 = EUR 70,187; $85,000 to $90,000 = EUR 74,575 to 78,962; $98,000 = EUR 86,002. Note these anchors move with the exchange rate.
- Base case (qualitative probability ~45-55%). The Fed holds rates through Q3 and flows stay choppy [T2][T5]. BTC oscillates in a broad EUR 70,000 to 79,000 range, roughly the $80,000 support to $90,000 resistance zone in USD terms, with ETF flow data as the swing variable [T8]. Short-horizon momentum (+8.64% over 14d) is consistent with the lower end of this band holding.
- Bull case (~25-30%). A CLARITY Act passage or a shift in Fed communication reignites sustained inflows [T2][T7]. BTC reclaims the EUR 74,575 to 78,962 zone and challenges the former $98,000 support-turned-resistance near EUR 86,002 [T1]. A more strategic, less tactical flow base would compress volatility further and support a durable rerating [T5].
- Bear case (~20-25%). A renewed yield surge and liquidity tightening repeat the sub-$82,000 (EUR 71,995) rejection pattern [T3]. Outflows accelerate as allocators, which remain price- and macro-sensitive, de-risk [T5]. A Q4-2025-style breakdown would target the low-$90,000 USD lows near EUR 78,962 and could extend below EUR 70,187 given historical drawdowns exceeding 50% are not uncommon [T4].
Probabilities are analyst judgments, not model outputs.
Valuation Discussion
Traditional valuation metrics map poorly to Bitcoin, so the assessment rests on supply, positioning, and risk-premium framing. Market cap of EUR 1.481 trillion equals the fully diluted valuation because 95.66% of maximum supply circulates (20,089,409 / 21,000,000); remaining issuance of roughly 910,591 BTC is a negligible dilution source. Scarcity metrics are unchanged; marginal demand, i.e. flows, determines near-term fair value.
The return profile is mid-cycle rather than euphoric: -31.52% from the October 2025 ATH of EUR 107,662, -23.47% over one year, yet +19.36% over 200 days and +6.62% over 30 days. That spread between the 1-year (-23.47%) and 200-day (+19.36%) figures captures the late-2025 breakdown and the 2026 basing attempt. With volatility at 43%, down from 84% [T1], the risk premium embedded in BTC pricing arguably deserves reassessment if the institutional base keeps deepening; a de-rating case exists if flows reverse structurally, since 2025 demonstrated BTC can lag gold and bonds substantially even in the institutional era [T1]. Implied dominance cross-check: 1,481,079,720,415 / 2,537,656,592,090 = 58.37%, versus the reported 58.28%; the small gap reflects rounding and timing differences. Liquidity is adequate: 24h turnover of EUR 29.9 billion equals about 2.02% of market cap.
Separating currency from asset: EUR/USD fell 2.22% over the past month, so part of BTC’s +6.62% 30-day EUR return reflects dollar strength rather than USD-price appreciation. EUR-based return analysis should always decompose this effect.
Risks
- Macro and rates risk. The Fed is expected to hold through Q3 2026 with limited room for easing [T2]. Rising yields raise the opportunity cost of a volatile, non-yielding asset and have already pushed BTC back below the $82,000 resistance area once [T3]. Euro area AAA yields at 3.57% (10Y) offer EUR institutions a competitive risk-free alternative.
- ETF flow reversal risk. Allocators remain price-sensitive and macro-sensitive; flows accelerated in April and faded in May 2026, showing the demand engine can sputter [T5]. Q4 2025 proved outflows can be record-sized and coincide with a 30% drawdown [T1].
- Regulatory risk. Uncertainty persists despite improvements; adverse developments could hit ETF structures or tax treatment [T4]. The CLARITY Act is a catalyst that could also disappoint if delayed or diluted [T2].
- Concentration and correlation risk. The institutional bid creates a strong, but potentially reversible, demand concentration [T4]. As ETFs make BTC more legible to traditional markets, it increasingly trades with the same macro forces as stocks and bonds, undermining diversification value exactly when it is most needed [T5].
- Drawdown risk. Historical drawdowns exceeding 50% are not uncommon in crypto [T4]; a 50% drawdown from the current EUR 73,721 would imply roughly EUR 36,900.
- Data risk. No September 2026 flow or on-chain data was available at publication; current flow direction is inferred from H1 2026 reporting, and sources T4 and T8 are blog-grade, so their figures warrant attribution caution.
Appendix
Methodology and data notes. Market data retrieved 2026-09-26T04:15Z with the asset quoted in EUR; all prices, market caps, and volumes are EUR-denominated unless labeled USD. USD technical levels from news sources are converted at EUR/USD 1.1398 (2026-09-26) and labeled as moving anchors. News timestamps were not available in the source bundle; chronology is inferred from article content. The 24h price change (-0.33%) and market cap change (-0.12%) divergence reflects rounding and timing noise. No live gold or ETH price, derivatives funding, or basis data was available in the bundle. Scenario probabilities are qualitative analyst judgments. Report profile: crypto_institutional.
Sources
- [T1] Crypto Market 2025: Year-End Review & Expert Insights (TradingView)
- [T2] Q2 2026 Digital Asset Review (CoinDesk Indices)
- [T3] US Treasury yields surge to new highs as liquidity tightens, pushing Bitcoin back below $82,000 resistance (CryptoSlate)
- [T4] Bitcoin ETF Institutional Adoption Q1 2026 (Intellectia.ai)
- [T5] Bitcoin ETF Flows Lose Momentum After April Surge (HedgeCo Insights)
- [T6] Bitcoin Price Faces a Pivotal Shift: New Market Structure, Institutional Funds, and Macroeconomics Now Drive Value (CryptoRank)
- [T7] Bitcoin and Ether ETF Inflows Rebound (Blockchain Council)
- [T8] Bitcoin Price Analysis May 2026 (Intellectia.ai)
Glossary. ETF flows: net creations/redemptions in spot Bitcoin ETFs, now the primary real-time demand indicator. BTC dominance: Bitcoin’s share of total crypto market capitalization. FDV: fully diluted valuation, market cap at maximum supply. ATH: all-time high.
Disclaimer. This report is AI-generated, for informational purposes only, and does not constitute investment advice, a recommendation, or an offer to buy or sell any asset. Figures should be independently verified before use in any investment decision.
Important Note / Wichtiger Hinweis:
EN: This report may have been generated using AI. It processes data from publicly available sources. The content is provided for informational purposes only.DE: Dieser Bericht kann mithilfe von KI erstellt worden sein. Dabei werden Daten aus öffentlich zugänglichen Quellen verarbeitet. Die Inhalte dienen ausschließlich Informationszwecken.
* DE: Die ergänzenden Inhalte können KI-generiert sein. EN: The additional content may be AI-generated.