
Listen to the summary
Key Data Snapshot
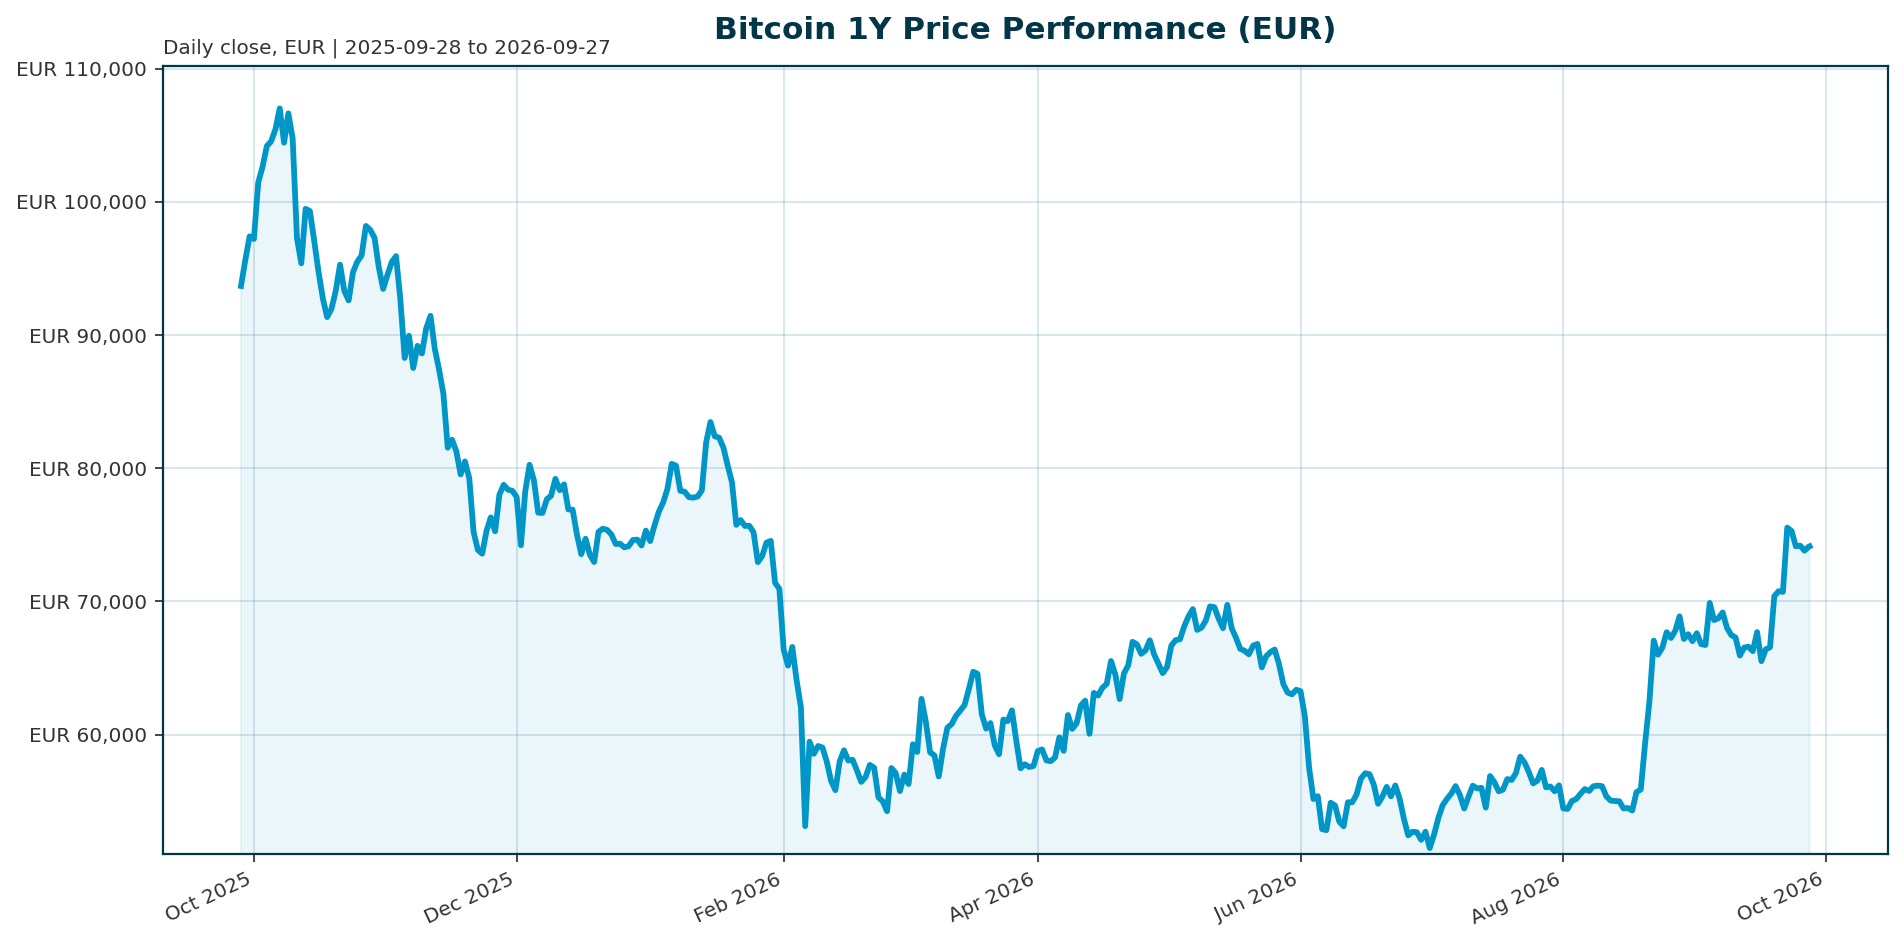
All figures quoted in EUR unless stated otherwise. Data retrieved 2026-09-27T04:15Z; intraday figures subject to change.
| Metric | Value | Detail |
|---|---|---|
| Price | EUR 74,157 | 24h range EUR 73,598 to 74,193 |
| 24h change | +0.60% | 1h: -0.06% |
| 7d / 14d change | +5.12% / +9.20% | Short-term momentum positive |
| 30d / 200d change | +5.57% / +21.26% | Medium-term recovery underway |
| 1y change | -22.90% | Still a post-correction market |
| All-time high | EUR 107,662 (2025-10-06) | Current drawdown -31.12%: (74,157 / 107,662 – 1) |
| Recovery to ATH | +45.2% | 107,662 / 74,157 – 1 |
| Market cap | EUR 1,489.8bn | Rank 1; +EUR 8.69bn (+0.59%) over 24h |
| BTC dominance | 58.34% | 1,489.8 / 2,548.2 total crypto market cap (EUR-equivalent basis) |
| 24h volume | EUR 15.34bn | Turnover: 15.34 / 1,489.8 = ~1.03% of market cap |
| Circulating supply | 20,089,893 BTC | 95.67% of 21,000,000 cap minted; 910,107 remain |
| FDV | EUR 1,489.8bn | Equals market cap because supply is near the hard cap |
Market Setup
The cross-asset backdrop is neutral rather than directional. Risk sentiment is neutral with mixed equity momentum: the Nikkei 225 leads 5-day performance at +3.82% while the Hang Seng lags at -2.13%, and DACH indicators average -0.01% over 5 days versus +0.31% for global equity indices. Rates are mixed: the euro-area AAA 10Y yield sits at 3.57% (+3.6bp over 5 days, +61.8bp YTD), the 2Y is at 3.23% (+112.1bp YTD), and the 10Y-2Y spread stands at a positively sloped 33.7bp. FX is similarly mixed, with EUR/USD at 1.1398 (-0.38% over 5 days, -3.00% YTD) and EUR/CHF posting the strongest 5-day FX move at +0.35%. For a EUR-based investor, this mixed setting matters mainly through two channels: global liquidity conditions, which drive institutional risk budgets for BTC, and EUR/USD translation, which mechanically alters EUR-quoted returns.
The news flow sharpens this into a two-sided rates picture. Rising US Treasury yields have acted as a clear macro headwind, raising the opportunity cost of a volatile, non-yielding asset and making institutional buyers more selective [T2]. On the other side, the Federal Reserve cut rates three times in 2025 and is expected to keep easing through 2026, a backdrop Grayscale argues is consistent with favorable risk appetite and potential gains in crypto [T8]. The setup is therefore a race between a supportive easing cycle and periodic yield-driven liquidity tightening.
Investment Thesis
Bitcoin has entered an institutional flow regime, and that regime is now the correct lens for valuation. The historical four-year halving cycle no longer governs price; market structure, institutional fund flows, and the macro environment are the primary drivers [T3]. ETF flows have effectively become Bitcoin’s new macro indicator: record Q4 2025 outflows from US-listed BTC and ETH ETFs coincided with the break of USD 98,000 support and a nearly 30% peak-to-trough decline that erased more than USD 1 trillion in market value [T1]. Glassnode places 6.7 million BTC across ETFs, exchanges, and treasuries and labels 2025 the start of Bitcoin’s “institutional supply era” [T1].
Against that structure, the current setup is a post-correction positioning question, not a momentum chase. Bitcoin trades 31.12% below its EUR 107,662 October 2025 high and down 22.90% year-on-year, but short- and medium-term momentum is positive (+5.12% over 7 days, +21.26% over 200 days), and the institutional bid has re-emerged: a USD 1.92bn weekly ETF inflow surge in August 2026 signals deepening adoption [T4]. Volatility has compressed from 84% to 43%, evidence of maturation toward a more stable institutional asset [T1].
The thesis is conditional rather than unconditional. In the base case, the institutional flow regime persists and ETF demand, combined with a Fed easing path, gradually repairs the drawdown. The bull case requires flows to sustain through the US Treasury bond buyback program launch, the variable several analysts identify as decisive for the next leg [T4]. The bear case is that yield strength and liquidity tightening repeat the Q4 2025 outflow dynamic. The single most important monitorable is the ETF flow trajectory [T6].
Bullish Drivers
1. Institutional flow scale and concentration. August 2026 weekly ETF inflows reached USD 1.92bn, with BlackRock’s IBIT capturing roughly 70% [T4, T5]. Cumulative ETF flows topped USD 35bn, and daily ETF turnover averages around USD 2.5bn [T6]. These flows represent genuine spot purchases through regulated channels, adding to custodied supply over time [T7].
2. Strategic allocation, not experimentation. Pension funds and endowments have begun allocating 1% to 3% of portfolios to Bitcoin via ETFs, following Wisconsin’s state pension in 2024 [T6]. Disclosures show corporate treasuries, family offices, and conservative pension funds participating, which suggests Bitcoin has crossed into institutional-grade portfolio construction [T5]. Grayscale expects crypto ETPs in many more portfolios by end-2026, with a steady institutional bid rather than one retail wave [T8].
3. Diversification demand. With US inflation sticky near 3.2% (June 2026, sourced estimate), allocators seek non-correlated assets. Bitcoin’s 30-day correlation with the S&P 500 fell to 0.15, a six-month low [T6]. This supports the inflation-hedge and diversification sleeve argument independently of short-term flows.
4. Improving market microstructure. The Coinbase premium turned positive, indicating US institutional buyers paying up for direct exposure [T6]. Realized volatility has halved from 84% to 43% [T1], and 30-day implied volatility around 42% accompanied the July 2026 institutional rally, suggesting demand-driven rather than speculative price support [T6].
5. Scarcity anchor intact. 95.67% of the 21 million cap is minted, FDV equals market cap, and the hard-capped supply structure remains the fundamental scarcity argument institutional capital is expressing through regulated wrappers [T4].
Relative Positioning vs Gold and Ethereum
Limitation first: the bundle contains no live gold or Ethereum price data, so this section relies on narrative comparisons from the source material rather than current relative-return charts.
Versus gold: Bitcoin lagged gold and bonds through the 2025 correction, falling nearly 30% peak-to-trough while remaining a high-beta corner of global markets [T1]. That underperformance is the bear case for the “digital gold” framing: even in the institutional era, BTC has not yet behaved like a low-volatility store of value in drawdowns. The bull case rests on the direction of travel: realized volatility has compressed from 84% to 43% [T1], a directional improvement, though still historically far above gold. Structural arguments favor BTC on transferability, verifiable fixed supply, and a growing regulated wrapper footprint, but gold retains the recorded inflation-hedge track record that BTC is still building. With BTC/S&P 500 correlation at 0.15 [T6], Bitcoin competes directly for the same diversification allocation that gold has traditionally captured.
Versus Ethereum: both assets sit in the same institutional wrapper regime; Q4 2025 record outflows hit BTC and ETH ETFs simultaneously [T1]. Grayscale’s framework favors tokens with clear use case, sustainable revenue, and regulated venues, with staking enabled where possible [T8]. Staking gives ETH a native yield channel inside ETP wrappers, a structural differentiator that Bitcoin cannot match given its zero-yield design. Against that, Bitcoin’s 58.34% dominance of a roughly EUR 2,548bn (USD 2.55 trillion) total crypto market cap and rank 1 position make it the default first allocation for conservative institutions. The plausible medium-term outcome is co-existence: BTC as the monetary store-of-value sleeve, ETH as the use-case and yield sleeve, with rotation risk between them as staking-enabled ETPs broaden ETH’s institutional appeal.
Scenario Framework
Three scenarios with explicit triggers. Forward statements are scenarios, not forecasts.
Bull case (recovery extends). Triggers: ETF inflows sustain or accelerate after the US Treasury bond buyback program launches; the Fed continues easing; inflation eases from ~3.2%. Path: the institutional pipeline drives price toward and beyond the prior cycle high. Reclaiming the EUR 107,662 ATH requires +45.2% from current levels. Grayscale characterizes current conditions as consistent with new highs for crypto [T8]. Concentration normalizing away from IBIT’s ~70% inflow share would signal breadth rather than fragility [T5].
Base case (consolidation with a floor). Triggers: flows stay positive but modest; yields range; EUR/USD stays near current levels. Path: price consolidates with the steady institutional bid providing a floor, mirroring the Grayscale steady-bid thesis [T8]. EUR strength would cap EUR-quoted upside even if USD-quoted BTC rises.
Bear case (flow reversal repeats Q4 2025). Triggers: US yields surge to new highs and liquidity tightens further [T2]; ETF flows flip to sustained outflows; the Treasury buyback disappoints. Path: the Q4 2025 analogue repeats: record outflows, support breaks, and a liquidity-driven drawdown, historically ~30% peak-to-trough with over USD 1 trillion erased [T1]. With 95.67% of supply minted and zero native yield, BTC’s high-beta profile offers no cushion, and EUR strength would amplify the drawdown in EUR terms.
Valuation Discussion
Bitcoin is a non-yielding, fixed-supply asset, so conventional cash-flow valuation does not apply. Four frameworks frame the discussion; none produces a price target.
Scarcity anchor. 20,089,893 of 21,000,000 BTC are minted (95.67%), leaving 910,107 BTC of future issuance. FDV equals market cap at EUR 1,489.8bn. Scarcity is fully priced into the float; marginal price is set by demand, not new supply.
Flow-anchored pricing. In the institutional regime, fair value is a function of regulated capital movement [T1, T3]. Sustained net inflows add to custodied supply and reduce sellable float, justifying a premium over a flow-neutral equilibrium; the reverse holds for outflows [T7]. Context: 24h spot turnover is ~1.03% of market cap (15.34 / 1,489.8), a modest base against which the cited USD 2.5bn daily ETF turnover [T6] is a meaningful marginal-demand channel.
Opportunity-cost anchor. The euro-area AAA 10Y at 3.57% and rising US yields set the hurdle rate for a zero-coupon asset [T2]. As a simplification, not a total-return comparison: a EUR-based holder’s 1-year BTC return of -22.90% trailed AAA 10Y paper by roughly 26.5 percentage points including forgone carry. Rising yields widen the implied discount on scarcity without yield.
Volatility-implied re-rating. Realized volatility falling from 84% to 43% [T1] and implied volatility near 42% [T6] change institutional risk-budget math: lower vol permits larger position sizes at equal risk contribution, a structural re-rating channel independent of price momentum. Grayscale explicitly expects no dramatic surge this cycle, with valuation increasingly reflecting the steady institutional bid rather than retail blow-off dynamics [T8].
Risks
1. Flow concentration. IBIT captured roughly 70% of recent inflows, a single point of failure for institutional Bitcoin demand; a week of heavy outflows through one vehicle could move the market disproportionately [T5].
2. Yield and liquidity sensitivity. Rising US Treasury yields and tightening liquidity previously pushed Bitcoin back below USD 82,000 resistance by raising the opportunity cost of non-yielding assets [T2]. This headwind can recur at any point the easing narrative stalls.
3. Historical drawdown regime. The Q4 2025 episode saw record BTC and ETH ETF outflows coincide with support breaks, over USD 1 trillion erased, and a ~30% decline from peak. Bitcoin lagged gold and bonds; high-beta character persists even in the institutional era [T1].
4. Correlation reversion. The 0.15 BTC/S&P 500 correlation is a recent six-month low [T6]. If it reverts toward historical norms in a broad risk-off move, the diversification benefit disappears exactly when allocators need it, triggering allocation reviews.
5. Inflation hedge credibility. With US inflation sticky near 3.2% (sourced estimate) and real yields elevated, the inflation-hedge framing is contestable; BTC has not yet demonstrated consistent real-yield-negative outperformance [T6].
6. EUR translation risk. EUR/USD at 1.1398 is down 3.00% YTD. A 1% EUR/USD move translates to roughly a 1% opposite EUR-quoted BTC return for constant USD-quoted BTC. EUR strength would depress EUR-quoted returns and amplify EUR-quoted drawdowns.
7. Data and commentary quality. Several flow and volatility figures derive from third-party analyst commentary without disclosed methodology, and ETF flow data captures only one slice of the market and can lag broader sentiment [T7]. Position sizing should not rest on single-source figures.
Appendix
Sources
- [T1] Crypto Market 2025: Year-End Review & Expert Insights, TradingView: link
- [T2] US Treasury yields surge to new highs as liquidity tightens, pushing Bitcoin back below $82,000 resistance, CryptoSlate: link
- [T3] Bitcoin Price Faces a Pivotal Shift: New Market Structure, Institutional Funds, and Macroeconomics Now Drive Value, CryptoRank.io: link
- [T4] Bitcoin ETF Inflows Surge to $1.92 Billion Last Week, Cryptonomist: link
- [T5] Bitcoin ETF Inflows Analysis August 2026, Intellectia: link
- [T6] Bitcoin Clears $65,000 as Institutional ETF Inflows Drive Rally, CryptoRank.io: link
- [T7] Bitcoin ETF Flows Explained: What ETF Inflows and Outflows Mean for Investors, The Block: link
- [T8] 2026 Digital Asset Outlook: Dawn of the Institutional Era, Grayscale Research: link
Methodology and Data Provenance
Market data retrieved 2026-09-27T04:15:07Z; news retrieved 2026-09-27T04:15:12Z; market overview data as of 2026-09-24 to 2026-09-27. All prices in EUR unless noted. USD-denominated ETF flow figures are presented in USD with EUR/USD context rather than converted, since a date-specific FX rate would be required for exact conversion. Gold and Ethereum live benchmark data are unavailable in this dataset; relative comparisons rely on cited narrative sources. Timeline note: some cited news items reference events from different periods (July 2026 rally, October 2025 ATH, Q4 2025 correction) and are used as historical context, not current market state. Volatility and inflation figures are sourced estimates without disclosed methodology and are used as directional evidence only.
Market Overview Data (as of 2026-09-25/27)
| Indicator | Level | 5d / YTD |
|---|---|---|
| DAX | 25,408.6 | -0.65% / +3.75% |
| ATX | 6,943.67 | +0.62% / +30.62% |
| Euro Stoxx 50 | 6,349.5 | +0.19% / +9.55% |
| S&P 500 | 7,743.41 (USD) | -0.27% / +13.12% |
| Nasdaq Composite | 27,068.7 (USD) | -0.20% / +16.46% |
| Nikkei 225 | 66,364.2 (JPY) | +3.82% / +31.83% |
| Hang Seng | 24,510.1 (HKD) | -2.13% / -4.37% |
| Euro Area AAA 2Y / 5Y yield | 3.23% / 3.34% | 2Y +112.1bp YTD |
| Euro Area AAA 10Y / 30Y yield | 3.57% / 3.74% | 10Y +61.8bp YTD; 2s10s 33.7bp |
| EUR/USD / EUR/CHF | 1.1398 / 0.94351 | -0.38% / +0.35% (5d) |
| EUR/JPY / EUR/GBP | 180.40 / 0.86 | -0.02% / +0.19% (5d) |
Glossary
ETF net flows: creations minus redemptions in spot ETFs, a near-real-time signal of institutional positioning that reflects only one slice of the market [T7]. FDV: fully diluted valuation, market cap computed on maximum supply; equal to market cap here because supply is near the 21 million cap. Dominance: BTC share of total crypto market capitalization, 58.34%. Coinbase premium: price spread between Coinbase and Binance, a gauge of US institutional demand; positive readings indicate US buyers paying up [T6]. Implied vs realized volatility: market-implied and historically observed annualized volatility; both near 42-43% currently per cited reports [T1, T6].
Disclaimer
This report is AI-generated and is provided for informational purposes only. It does not constitute investment advice, a recommendation, or an offer to buy or sell any asset. Figures are as of the retrieval timestamps stated above and may be stale or inaccurate. Forward-looking statements are scenarios, not forecasts. Readers should conduct their own due diligence and consult a licensed financial advisor before making investment decisions.
Important Note / Wichtiger Hinweis:
EN: This report may have been generated using AI. It processes data from publicly available sources. The content is provided for informational purposes only.DE: Dieser Bericht kann mithilfe von KI erstellt worden sein. Dabei werden Daten aus öffentlich zugänglichen Quellen verarbeitet. Die Inhalte dienen ausschließlich Informationszwecken.
* DE: Die ergänzenden Inhalte können KI-generiert sein. EN: The additional content may be AI-generated.