
The altii-Gold-Report: Corrective Phase Within a Structurally Supported Regime
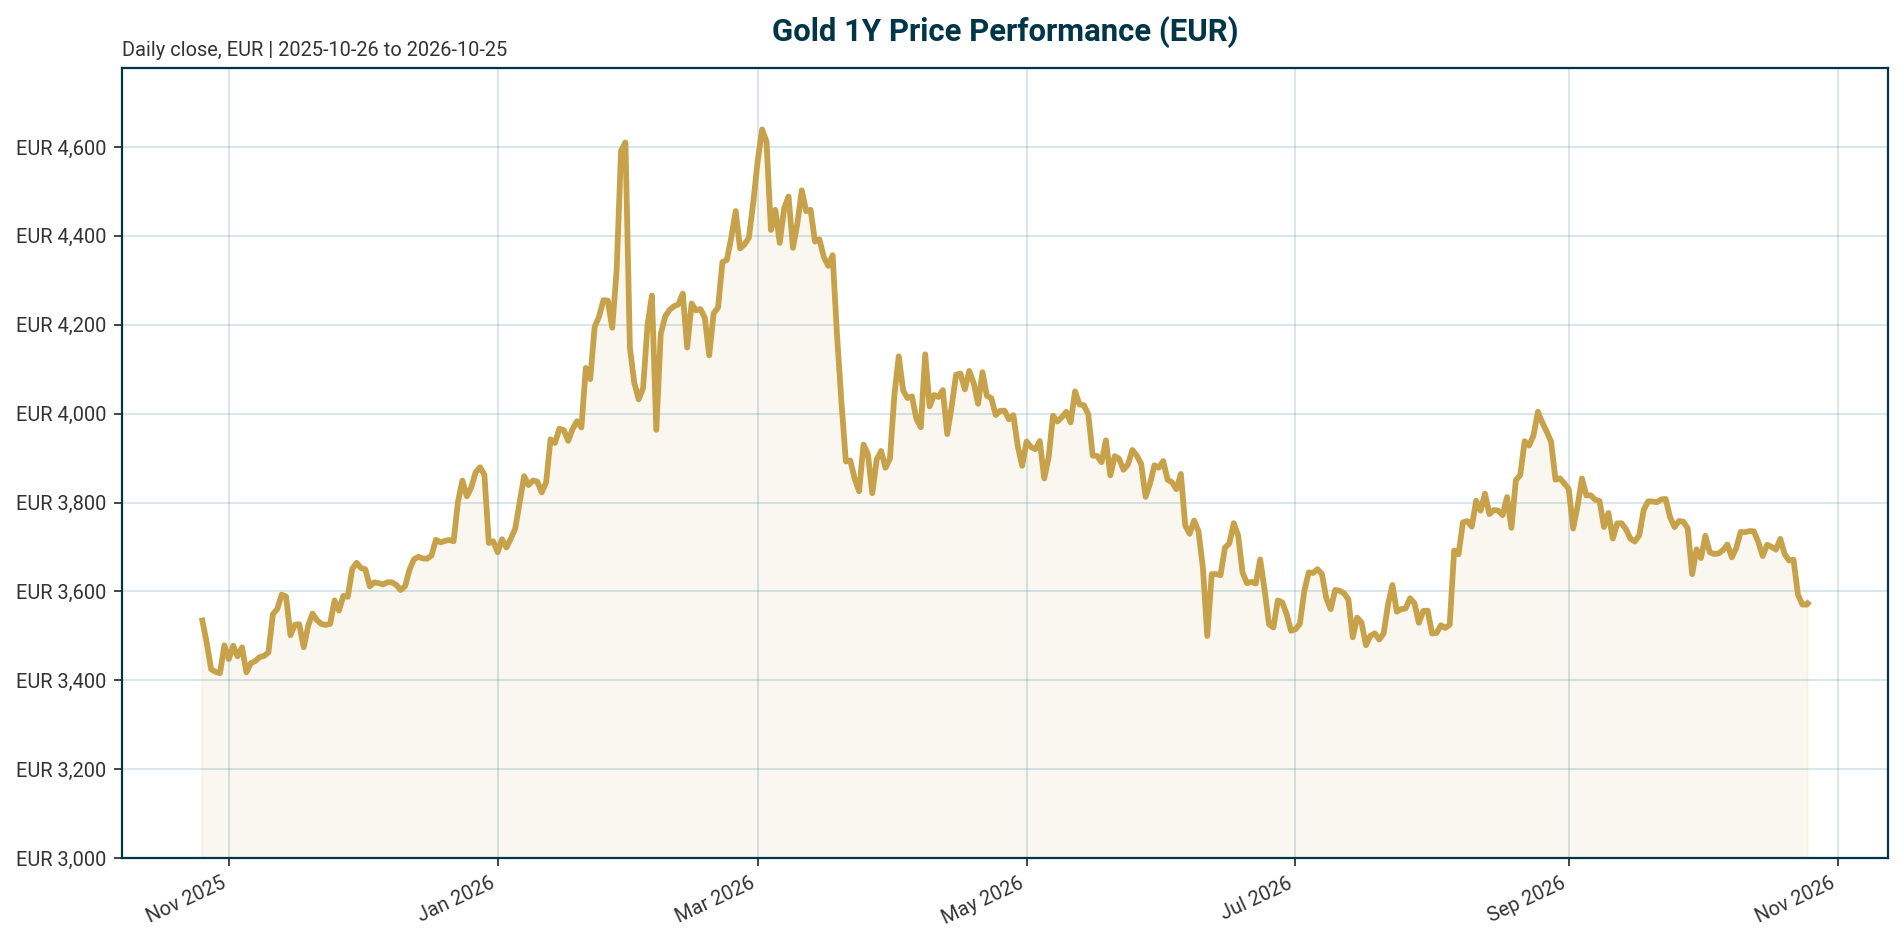
Data as of 25 October 2026. XAU quoted in EUR via PAX Gold proxy.
Watch the video
This player shows only the Gold chapter of the daily altii market briefing. Watch the full video on tube.altii.de.
Key Data Snapshot
| Metric | Value | As of / Note |
|---|---|---|
| XAU/EUR price | EUR 3,573.19 | 24h range EUR 3,556.69 to 3,573.99; 24h change -0.03% |
| 7d / 14d / 30d change | -3.67% / -4.33% / -6.13% | Short-term momentum negative |
| 200d / 1y change | -16.19% / -2.62% | Multi-month drawdown, flat year-over-year |
| All-time high | EUR 4,688.32 | 2026-01-28; current distance -23.79% |
| All-time low | EUR 1,265.28 | 2019-11-17; current level +182.40% |
| Fed funds target | 3.75% to 4.00% | As of 2026-10-24; last change hike 25 bp effective 2026-09-17 |
| ECB deposit facility rate | 2.50% | As of 2026-10-25; last change hike 25 bp effective 2026-09-16 |
| Euro Area AAA 10Y yield | 3.38% | As of 2026-10-22; -6.0 bp over 5 days |
| Euro Area AAA 2Y / 30Y | 3.01% / 3.62% | 10Y-2Y spread 37.7 bp |
| EUR/USD | 1.1219 | As of 2026-10-25; -0.11% over 5 days, -4.52% YTD |
| Market cap / 24h volume | EUR 1.59bn / EUR 58.9m | PAX Gold token aggregates, not physical gold market |
Macro Backdrop
Risk sentiment is negative and equity momentum is broadly negative, with DACH indices broadly in line with global peers. The DAX posted the strongest 5-day move at -0.55% while the Hang Seng was the weakest at -4.52%; the DAX leads on a 1-month basis at -0.90%. The rates backdrop is mixed: the Euro Area AAA 10Y yield stands at 3.38%, down 6.0 bp over 5 days, with the 10Y-2Y spread at 37.7 bp. FX is likewise mixed, with EUR/USD at 1.1219 (-0.11% over 5 days). This defensive configuration is, on balance, supportive of gold demand even as the metal sits in a corrective phase.
Policy is restrictive on both sides of the Atlantic. The US Federal Funds Target Range stands at 3.75% to 4.00% following a 25 bp hike effective 2026-09-17, and the ECB Deposit Facility Rate stands at 2.50% following a 25 bp hike effective 2026-09-16. For context, according to the undated BigGo Finance piece [T1], Bundesbank President Nagel defended ECB rate increases of 25 bp in both June and September, citing supply-side inflation risks including an oil price move from roughly $70 to above $100 after the US-Iran conflict; the June move is not in the authoritative policy rate dataset and should be treated as sourced context only. The same undated source reports US Treasury yields above 5% with gold holding above $4,000 per ounce; no current US Treasury yield level is in the dataset.
Investment Thesis
Gold in EUR terms is in a corrective phase within a structurally supported regime. The price of EUR 3,573.19 sits 23.79% below the January 2026 all-time high of EUR 4,688.32, a drawdown that has extended to -16.19% over 200 days. Yet the structural demand pillar remains intact: central banks have accumulated an average of 1,000 tonnes of gold per year over the past four years, double the 500-tonne average of the preceding decade [T6]. According to the undated BigGo Finance report [T1], Bundesbank President Nagel disclosed that gold’s share of global central bank reserves has risen from roughly 14% in 2023 to nearly 25%, and the World Gold Council’s 2026 survey shows a record 45% of respondents expect their own reserves to increase over the next 12 months, with 89% expecting global reserves to rise [T6].
The critical regime change is the weakening of gold’s traditional inverse correlation with real yields. Per the undated T1 report, fund managers at the LBMA conference noted gold held firmly above $4,000 per ounce even as US Treasury yields broke above 5%, driven by unsustainable debt burdens, persistent inflation, and fiat purchasing-power concerns. J.P. Morgan Private Bank makes the same point with historical data: gold posted a +13% return in 2023 to a then-record $2,068 per ounce despite the highest real yields since 2008 [T2]. For a EUR-based investor, the thesis is therefore accumulation on weakness, not momentum chasing: restrictive real rates cap rallies, but official-sector flows and the debasement narrative provide a floor.
Bullish Drivers
- Structural official-sector demand. Central banks accumulated an average of 1,000 tonnes annually over the past four years versus 500 tonnes in the prior decade, including 1,037 tonnes in 2023 and a record 1,082 tonnes in 2022 [T6] [T7]. The 2026 survey shows 89% of respondents expect global central bank gold reserves to rise over the next 12 months [T6].
- Geopolitical hedging and reserve diversification. Countries facing elevated geopolitical risks and nations seeking to reduce dollar vulnerability to sanctions are increasing gold reserves [T2] [T4]. OMFIF, writing in September 2025, argues gold’s role as a hedge against volatility and geopolitical risk will continue to grow in reserve portfolios [T4].
- The debasement trade. Per the undated T1 report, unsustainable global debt burdens, persistent inflation, and fiat purchasing-power concerns are driving investor allocations, and the inflation narrative underpinning gold demand is expected to persist.
- Vaulting geography signals tail-risk hedging. The Dutch Central Bank moved approximately 86 tonnes from the US and Canada to London between March and August 2026 as part of crisis preparedness, shifting the US share of Dutch gold from 31.3% to 18.5% [T1].
- Current risk-off backdrop. Negative equity momentum globally, with the Hang Seng down 4.52% over 5 days, supports defensive gold allocation (market overview data).
- Yield-correlation breakdown. Gold’s resilience above $4,000/oz despite 5%+ US yields suggests the market now prices fiscal and monetary credibility risk that overrides rate headwinds [T1].
Relative Positioning vs Bitcoin and Ethereum
The dataset limits quantitative comparison. Available crypto aggregates show BTC dominance at 59.46% and a total crypto market cap of approximately USD 2.434 trillion with USD 50.24 billion in 24h volume, retrieved 2026-10-25. No ETH price or performance data is present in the dataset, so no ETH-relative return comparison can be made. Note also that gold’s 24h volume of EUR 58.9 million refers to the PAX Gold token, not physical gold turnover, and must not be compared to crypto market volume as like-for-like liquidity.
Qualitatively, gold’s -2.62% one-year EUR return positions it as a capital-preservation asset in a year when it is consolidating rather than trending. With risk sentiment negative and BTC dominance elevated at 59.46%, capital tends to concentrate in the largest crypto asset during risk-off phases; gold competes for the same defensive flows but with a structurally lower volatility profile. If the debasement trade broadens, gold and crypto can rally together as fiat-skeptic assets; if liquidity contracts, gold historically retains the lower-drawdown profile.
Scenario Framework
Base case (assumption). The Fed holds at 3.75% to 4.00% and the ECB at 2.50% into year-end. Lombard Odier wrote in May 2026 that the Fed was likely to keep policy rates on hold for much of 2026 with any cut more likely toward year-end [T5]; this expectation predates the September 2026 hike and must be treated as a dated scenario input, not current consensus. Euro AAA 10Y yields oscillate around 3.3% to 3.4%. XAU/EUR consolidates in a range below the ATH, with central bank demand providing a floor near current levels.
Bull case (assumption). Inflation re-acceleration, consistent with the oil-above-$100 narrative in the undated T1 report, re-ignites the debasement trade despite restrictive rates. A policy pivot toward cuts, or a fiscal-credibility shock, compresses real yields and gold re-tests the EUR 4,688 ATH region, roughly +31% from current levels.
Bear case (assumption). Higher-for-longer real yields, a stronger dollar, and fading ETF and physical demand extend the drawdown beyond the current -16.19% on a 200-day basis. Lombard Odier explicitly flags higher-for-longer real yields, a prolonged ETF demand decline, and weaker jewellery demand as the key negative factors [T5].
Valuation Discussion
Gold has no cash flows, so no intrinsic valuation model applies. The relevant framings are drawdown, opportunity cost, and regime.
Drawdown positioning. XAU/EUR at EUR 3,573.19 is -23.79% below its January 2026 ATH (calculation: 3,573.19 / 4,688.32 – 1 = -23.79%) and +182.40% above its November 2019 ATL of EUR 1,265.28. The one-year return of -2.62% suggests consolidation, not collapse.
Opportunity cost. With the Fed funds target at 3.75% to 4.00% and the ECB deposit rate at 2.50%, cash and short-dated bonds offer meaningful positive nominal carry versus zero-yield gold. A EUR-based investor forgoes roughly 3.01% annually versus a Euro AAA 2Y bond at current yields, before any FX effect. No euro-area inflation print is in the dataset, so euro-area real yields cannot be computed precisely; the 3.38% AAA 10Y yield serves as a nominal proxy only.
Regime question. The valuation debate centers on whether the historical real-yield sensitivity has durably weakened. J.P. Morgan documents the breakdown over the past two years [T2], and the undated T1 report describes a “re-anchoring” of gold’s pricing logic. If debt sustainability and reserve diversification justify a structurally higher equilibrium, the current -23.79% drawdown is a discount. If the old real-yield regime reasserts, current policy rates imply gold remains expensive relative to a real-rate-derived fair-value band. Both readings are defensible; the evidence tilts toward the former given persistent official-sector flows.
Risks
- Higher-for-longer real yields. The primary downside risk per Lombard Odier (May 2026) [T5]. Both the Fed and ECB delivered 25 bp hikes in September 2026; further tightening would raise gold’s opportunity cost.
- Private demand erosion. A prolonged decline in ETF demand or weaker physical and jewellery demand, only partly offset by central bank buying, would remove the marginal price-setting buyer [T5].
- FX transmission. EUR/USD appreciation would mechanically depress XAU/EUR even if USD gold is stable. EUR/USD at 1.1219 is down 4.52% YTD, meaning the euro has weakened against the dollar this year, which has cushioned EUR-quoted gold; a reversal would remove that cushion.
- Extrapolation risk. Analysts at the LBMA conference cautioned that the debasement trade does not imply a one-way rally [T1].
- Data gaps. No current US Treasury yield, US CPI, euro-area HICP, or ETH price is in the dataset. Sources T1, T2, T3, and T8 lack publication dates, and their figures must not be read as current state. The T3 LinkedIn post references Fed rate-hike odds moving down after a soft jobs report, which conflicts in direction with the actual September 2026 hike and should be treated cautiously.
- Proxy risk. XAU/EUR pricing via the PAX Gold token can deviate from physical spot during stress.
Appendix
Methodology and Data Provenance
XAU/EUR is quoted via PAX Gold (CoinGecko id pax-gold); the market cap of approximately EUR 1.59 billion and 24h volume of EUR 58.9 million reflect the token, not the physical gold market. Yield curve data comes from the ECB AAA euro area yield curve as of 2026-10-22. FX data comes from the Frankfurter API as of 2026-10-25. Equity data is as of 2026-10-23. Policy rates come from the authoritative Policy Rates block: Fed funds target 3.75% to 4.00% (as of 2026-10-24, last change hike of 25 bp effective 2026-09-17) and ECB Deposit Facility Rate 2.50% (as of 2026-10-25, last change hike of 25 bp effective 2026-09-16).
Key Calculations
- Distance to ATH: 3,573.19 / 4,688.32 – 1 = -23.79%.
- Appreciation since ATL: 3,573.19 / 1,265.28 – 1 = +182.40% since November 2019.
- Official-sector flow doubling: 1,000t four-year average versus 500t prior-decade average, a 100% increase in annual central bank demand [T6].
- FX decomposition (approximation): the XAU/EUR 30d return of -6.13% versus the EUR/USD 1-month move of -1.55% implies the majority of the EUR-quoted decline reflects USD gold weakness rather than euro strength.
Source Dating Caveats
T1, T2, T3, and T8 lack publication dates and are treated as undated context. T5 is dated May 2026. T4 is dated September 2025. T6 and T7 belong to the World Gold Council 2026 survey cycle.
Glossary
- Real yield: an interest rate adjusted for inflation; the true inflation-adjusted return on a bond.
- Opportunity cost: the yield forgone by holding a non-yielding asset such as gold instead of bonds or cash [T8].
- Debasement trade: allocating to hard assets such as gold as a hedge against fiscal deficits, monetary expansion, and erosion of fiat purchasing power [T1].
- Reserve diversification: central bank reallocation of reserves away from individual fiat currencies toward gold to reduce sovereign and sanctions exposure [T4].
Sources
- [T1] Gold Holds Above $4,000 Even as US Treasury Yields Top 5% — Institutions Say Gold’s Pricing Logic Is “Re-Anchoring” — BigGo Finance
- [T2] Is it a golden era for gold? | J.P. Morgan Private Bank U.S.
- [T3] Gold vs Silver: Macro Backdrop and Central Bank Buying
- [T4] Central banks are turning back to gold – OMFIF
- [T5] Gold’s slowdown doesn’t signal a reversal | Lombard Odier
- [T6] Central Bank Gold Reserves Survey 2026 | World Gold Council
- [T7] Central Bank Gold Reserves Survey | World Gold Council
- [T8] What Affects Gold Prices? 6 Key Factors Explained | XTB
Disclaimer
This report is AI-generated, is provided for informational purposes only, and does not constitute investment advice. It should not be relied upon as a basis for investment decisions. Figures are drawn from the cited sources and datasets as of the stated dates and may be incomplete, undated, or subject to revision.
Important Note / Wichtiger Hinweis:
EN: This report may have been generated using AI. It processes data from publicly available sources. The content is provided for informational purposes only.DE: Dieser Bericht kann mithilfe von KI erstellt worden sein. Dabei werden Daten aus öffentlich zugänglichen Quellen verarbeitet. Die Inhalte dienen ausschließlich Informationszwecken.
* DE: Die ergänzenden Inhalte können KI-generiert sein. EN: The additional content may be AI-generated.