
Watch the video
This player shows only the Gold chapter of the daily altii market briefing. Watch the full video on tube.altii.de.
Key Data Snapshot
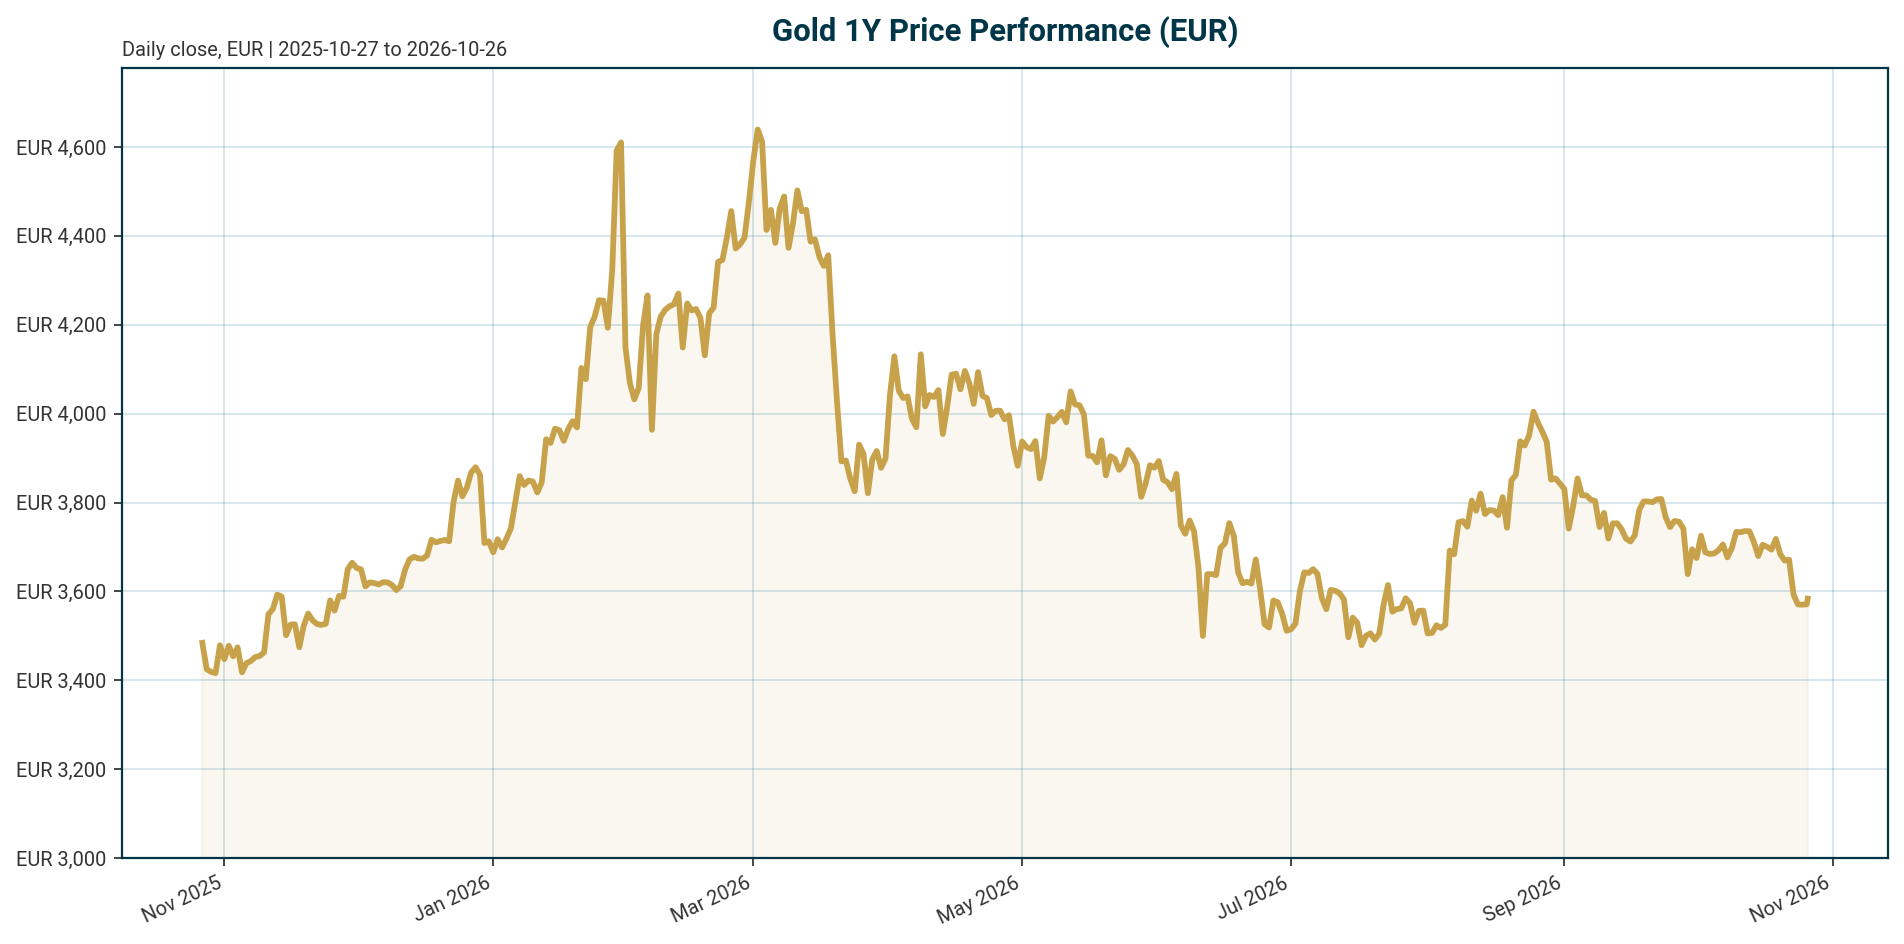
XAU quoted in EUR via the PAX Gold proxy, retrieved 2026-10-26 05:19 UTC. All price metrics are EUR per troy ounce unless stated otherwise.
| Metric | Value | Note |
|---|---|---|
| XAU/EUR price | EUR 3,583.60 | +0.29% 24h; 24h range EUR 3,556.89 to 3,585.06 |
| 7d / 14d / 30d change | -3.61% / -4.19% / -6.10% | Corrective phase |
| 200d / 1y change | -14.41% / -2.12% | Flat over a year in EUR terms |
| All-time high | EUR 4,688.32 (2026-01-28) | Spot is -23.56% below; gap of EUR 1,104.72 |
| All-time low | EUR 1,265.28 (2019-11-17) | Spot is +183.23% above |
| Fed funds target | 3.75% to 4.00% | As of 2026-10-25; last change: hike of 25 bp, effective 2026-09-17 |
| ECB deposit facility rate | 2.50% | As of 2026-10-26; last change: hike of 25 bp, effective 2026-09-16 |
| Euro AAA 2Y / 10Y yield | 3.01% / 3.38% | 10Y -6.0 bp over 5 days; 10Y-2Y spread 37.7 bp |
| EUR/USD | 1.1217 | -0.17% 5d; -4.54% YTD |
| BTC dominance / total crypto cap | 60.02% / USD 2.386tn | Benchmark context |
Macro Backdrop
Risk sentiment is negative and equity momentum is broadly negative, with DACH indicators averaging -2.09% over five days versus -1.92% for global peers. The DAX is the strongest five-day performer at -0.55% and the ATX the weakest at -3.63%. The rates backdrop is mixed: the euro area AAA 10Y yield sits at 3.38% after a -6.0 bp five-day move, while the 2Y at 3.01% is up 89.9 bp year to date, leaving a 37.7 bp curve slope. FX is mixed: EUR/USD trades at 1.1217, down 0.17% over five days and 4.54% year to date. These conditions are subordinate to the gold-specific analysis below but frame the EUR-denominated opportunity cost and currency translation of the metal.
Policy is restrictive on both sides of the Atlantic. The Federal Reserve funds target stands at 3.75% to 4.00% after a 25 bp hike effective 2026-09-17, and the ECB deposit facility rate is 2.50% after a 25 bp hike effective 2026-09-16. Bundesbank President Nagel defended the ECB’s June and September 25 bp increases, citing inflation risks following the US-Iran conflict, with oil rising from roughly $70 before the summer to above $100 according to the undated source [T2]. ING notes that energy prices complicate the inflation outlook and delay monetary easing, but argues a stagflationary mix of slower growth and persistent inflation would remain supportive for gold over the longer term [T4]. The base case is therefore elevated real yields near term, with the inflation-hedge narrative as the offsetting force.
Investment Thesis
The core thesis is a regime-shift argument with a cyclical overlay. Structurally, gold has decoupled from the real-yield models that historically priced it. Société Générale, in a piece dated 2026-09-03, describes a “clear post-2022 regime shift”: gold has traded near record highs despite persistently positive real yields, with central bank purchases, dedollarisation, geopolitical uncertainty and sovereign debt concerns providing a higher price floor [T1]. Its dual-driver framework names central bank flows and real yields as the two primary forces, with a sharp monetary reversal pushing real yields rapidly higher as the key risk [T5].
The structural driver is measurable. Central banks accumulated an average of 1,000t per year over the past four years, double the 500t average of the prior decade, per the World Gold Council 2026 survey conducted between 2026-02-05 and 2026-05-19 [T6][T8]. Gold’s share of global central bank reserves has risen from roughly 14% in 2023 to nearly 25%, per Nagel via an undated source [T2], a relative increase of about 78% in under five years. Cyclically, however, the September 2026 hikes by both the Fed and the ECB, a firm dollar (EUR/USD -4.54% YTD) and a -14.41% 200-day drawdown in XAU/EUR confirm a corrective phase. For EUR investors the firm dollar partially cushions the USD-price weakness. The balance: structural demand justifies holding gold as a portfolio hedge, but the tape argues against chasing; accumulation on weakness is the higher-conviction expression than momentum entry.
Bullish Drivers
- Official-sector accumulation. Central banks bought an average of 1,000t per year over four years versus 500t in the prior decade; 89% of surveyed reserve managers expect global central bank gold reserves to rise over the next 12 months and a record 45% expect their own reserves to increase (survey window Feb 5 to May 19, 2026) [T6][T8].
- Reserve-share migration. Gold’s share of global central bank reserves rose from roughly 14% in 2023 to nearly 25%, per Nagel via an undated source [T2].
- Operational repositioning. The Dutch central bank moved approximately 86 tonnes from the US and Canada to London between March and August 2026, cutting the US share of Dutch gold from 31.3% to 18.5% and lifting London to 32.1%, framed as crisis preparedness per an undated source [T2].
- Debasement trade. Unsustainable debt burdens, persistent inflation and fiat purchasing-power concerns are driving allocations, per LBMA conference participants via an undated source [T2]. The 2022 record of 1,136t in purchases worth around $70bn, with China, India and Turkey leading, illustrates the trend per a source dated 2026-10-12 [T3].
- Weakening yield correlation. Gold held above $4,000/oz even with US Treasury yields above 5%, per an undated source [T2]; SocGen argues much of the hawkish adjustment is already priced and downside risk appears limited [T1].
- Steady private demand. ETF inflows have moderated but remain positive, and lower volatility improves gold’s appeal to longer-term reserve managers, per SocGen dated 2026-09-03 [T1].
Relative Positioning vs Bitcoin and Ethereum
Against the crypto complex, gold’s profile is defensive. BTC dominance stands at 60.02% and total crypto market capitalisation at approximately USD 2.386tn with USD 44.15bn in 24-hour volume, confirming crypto as a large but risk-on-adjacent asset class. With risk sentiment negative and DACH equities down an average of 2.09% over five days, gold’s -3.61% seven-day move looks like consolidation rather than the high-beta drawdowns crypto typically suffers in the same tape. Neither asset pays a yield, so both face the same opportunity-cost headwind from a 3.75% to 4.00% Fed funds range and a 2.50% ECB deposit rate; the difference is volatility and drawdown behaviour, where gold’s -23.56% distance from its January 2026 high is modest by crypto standards.
Data limitation: the bundle contains no ETH or BTC price series, so a quantitative XAU versus ETH and BTC comparison over the 7d, 30d, 200d and 1y windows is unavailable in this dataset. The qualitative conclusion stands: in a risk-off regime gold should outperform on a risk-adjusted basis, while in a risk-on recovery crypto beta would likely lead and gold’s role narrows to portfolio insurance.
Scenario Framework
All scenarios are labeled assumptions, not forecasts. Policy anchors come exclusively from the Policy Rates block: Fed funds at 3.75% to 4.00% and the ECB deposit rate at 2.50%, both following September 2026 hikes.
- Base case. Both central banks hold at current restrictive levels through year-end; real yields stay elevated but range-bound. SocGen argues a materially larger inflation shock would be needed for another significant rates repricing [T1], and Lombard Odier wrote in May 2026 that the Fed is likely to hold for much of 2026 with any cut more likely towards year-end [T7]. XAU/EUR consolidates between roughly EUR 3,400 and EUR 3,800 with central bank buying providing a floor.
- Bull case. Energy-driven inflation re-accelerates (oil above $100 per an undated source [T2]) and erodes policy credibility; real yields fall despite nominal yields. XAU/EUR retests the EUR 4,200 to 4,688 zone.
- Bear case. Additional hikes beyond September 2026 plus a stronger dollar push real yields to new highs and ETF outflows resume, the risk list Lombard Odier flagged in May 2026 [T7]. XAU/EUR breaks below EUR 3,400 toward the 200-day trend region.
Cross-scenario note: for context, ING’s US economist at one point expected two 25 bp Fed cuts in September and December [T4]. That expectation predates the actual 25 bp hike effective 2026-09-17 and is stale; it must not be read as the current policy path.
Valuation Discussion
Gold has no cash flows, so valuation rests on relative and regime framing. At EUR 3,583.60, XAU/EUR is 23.56% below its January 2026 high of EUR 4,688.32 (a gap of EUR 1,104.72) and 183.23% above its 2019 low of EUR 1,265.28. The -6.10% 30-day and -14.41% 200-day moves characterise a meaningful but not extreme correction within a structurally elevated range.
SocGen’s argument, dated 2026-09-03, is that traditional models imply significantly lower prices than spot, meaning the structural floor from roughly 1,000t per year of official buying is not captured by historical fair-value frameworks [T1]. Under that lens, EUR 3,500 to 3,600 looks like fair value in the base case rather than a stretched valuation. ING noted at an earlier, undated point in 2026 that gold up roughly 6% year to date left the market vulnerable to profit-taking, but that deeper pullbacks attract central bank and long-term buyers [T4]; that YTD figure conflicts with the current -2.12% one-year EUR return and reflects an earlier market state. As labeled scenarios: if the yield correlation fully re-normalises, model-implied fair value would sit materially below spot, implying 10% to 20% downside; a dip toward EUR 3,300 to 3,400 would be an attractive entry if the structural demand thesis holds. Note the market cap of EUR 1.59bn on 444,094 oz of circulating supply reflects the tokenized PAX Gold proxy, not the gold market, so valuation is framed on price only.
Risks
- Higher-for-longer real yields. With the Fed at 3.75% to 4.00% and the ECB at 2.50% after September 2026 hikes, further tightening would pressure the no-yield appeal of gold. SocGen via an undated source flags a sharp monetary reversal driving real yields rapidly higher as the key headwind [T5].
- Demand deterioration. Lombard Odier’s May 2026 risk list: higher-for-longer real yields, a prolonged decline in ETF demand, and weaker physical or jewellery demand [T7].
- Dollar and oil dynamics. Higher oil prices and a firmer dollar pushed gold below $4,200 per a source dated 2026-10-12, which notes gold pays no interest and becomes less attractive when rates are high [T3].
- Correlation risk. Analysts caution the debasement trade does not imply a one-way rally [T2], and geopolitics alone is insufficient; direction depends on inflation, policy expectations and real rates [T4].
- Tail risk. A combination of additional hikes and a USD rally could extend the current -14.41% 200-day move into a 15% to 20% EUR-term drawdown. Mitigant: central bank buying at the 1,000t per year pace has historically absorbed supply and limited drawdown depth [T5][T6].
- Data-quality risk. Several sources are undated, and the ING rate-cut expectation conflicts with the actual September 2026 hike. Undated figures are flagged as such throughout and should not be treated as current state.
Appendix
Methodology and Data Provenance
- Price data: XAU/EUR via the PAX Gold tokenized proxy (coingecko_id pax-gold), retrieved 2026-10-26T05:19:37Z. This is a tokenized instrument, not LBMA spot; small tracking differences versus physical spot are possible.
- Policy rates reference: Fed funds target 3.75% to 4.00% (as of 2026-10-25; last change hike of 25 bp, effective 2026-09-17); ECB deposit facility rate 2.50% (as of 2026-10-26; last change hike of 25 bp, effective 2026-09-16). These are the only authoritative rate levels used in this report.
- Market overview as-of dates: DAX, ATX, S&P 500, Nasdaq 2026-10-23; Euro Stoxx 50, Nikkei, Hang Seng, FX pairs 2026-10-26; ECB yield curve 2026-10-22.
- Source dating: T1 dated 2026-09-03 (per URL); T3 dated 2026-10-12 (per URL); T7 dated May 2026 (per URL); T6 survey window 2026-02-05 to 2026-05-19; T2, T4 and T5 are undated and all figures from them carry an undated-source flag.
- Data gaps: no current US CPI or euro area HICP print in the dataset; no US Treasury yield or TIPS real-yield level in the dataset (the 5% reference exists only via undated T2); no current oil price level in the dataset; no BoE policy rate in the dataset; no ETH or BTC price series in the dataset, so the crypto comparison is qualitative only.
Sources
- [T1] It’s time to get bullish on gold again, says SocGen | Kitco News
- [T2] Gold Holds Above $4,000 Even as US Treasury Yields Top 5% | BigGo Finance
- [T3] Gold tumbles below $4,200 on higher oil prices, firmer US Dollar | TMGM
- [T4] Geopolitics alone isn’t enough to lift gold | ING THINK
- [T5] Gold’s Dual Drivers: Central Bank Flows and Real Yields, According to Societe Generale | CryptoRank.io
- [T6] Central Bank Gold Purchases Hit 1,000t Average: WGC Survey | Mexico Business News
- [T7] Gold’s slowdown doesn’t signal a reversal | Lombard Odier
- [T8] Central Bank Gold Reserves Survey 2026 | World Gold Council
Disclaimer
This report is AI-generated, is provided for informational purposes only, and does not constitute investment advice. Figures should be independently verified before any investment decision. Past performance is not indicative of future results.
Important Note / Wichtiger Hinweis:
EN: This report may have been generated using AI. It processes data from publicly available sources. The content is provided for informational purposes only.DE: Dieser Bericht kann mithilfe von KI erstellt worden sein. Dabei werden Daten aus öffentlich zugänglichen Quellen verarbeitet. Die Inhalte dienen ausschließlich Informationszwecken.
* DE: Die ergänzenden Inhalte können KI-generiert sein. EN: The additional content may be AI-generated.