
The altii-BTC-Report: Bitcoin (BTC) in EUR
As of 2 November 2026 | Institutional Market Strategy | Quote currency: EUR
Watch the video
This player shows only the Bitcoin chapter of the daily altii market briefing. Watch the full video on tube.altii.de.
Key Data Snapshot
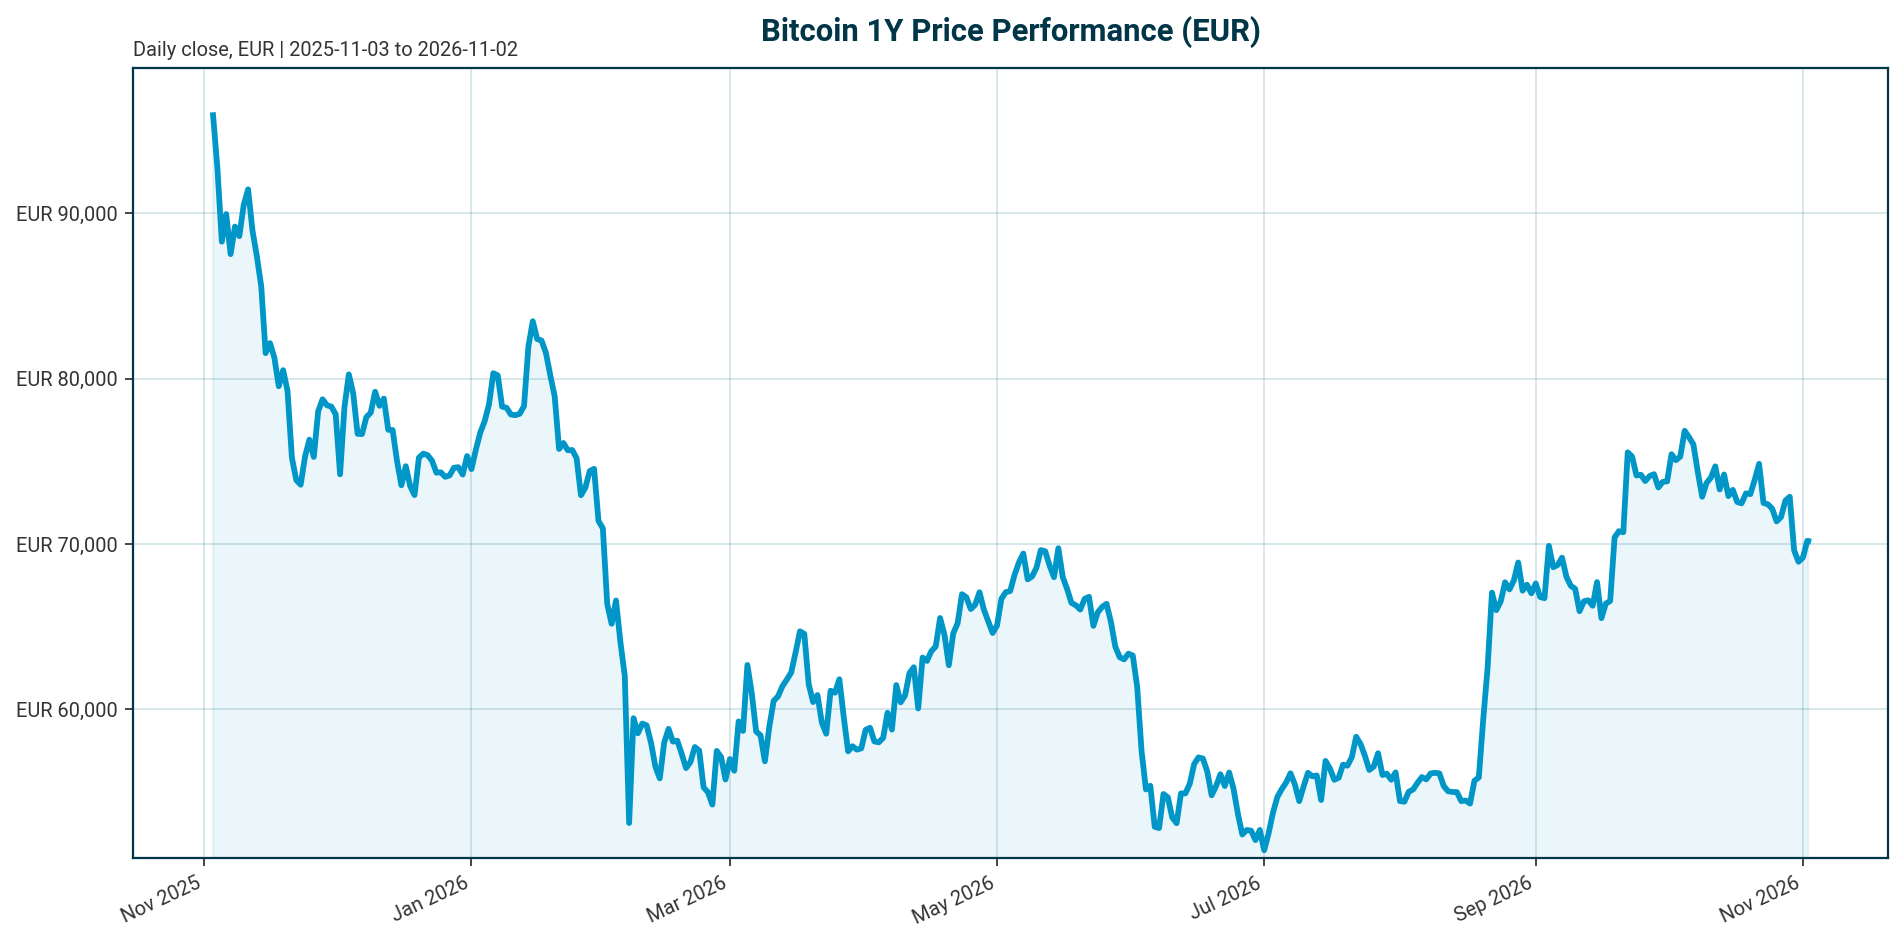
| Metric | Value | Notes |
|---|---|---|
| Price | EUR 70,071 | 24h range EUR 69,414 to 70,413; +0.93% 24h |
| Market cap | EUR 1.4089trn | Rank 1; FDV identical at EUR 1.4089trn |
| 24h volume | EUR 69.87bn | ~72.4% of total crypto volume (69.87/96.45bn) |
| Performance | 7d -1.40% | 14d -4.91% | 30d -7.42% | 200d +4.69%; 1y -28.73% |
| All-time high | EUR 107,662 (6 Oct 2025) | -34.92% from ATH; +53.66% upside to ATH |
| BTC dominance | 60.05% | Of EUR 2.342trn total crypto market cap |
| Supply | 20,105,365 of 21,000,000 BTC | 95.74% mined; 894,635 BTC remaining |
Calculation check: drawdown from ATH = (70,071 – 107,662) / 107,662 = -34.92%, matching the reported figure. The dominance computed from bundle snapshots is 60.15% (1.4089trn / 2.3421trn); the reported 60.05% is used, with the small gap attributable to snapshot timing.
Market Setup
The macro backdrop is neutral to negative for risk. Equity momentum is moderately negative, with the Nasdaq Composite the weakest 5-day performer at -2.80% and the S&P 500 down 1.26% over 5 days, while DACH indices outperform: the ATX gained 2.39% over 5 days and the DAX leads on a 1-month basis at +2.46%. DACH indicators average +2.00% over 5 days versus -0.58% for global equity indicators, a pattern consistent with regional rotation rather than broad risk-on. Euro area yields are mixed: the AAA 10Y yield stands at 3.37% (nearly flat, +0.4bp over 5 days), the 2Y at 3.01% after a -20.3bp move over the past month, and the 10Y-2Y spread sits at 36.5bp. FX is mixed, with EUR/USD at 1.1176 (+0.12% over 5 days, -4.89% YTD), EUR/CHF at 0.9214, EUR/JPY at 176.18, and EUR/GBP at 0.8356.
Policy is restrictive for risk assets. The US Federal Funds Target Range is 3.75% to 4.00% as of 1 November 2026, following a 25bp hike effective 17 September 2026. The ECB Deposit Facility Rate is 2.50% as of 31 October 2026, following a 25bp hike effective 16 September 2026. Euro area AAA 2Y yields are up roughly 90bp YTD, quantifying the 2026 euro-rate tightening that frames BTC’s EUR-quoted drawdown.
Within crypto specifically, ETF flows have become Bitcoin’s de facto macro indicator [T3]. US spot Bitcoin ETFs moved from approximately $4.7bn of net outflows in Q2 2026 to $6.36bn of net inflows in Q3 2026, per AMINA Bank research [T4]. The flow channel now transmits rates and cross-asset allocation decisions directly into BTC pricing, which is the central lens for this report.
Investment Thesis
Bitcoin enters late 2026 as a flow-driven macro asset, not a narrative-driven one. Fair value is set by the tension between expanding institutional distribution channels and the macro forces governing risk appetite and real rates [T6]. With ETFs now the dominant institutional trading channel, and 6.7 million BTC held across ETFs, exchanges, and treasuries at end-2025 according to Glassnode [T3], the marginal price of BTC is determined by weekly ETF flow prints against a restrictive policy backdrop of a Fed funds target of 3.75% to 4.00% and an ECB deposit rate of 2.50%.
The current picture is a drawdown phase: BTC trades at EUR 70,071, 34.9% below its October 2025 ATH and 28.7% lower year-on-year, with negative 7-day, 14-day, and 30-day momentum. The regulatory milestone of the SEC’s March 2026 classification of Bitcoin as a digital commodity has been partially offset by stalled market-structure legislation and uncertain banking and custody rules [T1]. Volatility has structurally compressed, from historical levels of 60% to 80% toward roughly 30% [T1], and from 84% to 43% per the Glassnode x Fasanara 2025 report [T3]. This compression makes moves steadier but deepens BTC’s dependence on macro flows rather than reducing risk.
Base scenario: BTC remains range-bound and flow-dependent while rates stay restrictive, with price tracking weekly ETF flows. Bull scenario: regulatory risk-premium compression and broadened distribution through wirehouses and retirement channels overwhelm modest supply growth [T6]. Bear scenario: tight liquidity turns ETFs into forced sellers, repeating the Q4 2025 pattern in which record outflows coincided with breaks of support near $98,000 [T3].
Bullish Drivers
The structural demand pipeline is the strongest element of the bull case. The $22trn US 401(k) and Defined Contribution system represents the largest potential extension of ETF-anchored demand; even a 1% allocation would generate $90-130bn of steady, rules-based inflows, on par with the entire current spot BTC ETF market, per 21Shares research [T6]. Separately, institutions managing more than $140trn in assets could eventually allocate a small single-digit percentage to digital assets [T1].
On the supply side, net new issuance of roughly 160,000 BTC per year is small against ETF holdings of more than 1 million BTC equivalent, so holder reallocation matters more than mining [T6]. Whale wallets holding 1,000 BTC or more accumulated into the November fear, suggesting a provisional floor [T6]. Supply growth is fixed by code at under 1% annually [T1].
On cyclical evidence: US spot Bitcoin ETFs recorded $6.36bn of net inflows in Q3 2026 after Q2 outflows of roughly $4.7bn [T4]. A weekly inflow streak of $2.4bn, the highest since October, pushed cumulative 2026 flows back into positive territory, according to an undated Elevano Capital post [T2]. Seven straight weeks of ETF inflows were confirmed as of May 2026 [T5]. Some market participants expect agency-level rulemaking to substitute for Congressional action and compress the regulatory risk premium through Q4 2026; this is a hedge-fund view from an undated source, not a settled outcome [T2].
Counterweight: a single late-October 2026 session saw roughly $635m of net ETF outflows, demonstrating how quickly the institutional bid can reverse [T1]. The bullish drivers are structural and real, but they do not immunize BTC against the current restrictive rates regime.
Relative Positioning vs Gold and Ethereum
Data gap disclosure: this dataset contains no current gold or ethereum price, flow, or performance data despite both being designated benchmark assets. The comparison below is therefore qualitative and based on the cited research; no gold or ETH levels, returns, or ETF flow figures can be stated from this bundle.
BTC vs Ethereum within crypto: BTC dominates at 60.05% of a EUR 2.342trn total crypto market cap and ranks first. Record Q4 2025 outflows hit US-listed BTC and ETH ETFs simultaneously [T3], indicating shared macro sensitivity rather than a persistent BTC-specific rotation. The expansion of altcoin ETFs beyond Bitcoin and Ethereum, including Solana and XRP products in the regulatory pipeline, could dilute the two-asset concentration of institutional crypto flows [T7]. If altcoin ETFs absorb marginal flows, BTC dominance above 60% could erode even in a rising total market.
BTC vs gold: the institutional supply era and volatility compression toward 43% [T3] move BTC toward a store-of-value comparison with gold. However, BTC’s -28.7% one-year drawdown sits uneasily with gold’s traditional defensive role. In a tight-liquidity regime, BTC behaves as a high-beta macro asset rather than digital gold; in an easing regime, the store-of-value narrative re-competes with gold [T3, T6]. Current policy settings, with the Fed at 3.75% to 4.00% and the ECB at 2.50% after September 2026 hikes, favor the former interpretation for now.
Scenario Framework
All scenarios below are assumptions, not forecasts. No future central-bank decisions are stated in this dataset; any discussion of future Fed or ECB moves is a market expectation or scenario assumption only.
Bull scenario: renewed weekly ETF inflow streaks combine with regulatory risk-premium compression via the agency-rulemaking path [T2] to drive a re-rating toward the ATH region of EUR 107,662, implying roughly +53.7% from spot. Trigger: sustained positive weekly US spot ETF flow prints plus macro relief on rates. Contingent on the institutional bid broadening rather than remaining episodic.
Base scenario: flow chop continues. Alternating inflow and outflow weeks keep BTC oscillating below the ATH in a macro-governed range. Whale accumulation provides a provisional floor [T6], while the Q3 2026 inflow record of $6.36bn [T4] and the late-October single-session outflow of roughly $635m [T1] bracket the flow volatility. Trigger: no change in the restrictive policy stance and no legislative breakthrough.
Bear scenario: tight liquidity turns ETFs into forced sellers [T6]. Stalled market-structure legislation and banking and custody uncertainty delay institutional adoption [T1]. A repeat of Q4 2025-style record outflows breaks the whale floor, as occurred when BTC broke support near $98,000 in USD terms [T3]. Trigger: further policy tightening (assumption, not a stated decision) or a legislative failure.
Positioning amplifier: compressed positioning amplifies moves in both directions. More than $1.6bn of shorts were liquidated within 24 hours on 1 August 2026 [T4], and with volatility compressed toward roughly 30% to 43% [T1, T3], flow shocks transmit faster through a less volatile but more macro-correlated market.
Valuation Discussion
BTC’s market cap of EUR 1.4089trn equals its fully diluted valuation because circulating supply equals total supply at 20,105,365 BTC. There is no unlock overhang. With 95.74% of the 21 million maximum supply mined and net new issuance of roughly 160,000 BTC per year, under 1% annual growth [T1, T6], scarcity is fully embedded in the float structure. Valuation must therefore come from the demand side.
The most defensible framework is flow-based rather than intrinsic: fair value is determined by the dynamic tension between expanding distribution into wealth and retirement platforms and the macro forces governing risk appetite and real rates [T6]. Demand-side capacity anchors are substantial: $90-130bn of potential annual rules-based inflows from a 1% allocation of the $22trn US 401(k)/DC system, as stated by the source [T6], against a >$140trn institutional AUM pool [T1]. If inflows broaden, the structural bid can overwhelm modest supply growth. If liquidity tightens, the same ETF wrapper becomes a forced-seller channel and valuation support shifts to whale accumulation floors and cost-basis zones, which are not available in this dataset and would require on-chain data.
Reference points: the ATH of EUR 107,662 implies +53.66% upside from EUR 70,071; the one-year return of -28.73% frames the current drawdown. The volatility regime shift, from historical 60% to 84% toward roughly 30% to 43% [T1, T3], changes position-sizing math for allocators: lower realized volatility supports larger allocations at equal risk budgets, but also increases correlation with macro-sensitive assets precisely when diversification is most needed. No on-chain valuation metrics such as realized price, MVRV, or exchange balances are available in this dataset.
Risks
Rates risk (primary): the Fed funds target range of 3.75% to 4.00% and the ECB deposit rate of 2.50%, both raised by 25bp effective mid-September 2026, keep the policy backdrop restrictive. Euro area 2Y yields are up roughly 90bp YTD. The transmission channel is well documented: shifts in US monetary policy expectations and spikes in ETF redemptions have historically shown up almost immediately in crypto prices, per a 2025 year-end market review [T3]. A further tightening cycle would be the single largest macro headwind to the ETF bid; this is a scenario assumption, not a stated decision.
Flow-reversal risk: the roughly $635m single-session ETF outflow in late October 2026 shows demand can reverse quickly [T1]. The ETF wrapper that brought institutional capital in also enables fast de-risking when yields or portfolio preferences change [T4].
Regulatory risk: market-structure legislation is stalled and banking and custody rules remain uncertain despite the SEC’s March 2026 digital-commodity classification [T1]. Legislative failure or adverse rules would re-widen the regulatory risk premium and delay the 401(k)/DC channel indefinitely [T1, T7].
Market-structure risk: Q3 2026 futures turnover of $13.0trn dwarfs spot volume of $2.49trn, which fell 14% quarter-on-quarter [T4]. Leverage-driven squeezes, such as the >$1.6bn short liquidation on 1 August 2026 [T4], can detach price from spot demand.
Concentration risk: 6.7 million BTC sits across ETFs, exchanges, and treasuries [T3]. Whale wallets are both a floor and a future overhang if macro deteriorates [T6].
Volatility-regime risk: compressed volatility of roughly 30% to 43% [T1, T3] increases macro-flow dependence. Moves may be steadier but more correlated to risk assets, reducing BTC’s diversification value in portfolios.
Appendix
Data provenance: bundle generated 2026-11-02T05:15:25Z; market data retrieved 2026-11-02T05:15:07Z; news retrieved 2026-11-02T05:15:13Z. Policy rates as-of dates: Fed 2026-11-01, ECB 2026-10-31. Euro yield curve as-of 2026-10-29. Equity indices as-of 2026-10-30 or 2026-11-02 depending on the index.
Methodology notes: all BTC figures are EUR-quoted. USD-denominated flow figures from sources are quoted as reported and not converted; EUR/USD at 1.1176 (-4.89% YTD) means USD-quoted levels from sources are not directly comparable to EUR-quoted bundle data. The reported BTC dominance of 60.05% is used; a bundle-derived calculation yields 60.15% due to snapshot timing. The 401(k) inflow range of $90-130bn is a source-stated figure [T6], not an own calculation.
Data gaps: no gold or ethereum price or flow data in the bundle despite both being benchmark assets. No on-chain data (realized price, cost basis, MVRV, exchange balances). No dated Fed or ECB forward guidance in the dataset. Most Tavily sources lack publication dates; only T5 is dated (May 2026). T2 is an undated LinkedIn post from a systematic hedge fund and its narrative on Fed hike expectations should be read alongside the authoritative policy-rates block, which shows a Fed hike of 25bp effective 17 September 2026, leaving the target range at 3.75% to 4.00%.
Scenario labeling: all forward-looking statements in this report are labeled as scenarios or market expectations. No future central-bank decisions are asserted.
Sources
- [T1] MAXI ETF: Bitcoin Exposure with an Income Overlay in a Challenging Macro Backdrop (Tickeron, undated in feed)
- [T2] Bitcoin ETFs Absorb $134.4M as Macro Backdrop Improves (Elevano Capital via LinkedIn, undated)
- [T3] Crypto Market 2025: Year-End Review & Expert Insights (TradingView News, undated in feed)
- [T4] Crypto After the Midterms: Regulation, Liquidity and the Institutional Era (AMINA Bank, undated in feed)
- [T5] Bitcoin (BTC) ETFs See 7 Weeks of Inflows: Is the Institutional Bid Back? (24/7 Wall St., May 2026)
- [T6] Bitcoin 2026 outlook: ETF gravity vs. Macro ceiling (21Shares, undated in feed)
- [T7] Crypto ETFs Enter a New Phase in September (Bitcoin Foundation, undated in feed)
- [T8] Bitcoin ETF Inflows: How Institutional Money Affects BTC Price (Blockchain Council, undated in feed)
This report is AI-generated and for informational purposes only. It does not constitute investment advice, a recommendation, or an offer to buy or sell any financial instrument. Figures are drawn from the cited data sources as of the stated timestamps and may be incomplete or subject to revision. Readers should conduct their own due diligence and consult a licensed financial advisor before making investment decisions.
Important Note / Wichtiger Hinweis:
EN: This report may have been generated using AI. It processes data from publicly available sources. The content is provided for informational purposes only.DE: Dieser Bericht kann mithilfe von KI erstellt worden sein. Dabei werden Daten aus öffentlich zugänglichen Quellen verarbeitet. Die Inhalte dienen ausschließlich Informationszwecken.
* DE: Die ergänzenden Inhalte können KI-generiert sein. EN: The additional content may be AI-generated.