
Watch the video
This player shows only the Gold chapter of the daily altii market briefing. Watch the full video on tube.altii.de.
Key Data Snapshot
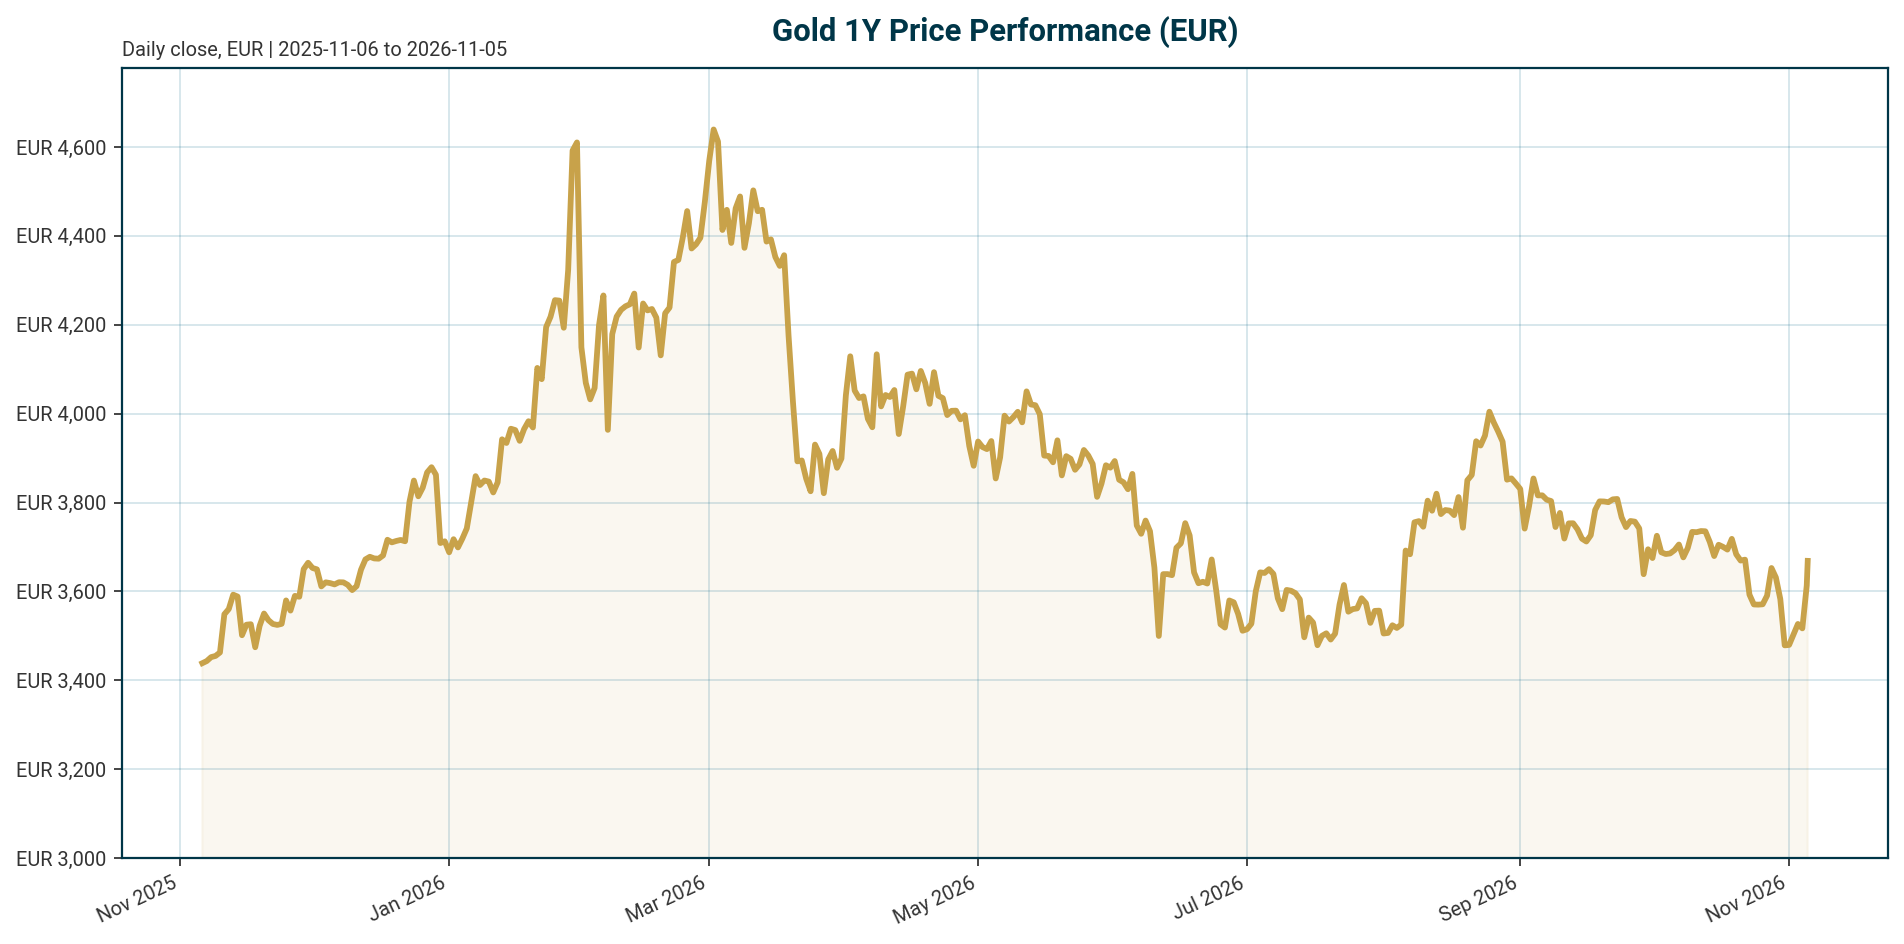
Gold (XAU), quoted in EUR, trades at EUR 3,660.81 as of 5 November 2026. The metal is up 3.86% over 24 hours and 2.31% over seven days, but remains in a corrective phase: down 13.61% over 200 days and 21.92% below its all-time high of EUR 4,688.32 set on 28 January 2026. The 1-year return stands at +4.40%.
| Metric | Value |
|---|---|
| Price (XAU/EUR) | EUR 3,660.81 |
| 24h change / range | +3.86% / EUR 3,549.50 to EUR 3,670.15 |
| 7d / 14d / 30d change | +2.31% / +0.80% / -0.18% |
| 200d / 1y change | -13.61% / +4.40% |
| All-time high | EUR 4,688.32 (28 Jan 2026), currently -21.92% |
| All-time low | EUR 1,265.28 (17 Nov 2019), currently +189.33% |
| Market cap / 24h volume (PAXG proxy) | EUR 1.64bn / EUR 132.3m |
| Fed funds target range | 3.75% to 4.00% (last change: 25 bp hike, effective 2026-09-17) |
| ECB deposit facility rate | 2.50% (last change: 25 bp hike, effective 2026-09-16) |
| Euro area AAA 10Y yield | 3.35% (-4.6 bp over 5 days, as of 2026-11-03) |
| Euro area AAA 10Y-2Y spread | 36.0 bp |
| EUR/USD | 1.1229 (+0.43% over 5 days, -4.43% YTD) |
Calculation: reclaiming the January 2026 peak requires a move of (4,688.32 / 3,660.81 – 1) = +28.07% from current levels.
Macro Backdrop
Market overview: Risk sentiment is neutral while global equity momentum is moderately negative. DACH indicators average +1.10% over five days versus -0.40% for global equity peers, with the DAX up 1.53% over five days and leading on a one-month basis at +4.69%. Divergence is stark across Asia: the Hang Seng is the strongest five-day performer at +5.91% while the Nikkei 225 is the weakest at -5.39%. The rates backdrop is mixed: the euro area AAA 10Y yield sits at 3.35% after a -4.6 bp five-day move, the 2Y at 2.99% (-7.3 bp), and the 30Y at 3.62% (+1.4 bp), with a 10Y-2Y spread of 36.0 bp. FX is likewise mixed: EUR/USD at 1.1229 (+0.43% over five days) and EUR/JPY posting the strongest five-day FX move at +0.87%. These conditions are context; the gold analysis below is the focus.
Policy is restrictive on both sides of the Atlantic. The Federal Reserve’s target range stands at 3.75% to 4.00%, with the last change a 25 bp hike effective 2026-09-17. The ECB’s deposit facility rate is 2.50%, following a 25 bp hike effective 2026-09-16. For a non-yielding asset, this keeps the nominal opportunity cost of holding gold elevated. The gap between the Fed’s 3.75% to 4.00% target range and the ECB’s 2.50% deposit rate is a carry consideration for the EUR-quote channel, as it shapes dollar funding costs relative to euro funding costs.
Historically, gold trades inversely to real yields, which represent the opportunity cost of holding it. That relationship broke down after 2022: real yields rose to post-2008 highs while gold was little changed in 2022 and posted a +13% return in 2023, ending at a then-record $2,068 per ounce [T1]. UBS notes that gold has recently been under pressure mainly because real yields have risen rapidly, while still expecting higher medium-term prices [T7]. No euro-area inflation expectation or US TIPS-based real yield is in the dataset, so real-yield analysis here rests on nominal levels and must be read as indicative.
Investment Thesis
The core thesis is that gold is a structurally supported diversifier with a cyclical headwind. The structural leg is central bank demand: monetary authorities have accumulated an average of 1,000 tonnes per year over the past four years, double the 500-tonne average of the preceding decade [T4]. In the World Gold Council’s 2026 survey, 89% of respondents expect global central bank gold reserves to rise over the next 12 months, and a record 45% expect their own reserves to increase [T4]. China has extended its buying streak to 19 consecutive months despite price weakness, according to a report on the latest reserve data [T8].
The motivations are durable: crisis performance, portfolio diversification, inflation hedging, de-dollarization, and sanctions immunity. Central banks hold an estimated 20% of above-ground gold as official reserves, and their market influence may now exceed that share [T3]. Countries near geopolitical flashpoints and non-aligned states seeking to reduce dollar reserve vulnerability are key incremental buyers [T1].
The cyclical leg is the rate environment. With the Fed at 3.75% to 4.00% and the ECB at 2.50% after September 2026 hikes, and euro AAA 10Y yields at 3.35%, the carry against gold is high. UBS attributes recent price pressure to rapidly rising real yields [T7]. The tension between restrictive current policy and market consensus expecting roughly 75 bp of additional Fed cuts [T6] is the central swing factor for the next two quarters. Note that the WGC outlook likely predates the September 2026 hikes; we treat its easing assumptions as market expectations, not policy commitments.
Bullish Drivers
- Central bank flows: 1,000t average annual accumulation over four years, twice the prior-decade pace [T4]. A record 45% of surveyed institutions plan to add to their own reserves [T4]; a J.P. Morgan Private Bank survey of 73 monetary authorities found a then-record 43% expecting their reserves to rise [T1].
- De-dollarization and sanctions immunity: China and Russia aim to reduce dollar dependence; gold held domestically is politically neutral and cannot be frozen, unlike currency reserves [T3].
- Geopolitical hedging: states near the Russia-Ukraine border are increasing reserves; gold’s role as a settlement and hedge asset is expanding as geopolitical risks stay elevated [T1] [T2].
- Fiscal and institutional concerns: worries over inflation, deteriorating US fiscal health, Federal Reserve independence, and geopolitical instability support reserve diversification into gold, according to Reuters commentary from September 2025 [T5].
- Easing optionality: the WGC’s slowdown scenario sees a softer US labor market prompting the Fed to cut beyond consensus, with lower rates, a weaker dollar, and heightened risk aversion lifting gold 5% to 15% in 2026 from then-current levels [T6]. This is a scenario, not a forecast, and it conflicts with the current 3.75% to 4.00% target range.
- Storage diversification: the Bank of England remains the most popular vaulting location at 57%, with domestic storage second at 49%, indicating reserve repatriation trends that reinforce physical demand [T4].
Relative Positioning vs Bitcoin and Ethereum
The bundle’s configured benchmarks are gold and ethereum. Specific BTC and ETH price or performance data are not in the dataset and are not fabricated here. What the data does show: BTC dominance stands at 59.54%, total crypto market capitalization at approximately EUR/USD 2.41 trillion, and total crypto 24h volume at roughly 80.0 billion. Gold’s tracked instrument, the PAXG token, shows a 24h volume of EUR 132.3m, a depth figure that reflects the token, not the physical gold market.
Positioning logic rests on regime behavior. Gold is a central-bank-grade, non-sovereign reserve asset with a structural demand floor from official flows [T2] [T3]. Crypto assets behave as high-beta risk assets. With global equity momentum moderately negative and the Nikkei down 5.39% over five days, a risk-off extension would likely favor gold over crypto on a drawdown basis. In a risk-on re-acceleration, crypto could recapture flows, but gold’s official-sector bid provides a demand cushion crypto lacks. For EUR-based allocators, gold’s +4.40% one-year return with a -13.61% 200-day drawdown suggests a maturing consolidation rather than the momentum profile crypto typically requires.
Scenario Framework
Three scenarios frame the 6-to-12-month outlook. All rate-path assumptions are market expectations or scenario inputs, not central bank decisions.
| Scenario | Key assumptions | Gold implication (EUR) |
|---|---|---|
| Baseline (consensus) | Global GDP growth of 2.7% to 2.8% real, roughly 75 bp of additional Fed cuts per market consensus, core CPI/PCE falling 40 to 60 bp by year-end, dollar edging higher, yields broadly flat [T6]. | Rangebound. An illustrative EUR 3,400 to 3,900 band is our assumption for discussion, not a sourced forecast. |
| Bullish (slowdown/easing) | US labor market softens; the Fed cuts beyond the consensus ~75 bp; dollar weakens; risk aversion rises [T6]. | Gold rises 5% to 15% in 2026 from then-current levels per the WGC scenario [T6]. Applied to today’s EUR 3,660.81 for illustration only: EUR 3,844 to 4,210. The band references then-current levels and cannot be applied mechanically. |
| Bearish (restrictive) | Both central banks extend their September 2026 hiking cycles from the current Fed 3.75% to 4.00% and ECB 2.50%; real yields rise rapidly as UBS describes [T7]. | Deeper drawdown below the current -21.92% gap to the EUR 4,688.32 ATH; the EUR 3,549.50 recent 24h low becomes the near-term reference. |
The EUR-quote channel cuts across all scenarios. EUR/USD at 1.1229 is down 4.43% YTD, meaning EUR strength has mechanically dampened EUR-quoted gold returns relative to USD terms. Comparing gold’s +4.40% one-year EUR return against the EUR/USD YTD move of -4.43% is indicative only, since the periods differ. Further EUR appreciation would compress EUR-denominated gold even if USD gold is flat.
Valuation Discussion
On the WGC’s Gold Valuation Framework, consensus macro inputs imply rangebound fair-value performance, meaning gold at consensus is neither a momentum trade nor deeply cheap [T6]. The 2025 rally was gold’s fourth strongest annual return since 1971 [T6], a stretch that the current -21.92% drawdown from the January 2026 ATH is partially digesting. The return profile, +4.40% over one year against -13.61% over 200 days, quantifies a momentum reversal of roughly 18 percentage points, consistent with mean reversion from the peak rather than a breakdown of the structural uptrend.
The opportunity-cost lens is unfavorable at current policy settings. Gold yields nothing; with the Fed funds target range at 3.75% to 4.00% and euro AAA 10Y yields at 3.35%, nominal carry against gold is high [T1] [T7]. The inflation-hedge property is real but often transitory in effectiveness [T1]. No euro-area inflation expectation figure is in the dataset, so a euro real-yield proxy cannot be computed here.
Balanced verdict: at EUR 3,660.81, gold sits near model fair value under consensus inputs. The undervaluation case rests on easing optionality: if the slowdown scenario materializes, the WGC’s +5% to +15% path implies current prices underprice that outcome [T6]. The overvaluation risk is that central bank buying decelerates from the ~1,000t pace while real yields stay elevated, widening the ATH gap.
Risks
- Policy risk: an additional 25 bp hike by either the Fed (from 3.75% to 4.00%) or the ECB (from 2.50%) would extend the real-yield headwind and likely deepen the drawdown. Consensus expects Fed cuts [T6]; if that expectation is wrong, positioning unwinds.
- Real-yield risk: rapidly rising real yields have recently pressured gold [T7], and rising yields reduce the appeal of non-yielding assets [T8].
- Flow risk: central bank purchases are one of four demand segments alongside jewelry, investors, and industrial use; their price influence depends on their share of total activity [T3]. A deceleration from the ~1,000t pace removes the structural floor. A break in China’s 19-month buying streak, which persisted despite three straight monthly losses into May [T8], would be a sentiment signal.
- Currency risk: EUR/USD at 1.1229 with a -4.43% YTD move; renewed EUR strength mechanically compresses EUR-quoted gold even if USD gold is flat.
- Data caveats: euro yields are as of 2026-11-03, two days stale relative to this report. The tracked instrument is a tokenized gold proxy; its market cap and volume do not represent the aggregate gold market.
Appendix
Policy rates (authoritative):
| Central bank | Rate | As of | Last change |
|---|---|---|---|
| Federal Reserve | 3.75% to 4.00% (target range) | 2026-11-04 | 25 bp hike, effective 2026-09-17 |
| European Central Bank | 2.50% (deposit facility) | 2026-11-05 | 25 bp hike, effective 2026-09-16 |
Methodology and data notes: Gold exposure is tracked via PAXG (tokenized gold, CoinGecko id pax-gold) as the EUR-quoted proxy. Its market cap of EUR 1.64bn reflects a tokenized supply of 447,712 units, not total above-ground gold. Market data retrieved 2026-11-05T05:21Z; euro area AAA yields as of 2026-11-03; equity and FX data as of 2026-11-04/05. Real yields are inflation-adjusted rates representing the opportunity cost of holding gold [T1]; no euro-area inflation expectation or US TIPS datapoint is in the dataset, so real-yield analysis is nominal-based and qualitative. Basis point (bp) conventions apply to yield and rate changes. Several sources lack publication dates in the feed; where dating is inferable it is stated inline (for example, T2 and T5 date from September 2025 per their URLs). The EUR 3,400 to 3,900 baseline band and the application of the WGC +5% to +15% band to today’s price are illustrative scenario math, not forecasts.
Sources:
- [T1] Is it a golden era for gold? | J.P. Morgan Private Bank U.S.
- [T2] Central banks are turning back to gold – OMFIF (2 September 2025)
- [T3] Why are central banks expanding their gold reserves? | APG
- [T4] Central Bank Gold Reserves Survey 2026 | World Gold Council
- [T5] COMMENTARY: Gold’s rise in central bank reserves appears unstoppable | Reuters (September 2025)
- [T6] Gold Outlook 2026: Push ahead or pull back | World Gold Council
- [T7] Gold: Between inflation fears and diversification of reserves | UBS
- [T8] China’s central bank extends gold-buying streak to 19 months | Yahoo Finance
Disclaimer: This report is AI-generated and for informational purposes only. It does not constitute investment advice, a recommendation, or an offer to buy or sell any financial instrument. Data may be incomplete, delayed, or inaccurate; readers should verify figures independently and consult a licensed financial advisor before making investment decisions.
Important Note / Wichtiger Hinweis:
EN: This report may have been generated using AI. It processes data from publicly available sources. The content is provided for informational purposes only.DE: Dieser Bericht kann mithilfe von KI erstellt worden sein. Dabei werden Daten aus öffentlich zugänglichen Quellen verarbeitet. Die Inhalte dienen ausschließlich Informationszwecken.
* DE: Die ergänzenden Inhalte können KI-generiert sein. EN: The additional content may be AI-generated.