
Watch the video
This player shows only the Gold chapter of the daily altii market briefing. Watch the full video on tube.altii.de.
Key Data Snapshot
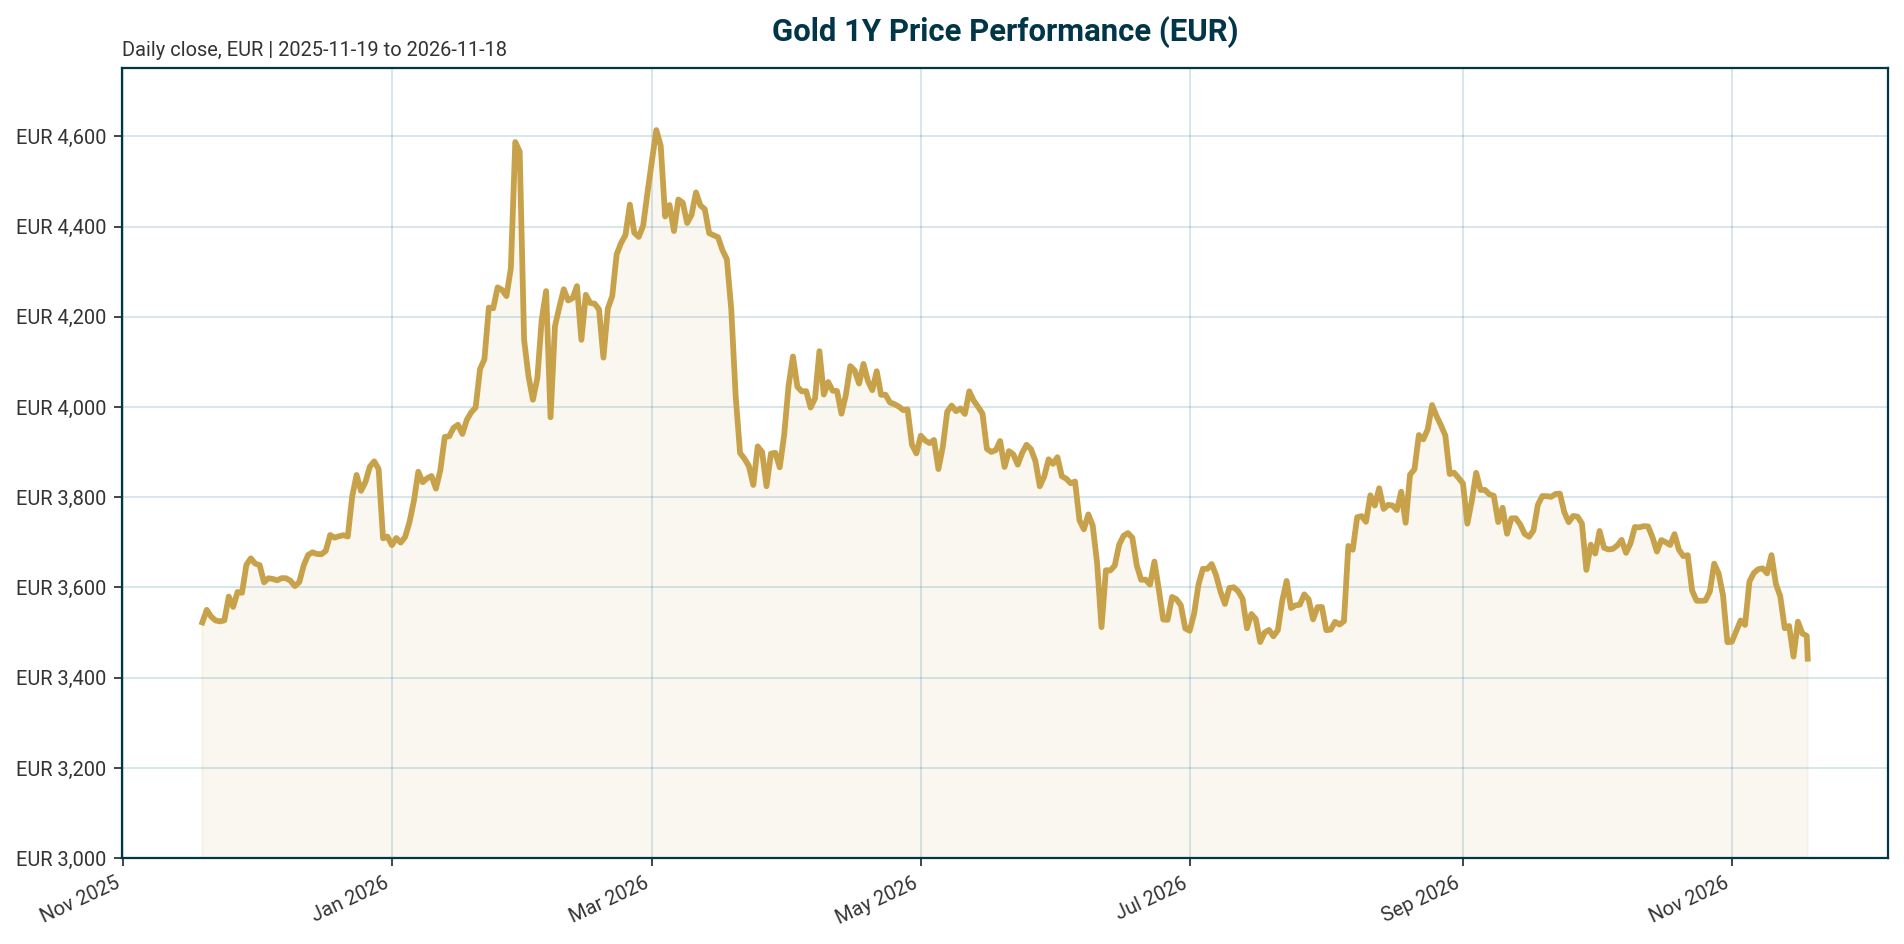
Gold (XAU) quoted in EUR trades at 3,440.59 as of 2026-11-18 (retrieved 05:19 UTC). The metal is in a firm corrective phase across all horizons and sits 26.61% below its all-time high.
| Metric | Value | Note |
|---|---|---|
| XAU/EUR price | 3,440.59 | 24h high 3,526.37 / low 3,434.85 |
| 24h change | -1.98% | 1h -0.09% |
| 7d / 14d change | -6.44% / -4.07% | Corrective momentum |
| 30d / 200d change | -9.47% / -17.96% | Established downtrend |
| 1y change | -5.58% | Modest annual decline |
| All-time high | 4,688.32 (2026-01-28) | Current price -26.61% below |
| All-time low | 1,265.28 (2019-11-17) | Current price +171.92% above |
| Fed funds target range | 3.75% to 4.00% | As of 2026-11-17; last change hike of 25 bp, effective 2026-09-17 |
| ECB deposit facility rate | 2.50% | As of 2026-11-18; last change hike of 25 bp, effective 2026-09-16 |
| Euro area AAA 10Y yield | 3.42% | +9.2 bp over 5d, as of 2026-11-16 |
| Euro AAA 10Y-2Y spread | 31.3 bp | 2Y at 3.11%, up 100.1 bp YTD |
| EUR/USD | 1.1005 | -0.61% over 5d, -6.34% YTD |
| Market cap / 24h volume | 1.54 bn EUR / 94.2 m EUR | PAX Gold token proxy, not physical market liquidity |
Drawdown check: (3,440.59 – 4,688.32) / 4,688.32 = -26.61%, matching the reported ATH change. The 24h high-to-low range of 91.52 EUR (3,526.37 to 3,434.85) is roughly 2.6% of spot, indicating elevated intraday volatility.
Macro Backdrop
The market overview shows negative risk sentiment and moderately negative equity momentum. The DAX is down 2.32% over five days (strongest 5-day move among tracked indices), the Nasdaq Composite is the weakest at -4.47%, and the S&P 500 is down 3.66% over five days and 4.16% over a month. DACH indicators average -2.77% over five days versus -3.57% for global equity indicators, so the region is broadly in line with the global risk-off tone. Rates are the dominant channel for gold: euro area AAA yields are mixed but rising at the front end, with the 10Y at 3.42% (+9.2 bp over 5d) and the 2Y up 100.1 bp year to date. FX is mixed, with EUR/USD at 1.1005, down 0.61% over five days and 6.34% year to date, which cushions EUR-quoted gold relative to USD gold.
Policy is the key story. The Fed funds target range stands at 3.75% to 4.00% after a 25 bp hike effective 2026-09-17, and the ECB deposit facility rate stands at 2.50% after a 25 bp hike effective 2026-09-16. Both central banks tightened in the same month, restoring the opportunity cost of holding a non-yielding asset. For gold, this is a headwind; for a EUR-based investor, euro weakness has partially offset the USD-price decline. If risk-off equity momentum persists, safe-haven flows may partially offset the rates drag, though the recent price action suggests the rates channel is currently winning. If euro yields keep rising faster than USD yields, the EUR-quoted drag could intensify independently of USD gold dynamics.
Investment Thesis
Gold is caught between two powerful forces. On one side, the real-yield channel has reasserted control. According to [T1] (undated commentary), the gold-real-yield correlation broke down in 2022 to 2025 because of heavy central bank reserve buying, but in 2026, once the Fed returned to raising rates from September 2026 and real yields climbed, the opportunity-cost mechanism took hold of the price again. The same source describes the USD gold price falling roughly 31%, from about 5,595 USD/oz on 29 January 2026 to about 3,870 USD/oz on 30 October 2026, despite elevated inflation and Middle East supply disruptions. The EUR-quoted drawdown of 26.61% from the January high is consistent with that picture, softened by euro weakness.
On the other side, structural official-sector demand remains intact and accelerating. The World Gold Council reported, in a report published on November 3, that central banks bought a net 321 tonnes in Q3, the fastest pace since late 2024 and up 46% year on year [T7]. Goldman Sachs estimated, in a note cited by Fortune on October 22, 2026, that central banks purchased 79 tonnes in August, more than four times the pre-2022 monthly average of 17 tonnes, with a three-month seasonally adjusted run-rate of 85 tonnes per month and China the largest identifiable buyer at roughly 25 tonnes in August [T6]. At 85 tonnes per month, the annualized run-rate is about 1,020 tonnes, consistent with the more than 1,000 tonnes per year average since 2022 cited in [T4] (undated commentary).
The base case is a rangebound consolidation: restrictive policy holds real yields elevated and caps the price, while central bank buying provides a floor. The bull case requires a policy pivot that flips the real-yield channel to a tailwind. The bear case is a further tightening cycle that extends the drawdown despite reserve demand.
Bullish Drivers
- Record official-sector demand. Q3 net purchases of 321 tonnes, up 46% year on year and the fastest pace since late 2024, per the WGC report published November 3 [T7]. Implied prior-year Q3 purchases were roughly 220 tonnes (321 / 1.46), so the acceleration is genuine, not a rounding effect.
- A durable run-rate. Goldman’s August estimate of 79 tonnes and the 85 tonnes per month seasonally adjusted pace [T6] annualize to roughly 1,020 tonnes, a price-insensitive demand pillar that did not exist in past cycles at this scale.
- Reserve security and de-dollarization motivations. Goldman argues China remains underweight in gold relative to plausible long-term allocations and that motivations for diversifying away from G7 reserve currencies are likely to remain in place [T6]. In Goldman’s August survey, 12% of central banks declined to confirm where their gold is stored (up from 10% in 2025), 10% diversified overseas storage in 2026 (versus 2% the prior year), and 9% plan further diversification over the next 12 months [T6].
- Forward intent. According to [T4] (undated commentary), 45% of central banks surveyed expect to increase gold reserves over the next 12 months.
- Safe-haven bid. Negative risk sentiment, with the Nasdaq down 4.47% over five days and the Nikkei down 9.13% over a month, supports defensive allocation demand [T2].
If reserve-security concerns escalate, for example through further sanctions-driven reserve freezes, buying could accelerate above the current 85 tonnes per month run-rate. If China’s underweight allocation normalizes toward long-term targets, identifiable official demand could rise structurally. Both are scenario assumptions, not forecasts.
Relative Positioning vs Bitcoin and Ethereum
Gold in EUR is down 26.61% from its January 2026 high and 17.96% over 200 days. Direct crypto benchmark data is limited in this dataset: Ethereum is a configured benchmark asset, but no ETH price or performance data is present, so the comparison below is qualitative. For context, total crypto market capitalization stands at roughly 2.02 trillion USD with Bitcoin dominance at 58.43%.
The positioning logic favors gold in the current regime. Risk sentiment is negative, equities are falling broadly, and policy is restrictive after the September 2026 hikes by both the Fed (to 3.75% to 4.00%) and the ECB (to 2.50%). In that environment, duration-heavy, high-beta digital assets typically compress more than a non-yielding monetary metal with a price-insensitive official-sector buyer underneath it. Gold’s demand base includes 321 tonnes of Q3 central bank purchases [T7], a pillar crypto lacks. Conversely, if policy pivots dovish, crypto’s higher beta could reverse the relative-performance ranking quickly. Investors should treat gold’s current outperformance as regime-dependent rather than structural.
Scenario Framework
All forward rate paths below are scenario assumptions or dated commentary views, not decisions. No market-implied pricing is available in the dataset.
| Scenario | Policy path (assumption) | Real yields / FX | XAU/EUR implication |
|---|---|---|---|
| Dovish pivot | Inflation cools; Fed and ECB move to holds then cuts | Real yields fall; EUR/USD direction uncertain | Real-yield channel flips positive; gold re-tests the 4,688.32 ATH region |
| Hold and see (base case) | Policy pauses at Fed 3.75% to 4.00% and ECB 2.50% | Real yields plateau; euro yields stabilize near 3.42% (10Y) | Rangebound consolidation; central bank buying at ~85 t/month [T6] acts as the floor |
| Extended tightening | Inflation stays above ~4% and further hikes follow, per the path sketched in [T4] (undated commentary) | Real yields rise again; opportunity cost deepens | Drawdown extends, potentially toward the ~3,870 USD/oz low of 30 October 2026 in USD terms [T1] |
For scale, converting the USD correction range from [T1] at today’s EUR/USD of 1.1005 gives an approximation of roughly 5,084 EUR/oz at the January high and 3,516 EUR/oz at the October low, clearly an approximation at current FX. The current EUR price of 3,440.59 sits slightly below even that translated October low, which suggests either that the EUR quote has overshot the USD correction or that the proxy series and spot USD gold diverge; both possibilities warrant verification before acting on the level.
Valuation Discussion
Gold has no cash flows, so valuation rests on relative frameworks. Three lenses apply.
Drawdown position. At 3,440.59, gold is 26.61% below its ATH and 171.92% above its 2019 low. The 30-day change of -9.47% and 200-day change of -17.96% show an established downtrend, not a one-off shock. Historically, drawdowns of this size in gold have been buy zones for long-horizon allocators, but only when the macro regime turns.
Real-yield fair value. With the Fed at 3.75% to 4.00% and the ECB at 2.50%, and inflation referenced around 4% in [T4] (undated commentary), real risk-free yields are near zero to positive. That is a materially higher opportunity cost than in the 2022 to 2025 regime when the correlation broke down [T1]. Note the data limitation: the dataset contains no current US CPI print, no US 10Y Treasury yield, and no euro-area HICP figure, so the real-yield calculation is illustrative only. On a pure real-yield basis, gold looks fully valued to expensive.
Official-sector flow premium. Central bank purchases at roughly 85 tonnes per month [T6] and 321 tonnes in Q3 [T7] are price-insensitive flows that justify a persistent premium versus a pure real-yield model. On this lens, current levels look supported.
The valuation debate is about which force dominates at the margin. If the real-yield channel stays dominant, fair-value estimates should be marked toward the October 2026 lows. If reserve flows dominate, current levels are reasonable accumulation points. EUR/USD at 1.1005, down 6.34% YTD, means the EUR-quoted valuation is flattered by currency translation relative to USD gold; a euro recovery would mechanically reduce EUR-quoted value.
Risks
- Further tightening. Both central banks hiked as recently as September 2026. Per [T4] (undated commentary), the Fed may be forced to hike again if inflation stays above 4%. A hawkish surprise could trigger a repeat of the -9.47% 30-day move.
- Demand concentration. Official-sector buying is the main bullish pillar. A slowdown in Chinese or emerging-market purchases would remove the price floor. China was the largest identifiable buyer at roughly 25 tonnes in August [T6], so an abrupt halt would matter.
- Transparency risk. 12% of central banks declined to confirm their gold storage location in 2026, and unidentifiable buying makes true demand levels uncertain [T6]. The structural-demand thesis rests partly on estimates, not verified flows.
- FX risk. A EUR recovery from 1.1005 would depress EUR-quoted gold even if USD gold is stable. EUR/USD is down 6.34% YTD, so mean reversion is a live risk for EUR-based holders.
- Correlation-regime risk. The gold-real-yield relationship broke down from 2022 to 2025 [T1]. Any model built on it carries regime uncertainty in both directions.
- Data gaps. No current US CPI, no US Treasury or real-yield level, no euro-area HICP print, and no ETH benchmark price are present in the dataset. These are flagged rather than estimated.
- Proxy risk. The XAU series uses the PAX Gold token as proxy, which may deviate from spot XAU/EUR, and its market cap and volume figures reflect the tokenized product, not physical market liquidity.
Appendix
Methodology and data provenance. Market data retrieved 2026-11-18T05:19:42Z via the daily_report pipeline v1.0. XAU is quoted in EUR using the PAX Gold proxy (coingecko_id: pax-gold); basis risk versus spot XAU/EUR exists. Policy rates are sourced exclusively from the authoritative policy_rates block: Fed funds target range from FRED as of 2026-11-17, ECB deposit facility rate from the ECB key rate as of 2026-11-18. Euro yield curve data is from the ECB yield curve as of 2026-11-16; FX data is from Frankfurter as of 2026-11-18; equity data is from STOXX, Wiener Boerse, and FMP as of 2026-11-17/18.
Source dating. T6 is dated October 22, 2026 (Fortune). T7 references a WGC report published on November 3. T1, T2, T3, and T4 lack publication timestamps in the dataset; all figures from these sources are repeated only with their source context and should be treated as commentary views, not verified current data.
Limitations. No US CPI, no US Treasury nominal or real yields, no euro-area HICP, no ETH price data, and no market-implied policy expectations are available in the dataset. Real-yield calculations are therefore illustrative and labeled as such.
Sources
- [T1] GIAI MA NGHICH LY GIA VANG VA CACH THE HE NHA DAU TU TRE XAY DUNG TAI SAN (phfm.vn)
- [T2] What drives the price of gold? (Yahoo Finance)
- [T3] Will Investing in Gold Protect You From Inflation? History, Risks, and Alternatives (Questrade)
- [T4] Gold Is Sending a Major Warning About the Economy (YouTube)
- [T6] Goldman Sachs: Central banks increase gold demand and diversify storage for reserve security (Fortune, October 22, 2026)
- [T7] Central banks buy gold at fastest pace in two years, WGC (Central Banking)
Disclaimer. This report is AI-generated, for informational purposes only, and does not constitute investment advice. Figures should be independently verified before any investment decision. Past performance is not indicative of future results.
Important Note / Wichtiger Hinweis:
EN: This report may have been generated using AI. It processes data from publicly available sources. The content is provided for informational purposes only.DE: Dieser Bericht kann mithilfe von KI erstellt worden sein. Dabei werden Daten aus öffentlich zugänglichen Quellen verarbeitet. Die Inhalte dienen ausschließlich Informationszwecken.
* DE: Die ergänzenden Inhalte können KI-generiert sein. EN: The additional content may be AI-generated.