
Watch the video
This player shows only the Bitcoin chapter of the daily altii market briefing. Watch the full video on tube.altii.de.
Key Data Snapshot
| Metric | Value | Change / Note |
|---|---|---|
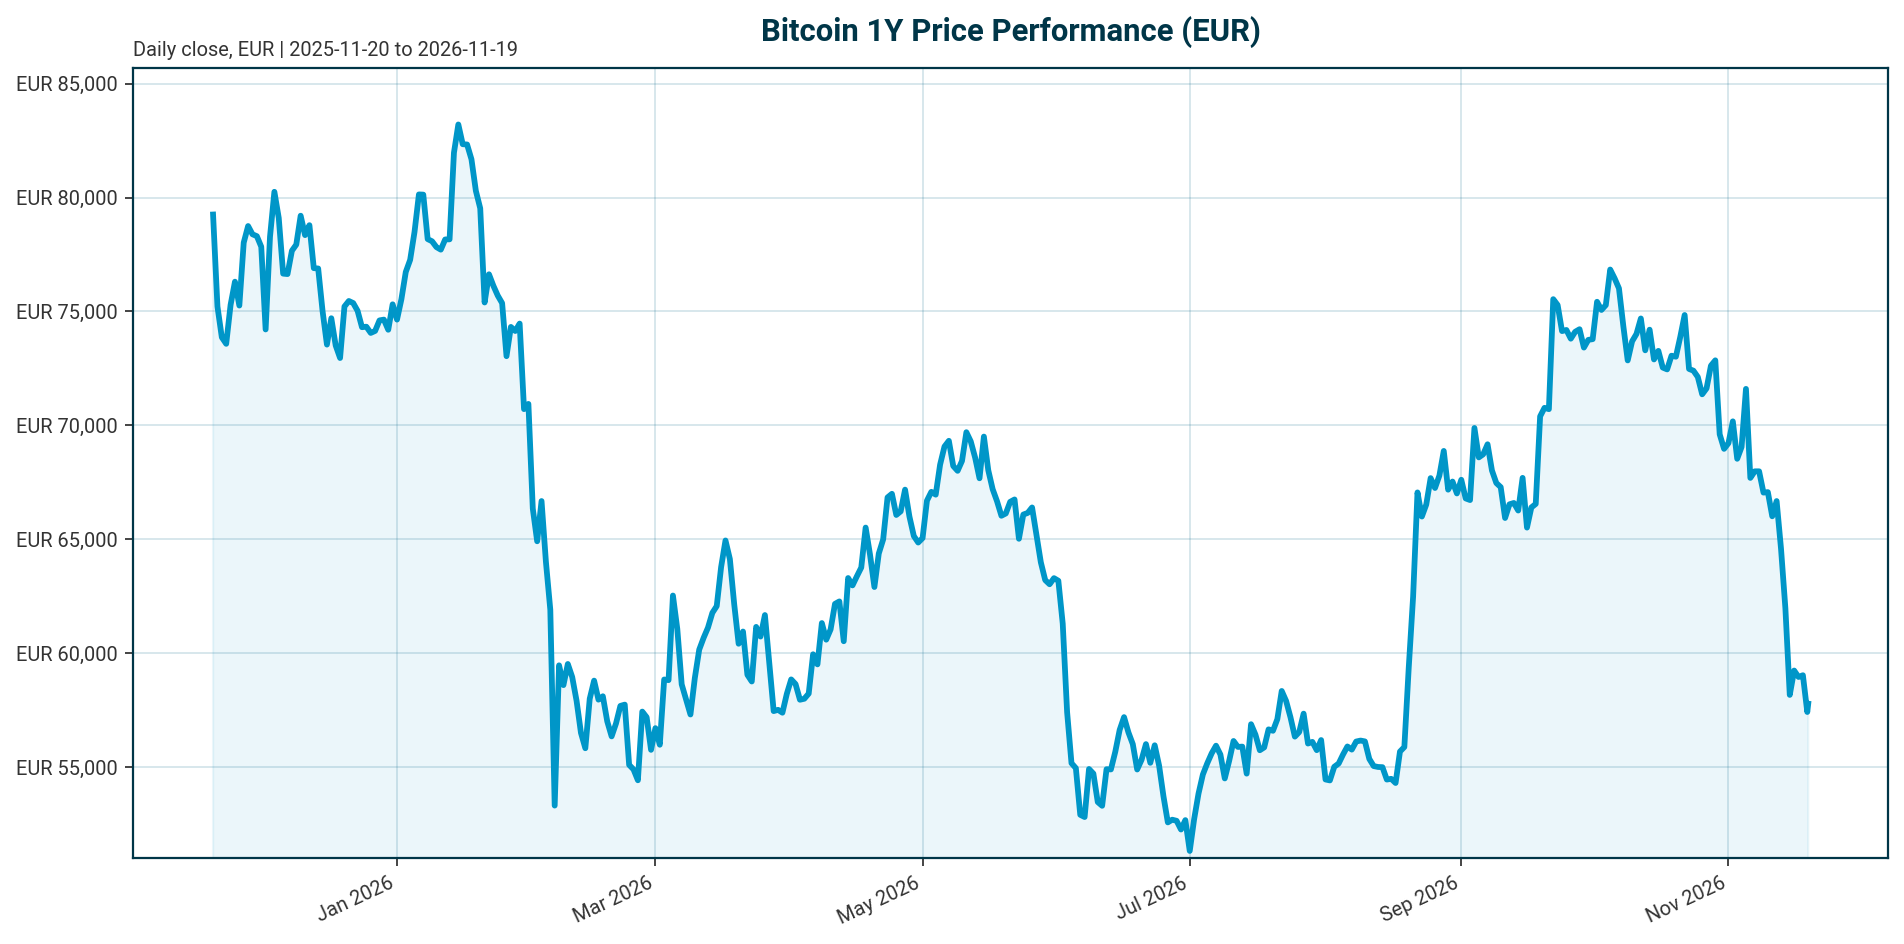
| BTC price (EUR) | EUR 57,863 | 24h range EUR 56,609 to EUR 59,159 |
| 24h change | -1.35% | +0.57% over 1h |
| 7d / 14d change | -13.86% / -21.10% | Accelerating short-term drawdown |
| 30d / 200d change | -22.61% / -18.78% | Deep multi-month correction |
| 1y change | -30.84% | Negative on all horizons above 1h |
| Market cap | EUR 1.164tn | Rank 1; equals fully diluted valuation |
| 24h volume | EUR 29.12bn | ~2.50% of market cap; ~43.2% of total crypto volume |
| BTC dominance | 58.13% | Of EUR 2.00tn total crypto market cap |
| Supply | 20,113,584 / 21,000,000 | 95.78% of max supply issued |
| All-time high | EUR 107,662 (2025-10-06) | Currently -46.25% below |
| Fed funds target | 3.75% to 4.00% | As of 2026-11-18; last change 25bp hike effective 2026-09-17 |
| ECB deposit rate | 2.50% | As of 2026-11-19; last change 25bp hike effective 2026-09-16 |
Data retrieved 2026-11-19T05:15Z. Gold and Ethereum benchmark prices are not in the dataset.
Market Setup
The cross-asset backdrop is negative. Risk sentiment is negative and equity momentum is moderately negative: DACH indicators average -4.11% over 5 days versus -3.42% for global equity indicators, with the ATX weakest at -4.35% and the DAX at -3.87% over 5 days, though it leads on a 1-month basis at +1.64%. The S&P 500 sits at 7,323.63, down 3.54% over 5 days. Rates are the key transmission channel: the Euro Area AAA 10Y yield stands at 3.42%, up 8.4bp over 5 days and 47.7bp year to date, with the AAA 10Y-2Y spread at 33.2bp. The euro is broadly weaker, with EUR/USD at 1.0994 (-0.68% over 5 days, -2.08% over 1 month), which partially cushions EUR-quoted Bitcoin on FX translation even as the rates channel pressures it.
Policy is restrictive on both sides of the Atlantic. The Federal Reserve funds target range is 3.75% to 4.00% following a 25bp hike effective 2026-09-17, and the ECB deposit facility rate is 2.50% following a 25bp hike effective 2026-09-16. No forward policy expectations are in the dataset; any easing path discussed below is a scenario assumption, not market-implied pricing. Reported commentary [T2] states Bitcoin’s correlation with 10-year US real yields has climbed above 0.6 as US federal debt passes $40 trillion; this figure is from an undated secondary source and cannot be verified against data in this bundle.
Investment Thesis
Bitcoin is an institutionalised, macro-linked risk asset in a deep drawdown, and the institutional plumbing that once acted as a one-way bid now transmits macro conditions in both directions. US spot Bitcoin ETFs moved from approximately $4.7 billion of net outflows in Q2 to $6.4 billion of inflows in Q3, a reversal that shows ETFs have become a two-way portfolio-allocation channel rather than a permanent structural bid [T1]. Institutionalisation has expanded access but also tied Bitcoin to the same rates, yield and cross-asset allocation decisions that govern equities and bonds [T1].
The structural case remains intact. Supply is capped at 21 million coins with 95.78% already issued, so price is the only marginal adjustment valve. Year-to-date ETF flows are roughly flat to modestly positive despite sharp daily swings, new whale entities are selectively accumulating near current cost bases, and corporate treasury buying slowed through Q3 [T2]. The traditional four-year boom-and-bust cycle may be becoming less predictable as institutional ownership grows, potentially reducing volatility and supporting maturation into a long-term asset class [T3].
Base case (scenario): with policy restrictive at 3.75% to 4.00% in the US and 2.50% at the ECB, Bitcoin consolidates in a wide range while ETF flows stay choppy and price tracks real-yield expectations. Bull case (scenario): a macro pivot plus sustained ETF demand re-rates BTC toward prior-cycle highs, with institutional maturation dampening drawdown depth versus prior cycles [T3]. Bear case (scenario): continued restrictive policy and negative risk sentiment push BTC to new cycle lows as the ETF channel amplifies outflows, as it did in Q2 [T1].
Bullish Drivers
- ETF demand can re-accelerate. Q3 inflows of $6.4 billion followed Q2 outflows of roughly $4.7 billion, demonstrating that the flow regime can flip quickly when macro conditions improve [T1]. If the Q3 pattern persists, cumulative inflows could provide a floor-building mechanism.
- Regulatory maturation. Clearer frameworks in major markets could lower operational risk and encourage institutional capital flows [T6]. Eleven US spot Bitcoin ETFs launched in January 2024, and spot Ether ETFs received final SEC approval in July 2024, deepening regulated access [T5].
- Deepening fee competition widens the investor base. GBTC has seen over $27 billion of cumulative net outflows into cheaper vehicles such as IBIT and FBTC, and Grayscale’s Mini Trust at 0.15% has gathered over $5 billion [T4]. Falling cost of exposure supports incremental allocation.
- Whale accumulation. New whale entities are selectively accumulating near current cost bases even as corporate treasury buying slowed through Q3 [T2].
- Fixed scarcity. 20,113,584 of 21,000,000 coins are issued (95.78%). With issuance nearly complete, no supply overhang can dilute holders; price discovery runs through demand alone.
Relative Positioning vs Gold and Ethereum
Data limitation: the bundle contains no gold price and no Ethereum price, so a quantitative performance comparison against either benchmark is not possible in this report. The comparison below is structural and flow-based.
Versus gold: the digital-gold narrative is tactically weakened by the correlation regime. Reported commentary [T2] states Bitcoin’s correlation with 10-year US real yields has climbed above 0.6, meaning Bitcoin currently trades closer to a high-beta risk asset than to a safe haven. If that correlation persists, rate shocks transmit directly into BTC while gold’s defensive characteristics diverge. Scenario (assumption): only a regime in which real yields fall without a growth shock would let BTC trade on its scarcity narrative rather than its beta.
Versus Ethereum: ETH now has a comparable regulated wrapper after spot Ether ETF approval in July 2024 [T5], so relative BTC/ETH performance is increasingly driven by flows and use-case narratives rather than access constraints. Bitcoin retains the scale advantage: 58.13% dominance of a EUR 2.00tn total crypto market and roughly 43.2% of total 24h crypto volume (EUR 29.12bn of EUR 67.34bn). Custody structure also differs across the ETF complex: Coinbase custodies the majority of spot Bitcoin ETF assets while Fidelity self-custodies FBTC, a structural differentiator for operational risk [T4].
Scenario Framework
All scenarios are assumptions, not forecasts. Anchors: price EUR 57,863, -46.25% from the EUR 107,662 ATH of 2025-10-06; Fed funds target 3.75% to 4.00%; ECB deposit rate 2.50%; Euro Area AAA 10Y at 3.42% (+47.7bp YTD); ETF flows of -$4.7bn in Q2 and +$6.4bn in Q3 [T1].
- Bull scenario (assumption): policy easing expectations build in 2027, ETF inflows re-accelerate as in Q3 [T1], and negative risk sentiment fades. BTC recovers toward EUR 75,000 to 90,000, still short of the ATH. Recovery to the ATH alone implies +86.1% from the current price (107,662 / 57,863 – 1).
- Base scenario (assumption): rates stay at current levels, flows stay choppy around flat year-to-date [T2], and equity momentum stays moderately negative. BTC ranges between EUR 50,000 and 65,000 while the market digests the drawdown.
- Bear scenario (assumption): a further policy tightening or a risk-off shock drives ETF outflows as in Q2 [T1]. BTC breaks below EUR 50,000, extending the 1-year decline of -30.84% and pushing further below the -46.25% ATH discount.
Valuation Discussion
Traditional cash-flow valuation does not apply to Bitcoin; the dataset supports only market-anchored measures. Price sits 46.25% below the ATH set on 2025-10-06 and 30.84% below the year-ago level. Market cap is EUR 1.164tn and equals the fully diluted valuation because 100% of the 21 million cap is counted at current price; 95.78% of supply is already circulating. Turnover is healthy but not distressed: 24h volume of EUR 29.12bn is roughly 2.50% of market cap, and Bitcoin accounts for about 43.2% of total crypto volume.
With supply fixed, marginal price discovery is dominated by ETF flow direction rather than issuance. The Q2-to-Q3 flow reversal [T1] is therefore the single most important valuation swing factor: the same wrapper can be a source of supply or demand depending on yields, volatility and portfolio preferences. Cost compression in the ETF complex, from GBTC’s 1.50% fee to 0.15% for the Mini Trust [T4], lowers the carrying cost of institutional exposure over time. Scenario (assumption): if institutional maturation reduces volatility as argued in T3, a lower risk-premium-style discount could justify a structurally higher valuation anchor over time, but no on-chain metrics (MVRV, hash rate, exchange balances) are in this dataset to corroborate fundamental support levels.
Risks
- Restrictive policy. The Fed funds target of 3.75% to 4.00% and the ECB deposit rate of 2.50%, both raised 25bp in September 2026, keep the discount rate on a zero-cashflow asset elevated. Scenario (assumption): a further hiking cycle would, via the rates-sensitivity mechanism in [T1], likely deepen the current -22.61% 30-day drawdown.
- Custodian concentration. Coinbase Custody serves as primary custodian for eight or more US spot Bitcoin ETFs, representing over 80% of total spot ETF assets. A security breach, regulatory action or operational failure there could affect the majority of the market simultaneously [T4].
- Two-way ETF flows. Q2 demonstrated that regulated products can become a source of supply when yields or risk appetite shift [T1]. Treating ETF demand as a permanent bid is a strategy error.
- Correlation regime. A reported correlation above 0.6 with 10-year US real yields [T2, undated source] means rate shocks transmit directly; this figure cannot be verified against data in this bundle.
- Macro tape. Negative risk sentiment and DACH underperformance (-4.11% 5-day average) frame the current environment, with the Euro Area AAA 10Y yield grinding higher.
- Evolving regulation and structure. Regulation is still evolving and ETP structure and custody choices carry investor-facing risks [T7].
Appendix
Methodology and timestamps. Market data via CoinGecko, retrieved 2026-11-19T05:15Z; all price and performance figures are EUR-quoted from a single snapshot and intraday moves after retrieval are not captured. Market overview data points are as of 2026-11-18 or 2026-11-19 as labelled per source. News sources T1 to T8 were retrieved 2026-11-19T05:15Z; T1, T2 and T3 lack publication dates and all figures from them are treated as undated commentary, not current data. T2 contains a USD price reference of roughly $81,419 that is inconsistent with the current EUR 57,863 quote; it is treated as historical context only.
Policy rate provenance. Policy rates come exclusively from the bundle’s policy_rates block: US Federal Funds Target Range of 3.75% to 4.00% as of 2026-11-18, last change a 25bp hike effective 2026-09-17; ECB Deposit Facility Rate of 2.50% as of 2026-11-19, last change a 25bp hike effective 2026-09-16. No forward rate expectations are in the dataset; Bank of England, Swiss National Bank and Bank of Japan policy rates are not in the dataset.
Missing data. Gold and Ethereum prices are not in the bundle, so the Relative Positioning section is qualitative. US 10-year real yield levels, euro-area inflation breakevens, and on-chain metrics are not in the dataset and could not be computed.
Calculations shown. Supply issued: 20,113,584 / 21,000,000 = 95.78%. Turnover: 29,124,589,986 / 1,163,835,956,258 = 2.50%. Volume share: 29.12bn / 67.34bn = 43.2%. Recovery to ATH: 107,662 / 57,863 – 1 = +86.1%.
Sources
- [T1] Crypto After the Midterms: Regulation, Liquidity and the Institutional Era – AMINA Bank
- [T2] Bitcoin Q3 Rally Makes Sense with Changing Macro Backdrop – LinkedIn (Brett Munster)
- [T3] The End of Bitcoin’s Four-Year Cycle? How ETFs and Institutions Are Reshaping the Market – Wolf & Company (via New Jersey Bankers Association)
- [T4] Which Bitcoin ETF Should I Buy? Complete Comparison Guide – Spark
- [T5] Cryptocurrency ETFs: Crypto exposure, listed on traditional exchanges – Britannica Money
- [T6] FDIG: Weighing Crypto Infrastructure Exposure in a Shifting Macro Backdrop – Tickeron
- [T7] The Role of Crypto ETPs for Investors – etf.com
- [T8] How ETFs Compare with Other Investments: FAQs – Investment Company Institute
Disclaimer. This report is AI-generated and provided for informational purposes only. It does not constitute investment advice, a recommendation, or an offer to buy or sell any financial instrument. Figures are drawn from the cited sources and may be incomplete, delayed, or inaccurate. Readers should conduct their own due diligence and consult a licensed advisor before making investment decisions.
Important Note / Wichtiger Hinweis:
EN: This report may have been generated using AI. It processes data from publicly available sources. The content is provided for informational purposes only.DE: Dieser Bericht kann mithilfe von KI erstellt worden sein. Dabei werden Daten aus öffentlich zugänglichen Quellen verarbeitet. Die Inhalte dienen ausschließlich Informationszwecken.
* DE: Die ergänzenden Inhalte können KI-generiert sein. EN: The additional content may be AI-generated.