
Watch the video
This player shows only the Bitcoin chapter of the daily altii market briefing. Watch the full video on tube.altii.de.
Key Data Snapshot
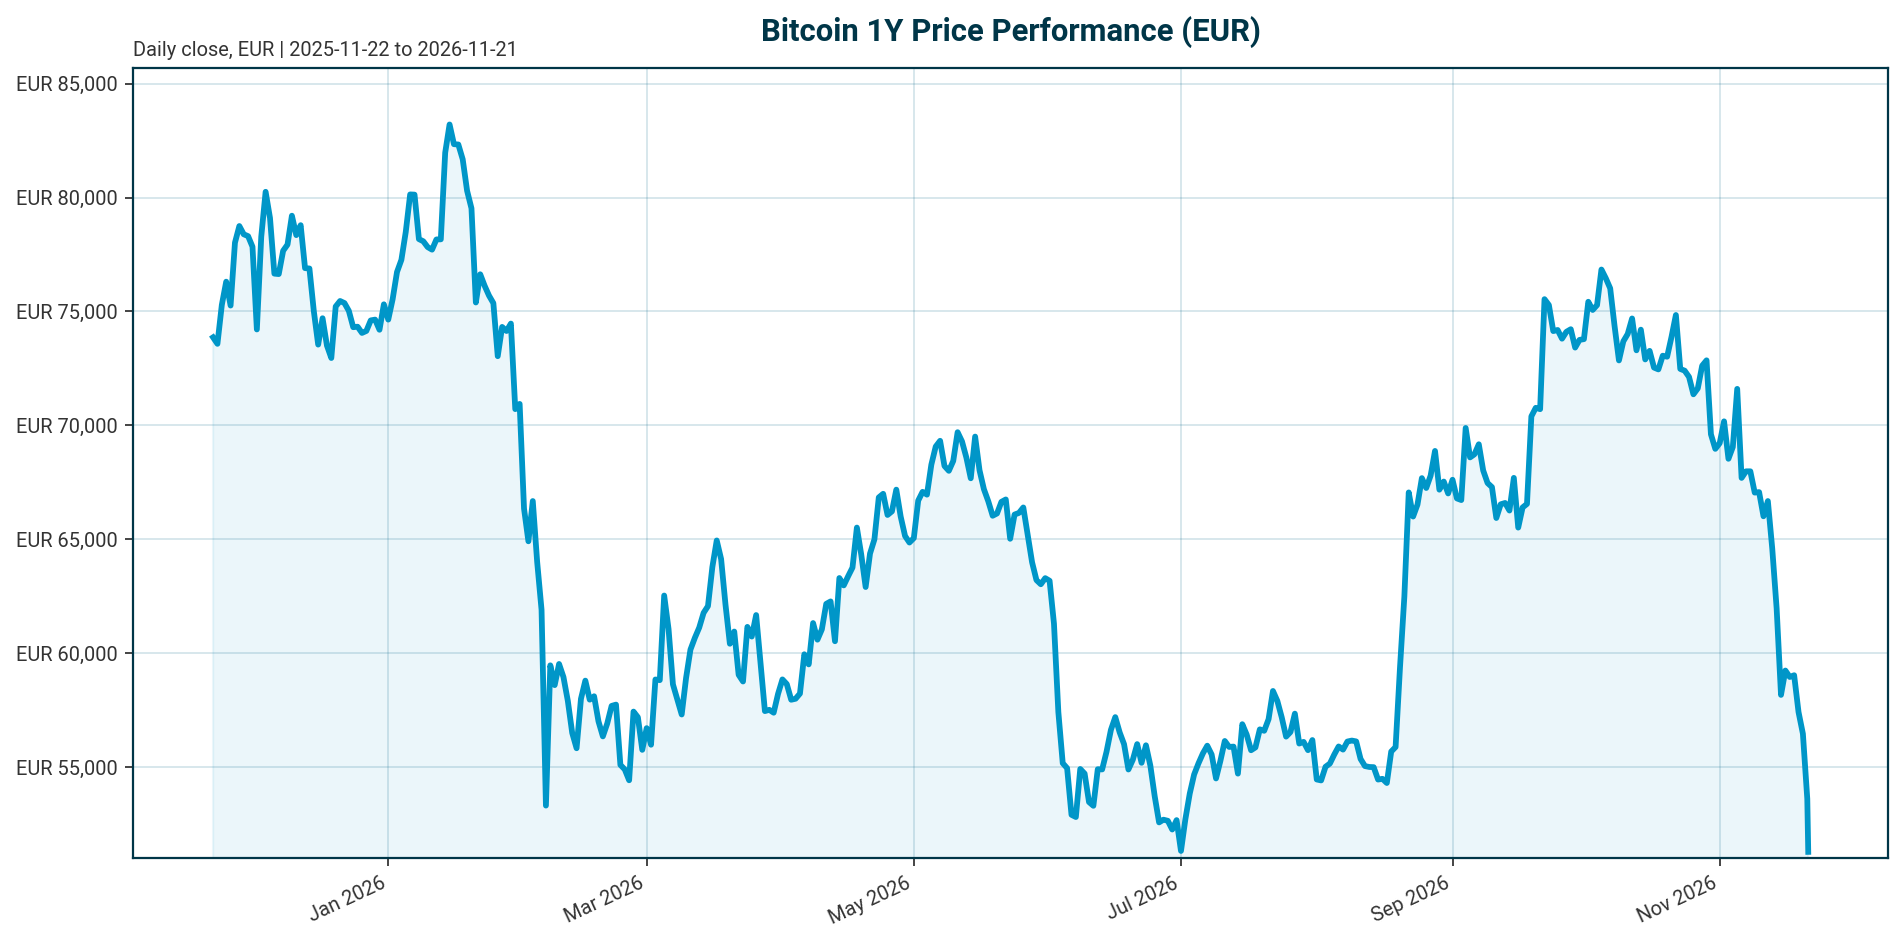
| Metric | Value | Change |
|---|---|---|
| BTC/EUR price | EUR 51,255.00 | -8.52% (24h), -0.68% (1h) |
| 24h range | EUR 50,685 to EUR 56,708 | trading near session low |
| 7d / 14d / 30d | -15.66% / -25.81% / -32.12% | |
| 200d / 1y | -30.43% / -34.38% | |
| Market cap | EUR 1.031 trillion (rank 1) | -8.66% (24h), about EUR -97.8 billion |
| 24h volume | EUR 55.59 billion | 5.39% of market cap, elevated turnover |
| BTC dominance | 57.34% | total crypto cap EUR 1.793 trillion |
| All-time high | EUR 107,662 (2025-10-06) | current price -52.39% below |
| Supply | 20,115,100 of 21,000,000 BTC (95.79% mined) | FDV equals market cap |
Data retrieved 2026-11-21 05:15 UTC, quote currency EUR. The 24h drop of 8.52% on 5.39% daily turnover is consistent with capitulation-style trading rather than quiet accumulation. The decline has accelerated: roughly one-third of the price was lost in 30 days and more than half from the October 2025 peak.
Market Setup
The macro backdrop is unambiguously negative for risk assets. Risk sentiment is negative, equity momentum is broadly negative, and DACH equities are broadly in line with global peers: DACH indicators average -6.59% over 5 days versus -6.40% for global equity indicators. The Nasdaq Composite is the weakest 5-day performer at -7.72% and is down 15.30% over one month; the S&P 500 is -6.83% over 5 days and -10.92% over one month. The DAX sits at 24,802.78, -6.75% over 5 days, while the ATX at 6,204.21 is -6.44% over 5 days but still +16.71% year to date.
Rates are the transmission channel. Euro area AAA 10Y yield stands at 3.44% (+3.0 bp over 5 days), the AAA 2Y at 3.13% (+101.7 bp year to date), with a 10Y-2Y spread of 31.6 bp. Policy is restrictive on both sides of the Atlantic: the Federal Funds target range is 3.75% to 4.00% as of 2026-11-20, following a 25 bp hike effective 2026-09-17, and the ECB deposit facility rate is 2.50% as of 2026-11-21, following a 25 bp hike effective 2026-09-16. FX is mixed: EUR/USD at 1.0988 (-0.15% over 5 days, -6.49% year to date), EUR/GBP the strongest 5-day mover at +0.33%.
This matters for Bitcoin because institutional access has hardened the link between crypto and the rates cycle. As AMINA Bank research argues, ETFs now connect Bitcoin to the same asset-allocation decisions that govern equities, bonds and commodities, so tightening monetary expectations hit Bitcoin alongside other macro-sensitive assets [T1]. Scenario assumption: if global equity de-risking persists, Bitcoin’s high-beta profile implies continued correlated downside rather than decoupling. Scenario assumption: any shift in Fed expectations, not a current decision since the last actual change was the September 2026 hike, would be the most likely macro trigger for an ETF-flow reversal [T1][T5].
Investment Thesis
The central tension is structural adoption versus a cyclical, flow-driven bear market. Bitcoin is down 52.39% from its EUR 107,662 all-time high, yet institutional 13F holdings reached a record 356,491 BTC at the end of Q3 2026, reversing three quarters of net selling [T6][T7]. At the same time, the marginal price setter is clearly flow, not scarcity: US spot Bitcoin ETF flows swung from roughly USD 4.7 billion of net outflows in Q2 to USD 6.4 billion of inflows in Q3, then reversed again into outflows in October and November [T1][T6][T7].
ETFs have become a two-way portfolio-allocation channel, not a permanent structural bid. The same wrapper that brought institutional capital in gives investors a simple way to reduce exposure when yields, volatility or portfolio preferences change [T1]. Total Bitcoin held across ETP funds fell from 1.29 million BTC at quarter-end to 1.25 million BTC by November 16, 2026 [T8]. Against this, the patient money has not left: long-term holders kept adding through the drawdown to a record by July, and Strategy has kept buying to more than 845,000 BTC [T5]. Bitwise’s head of research André Dragosch characterized the recent selling as related to a short-term risk-off environment rather than a structural change in institutional sentiment [T6].
Base scenario: Bitcoin remains range-bound and flow-dependent until ETF inflows resume sustainably or the rates backdrop eases. Bull scenario: renewed institutional accumulation, regulatory clarity after the US midterms and a shift in Fed expectations re-rate Bitcoin toward prior highs [T4][T5]. Bear scenario: continued ETF redemptions and leveraged liquidations extend the drawdown; dated commentary flagged sub-USD-75,000 risk when Bitcoin traded near USD 83,000 [T3].
Bullish Drivers
- Record institutional base. 13F filers added 49,229 BTC in Q3 2026, more than offsetting the 47,054 BTC shed over the prior three quarters combined, lifting reported holdings to a record 356,491 BTC, about USD 29.78 billion. The number of reporting managers rose by 191 to 2,166 [T6][T7].
- Broadening buyer base. Investment advisors and wealth platforms reached a record 40.5% share of recorded institutional investments and have been net buyers for nine consecutive quarters. Wells Fargo became the largest reported holder for the first time with 30,553 BTC, roughly USD 2.55 billion, nearly double the prior quarter [T7].
- Concentrated, deep plumbing. BlackRock’s IBIT accounts for 232,453 BTC of 13F-reported holdings, 65.2% of recorded positions; IBIT and Fidelity together represent 77% of reported holdings, giving Bitcoin the deepest institutional access infrastructure in crypto [T6][T7].
- Fixed supply, patient holders. 95.79% of the 21 million cap is already mined, so there is no issuance overhang. Long-term holder holdings reached a record by July and Strategy holds more than 845,000 BTC [T5].
- Squeeze fuel. Approximately USD 3.3 billion in short positions could face liquidation on an upward move, per dated commentary [T3]. Scenario assumption: a squeeze triggered by an inflation surprise or a Fed expectation shift could produce a sharp tactical rally, per the mechanism described in [T1] and [T3].
Relative Positioning vs Gold and Ethereum
No gold or Ethereum spot price data is present in this dataset, so quantitative benchmark comparisons are unavailable and the positioning assessment is qualitative. Bitcoin’s 1-year return of -34.38% and 30-day return of -32.12% frame the risk profile against gold’s traditional safe-haven role: in a risk-off regime, gold would be expected to outperform, and Bitcoin’s institutionalization has increased rather than decreased its correlation to risk assets [T1].
Within crypto, Bitcoin remains the anchor asset with 57.34% dominance of a EUR 1.793 trillion total market. The current sell-off is broad rather than Bitcoin-specific: dated commentary describes Ethereum, XRP, Dogecoin, Cardano and Litecoin all in negative territory in the same session as Bitcoin’s USD 81,419 print, with combined Bitcoin and Ether ETF outflows of USD 390.9 million in one reported session showing correlated de-risking across the two major crypto assets [T3]. Scenario assumption: if risk appetite recovers, Bitcoin’s deeper institutional plumbing relative to Ethereum could channel a disproportionate share of the first inflow wave, given IBIT and Fidelity alone hold 77% of 13F-reported BTC positions [T6].
Scenario Framework
All scenarios are assumptions, not forecasts. USD scenario levels from dated sources are converted to EUR at the current EUR/USD of 1.0988 for illustration only; FX movement over the horizon makes these bands indicative.
- Bull scenario. Triggers: sustained spot ETF inflows at the Q3 pace of USD 6.4 billion per quarter, expanded corporate treasury adoption, regulatory clarity after the US midterms, and a shift in Fed expectations [T4][T5]. Dated commentary cites a breakout target of USD 107,000 [T5], roughly EUR 97,000 at current FX, which would approach the EUR 107,662 all-time high.
- Base scenario. Bitcoin consolidates in a wide EUR 45,000 to 65,000 range as tactical ETF money and long-term holders offset each other, consistent with the two-channel flow framework in [T5]. The near-term view in dated commentary is cautiously optimistic, contingent on Bitcoin holding support and regaining momentum.
- Bear scenario. Continued monthly ETF outflows above USD 500 million plus equity-market stress push Bitcoin toward the sub-USD-75,000 zone flagged in dated commentary [T3], roughly EUR 68,000 at current FX. Note the current EUR price of 51,255 already sits below that converted level, indicating the market has moved past that dated marker. A deeper tail case exists if leveraged liquidations cascade as in the USD 19 billion liquidation event referenced one year prior [T3].
Flow calibration: Q3 inflows of USD 6.4 billion [T1]; October outflows of USD 515 million and November month-to-date outflows of USD 2.9 billion per TFTC [T6] or USD 3.4 billion per SoSoValue [T7]. Regulatory overhang: US crypto legislation is delayed and the window for 2026 legislative progress narrowed considerably around the 3 November midterms; divided government could increase policy uncertainty and weigh on Bitcoin [T2][T5].
Valuation Discussion
Is the 52.39% drawdown from the EUR 107,662 high value or a value trap? The supply side offers no help in either direction: with 95.79% of the 21 million cap mined and FDV equal to market cap, there is no future issuance overhang, but also no scarcity-driven supply squeeze. Scarcity is fully priced into issuance; the marginal price setter is institutional flow.
The market-structure evidence argues caution on calling a bottom. Dated commentary argues Bitcoin faces a market-structure problem, not solely a valuation problem: leverage and positioning, not scarcity, are setting the marginal price, one year after a USD 19 billion liquidation event showed that excessive leverage can overwhelm fundamentals within hours [T3]. Market cap fell EUR 97.76 billion, or -8.66%, in 24 hours, showing the mark-to-market sensitivity of the institutional wrapper complex.
The institutional data is lagging and possibly overstated. 13F holdings reflect positions as of September 30, 2026, exclude short positions and most derivatives, and predate the subsequent decline in ETP holdings from 1.29 million to 1.25 million BTC by November 16 [T7][T8]. Concentration adds noise: a few dozen large institutions drove Q3 accumulation, with IBIT alone at 65.2% of recorded positions [T6][T7]. Scenario assumption: if the drawdown is flow-driven rather than adoption-driven, as Dragosch argues [T6], drawdowns of this magnitude have historically preceded recoveries when ETF flows turn; this is a pattern assumption, not a forecast. Scenario assumption: if a small number of concentrated holders set the marginal price, reported valuation signals are noisier than headline market cap suggests.
A cross-check on currency: the bundle price of EUR 51,255 at EUR/USD 1.0988 implies about USD 56,320. Dated news cites a USD 61,000 print on November 20 amid a stock sell-off [T7]. The gap suggests either intraday continuation after that print or timing differences between sources; readers should treat all USD figures from news as historical context, not current state.
Risks
- Macro and rates risk. Policy is restrictive with the Fed at 3.75% to 4.00% and the ECB at 2.50% following September 2026 hikes. Euro AAA 2Y yields are up 101.7 bp year to date, pressuring risk assets. Scenario assumption: a further Fed hike cycle, hypothetical and not a current decision, would likely extend both equity and crypto drawdowns via the ETF allocation channel.
- Flow reversal risk. ETF outflows reached USD 515 million in October and USD 2.9 to 3.4 billion November month-to-date depending on the tracker [T6][T7]. ETF holders sitting on losses are more likely to cut exposure than buy the dip [T5].
- Leverage risk. One year after the USD 19 billion liquidation event, excessive leverage can still overwhelm fundamentals within hours [T3].
- Correlation risk. Bitcoin now trades as a macro-sensitive risk asset, moving with equities when monetary policy expectations tighten [T1]. Scenario assumption: a disorderly equity correction, with the Nasdaq already -15.30% over one month, is the most probable near-term amplifier of Bitcoin downside.
- Regulatory risk. US crypto legislation is delayed; divided government could increase policy uncertainty and weigh on Bitcoin [T2][T5].
- Concentration risk. Institutional accumulation was driven by a few dozen large institutions, with IBIT at 65.2% of recorded positions [T6][T7].
- Custody and operational risk. Institutions remain exposed through compromised credentials, excessive internal permissions or connected applications, per dated commentary [T2].
Appendix
Methodology and Data Provenance
All headline metrics come from the CoinGecko bundle retrieved 2026-11-21 05:15 UTC, quote currency EUR. Euro yield curve data is from the ECB as of 2026-11-19; equity and FX data as of 2026-11-20/21. Policy rates come from the authoritative bundle block: Federal Funds target range 3.75% to 4.00% as of 2026-11-20, last change a 25 bp hike effective 2026-09-17; ECB deposit facility rate 2.50% as of 2026-11-21, last change a 25 bp hike effective 2026-09-16. No other central bank policy rates are in the dataset.
News-derived figures are predominantly USD-denominated and several source items lack publication timestamps. Each news figure is quoted with its source attribution and internal dating where available, for example the USD 61,000 print on November 20 per [T7]. No news figure is presented as current market state. Several sources are undated in the source list and reference USD price levels from different periods; the report treats them as historical context. [T3] is a LinkedIn post and [T5] is leveraged-product provider research; both are market commentary, not primary data.
Definitions and Calculations
- Supply mined: 20,115,100 / 21,000,000 = 95.79%.
- Drawdown from ATH: (51,255 – 107,662) / 107,662 = -52.39%.
- Daily turnover: 55.59 / 1,031.1 billion = 5.39%.
- Dominance cross-check: 1,031.1 / 1,793.3 billion = 57.5%, versus the bundle’s reported 57.34%; difference reflects rounding and provenance.
- Implied USD price: EUR 51,255 x 1.0988 = about USD 56,320; reconciled against the dated USD 61,000 print in [T7] with the discrepancy flagged.
- BTC dominance: Bitcoin’s share of total crypto market capitalization. FDV: fully diluted valuation, equal to market cap here because total supply equals circulating supply. 13F: quarterly US regulatory filings by institutional investment managers; they exclude short positions and most derivatives.
- Gold and Ethereum spot prices are unavailable in this dataset; relative positioning versus these benchmarks is qualitative.
Sources
- [T1] Crypto After the Midterms: Regulation, Liquidity and the Institutional Era – AMINA Bank
- [T2] Bitcoin ETF inflows return as US crypto legislation faces delays
- [T3] Bitcoin Price Won’t Be Saved by Scarcity, ETF Outflows Signal Sub-$75,000 | Ashwin Binwani (LinkedIn)
- [T4] Where Could Bitcoin Be By The End Of 2027? 3 Scenarios Investors Are Watching
- [T5] Bitcoin Has Bottomed and Breakout Targets $107K – Leverage Shares
- [T6] Institutional Bitcoin ETF holdings clock record quarter after selling streak – TradingView News
- [T7] Institutional Investments in Bitcoin Funds Reach Record Levels | ForkLog
- [T8] Wells Fargo & Wall Street Buy Record $4B Bitcoin in Q3
Disclaimer
This report is AI-generated and provided for informational purposes only. It does not constitute investment advice, a recommendation, or an offer to buy or sell any financial instrument. Figures are drawn from the data bundle and cited third-party sources as of the stated retrieval times and may be incomplete, lagging, or subject to revision. Scenario levels are illustrative assumptions, not forecasts. Readers should conduct their own due diligence and consult a licensed advisor before making investment decisions.
Important Note / Wichtiger Hinweis:
EN: This report may have been generated using AI. It processes data from publicly available sources. The content is provided for informational purposes only.DE: Dieser Bericht kann mithilfe von KI erstellt worden sein. Dabei werden Daten aus öffentlich zugänglichen Quellen verarbeitet. Die Inhalte dienen ausschließlich Informationszwecken.
* DE: Die ergänzenden Inhalte können KI-generiert sein. EN: The additional content may be AI-generated.