
Watch the video
This player shows only the Bitcoin chapter of the daily altii market briefing. Watch the full video on tube.altii.de.
Key Data Snapshot
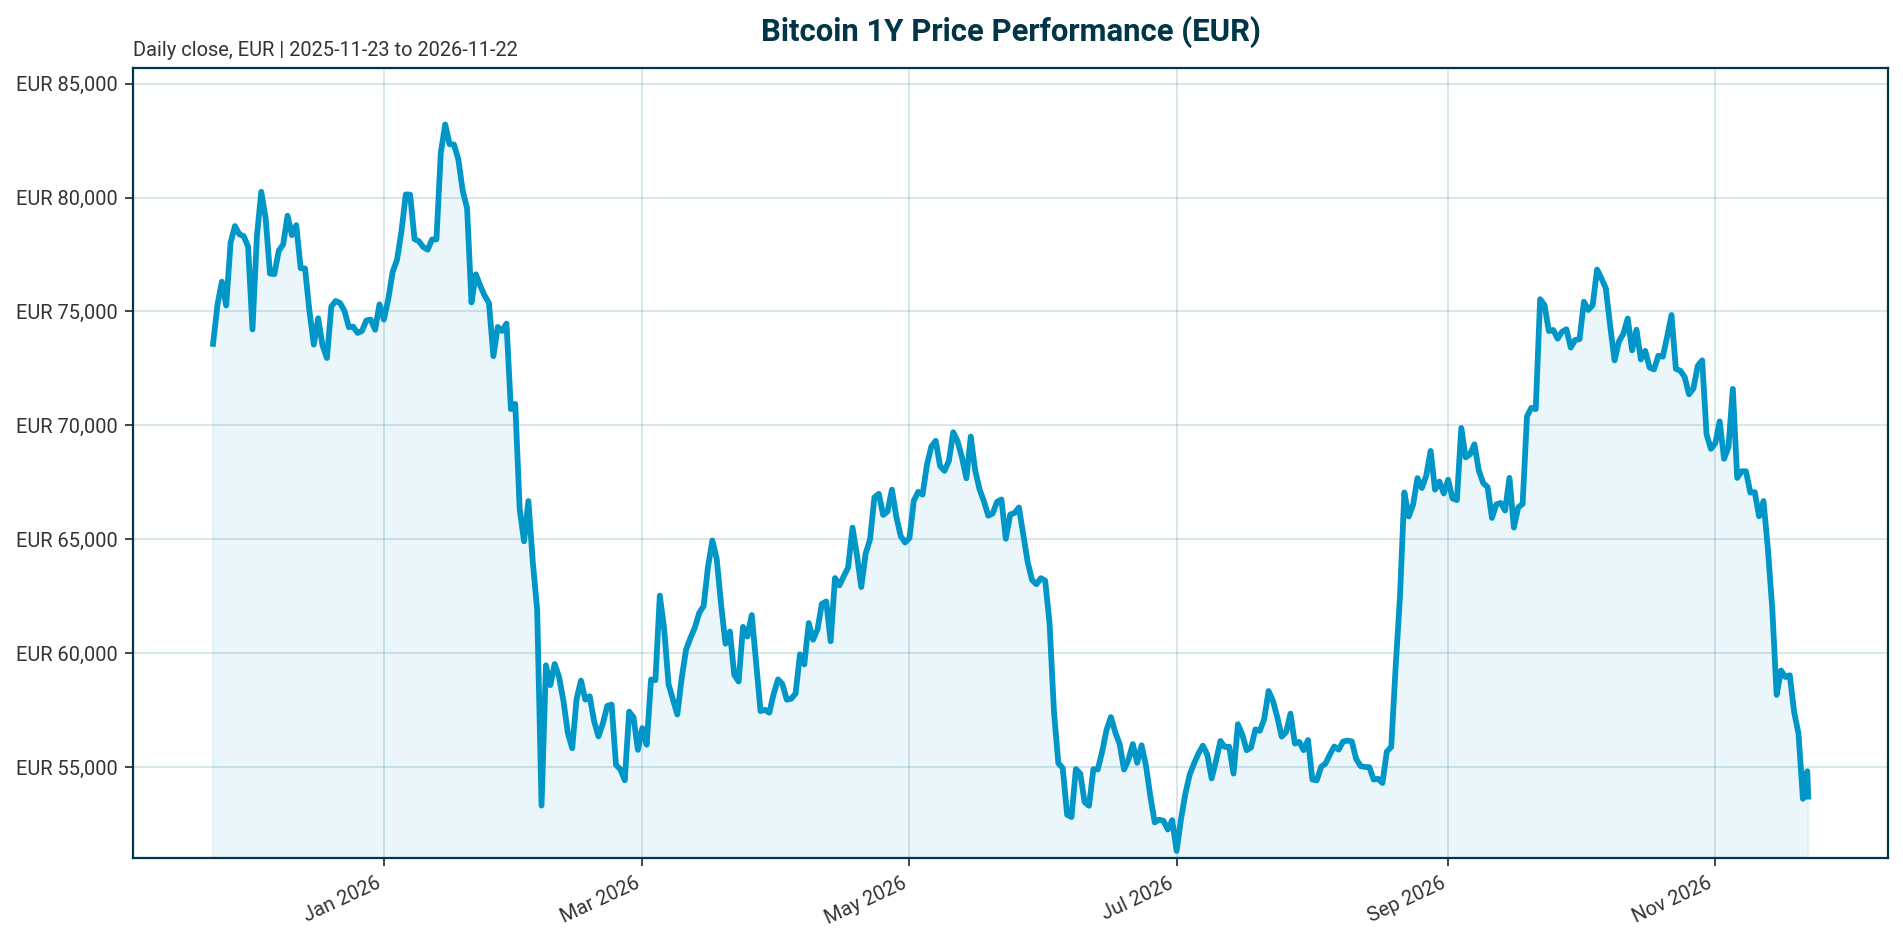
All Bitcoin figures in EUR, retrieved 2026-11-22 05:15 UTC.
| Metric | Value |
|---|---|
| Price | EUR 53,726 |
| 24h change | +4.86% |
| 7d / 14d / 30d change | -8.61% / -21.90% / -27.60% |
| 1y change | -29.87% |
| 200d change | -27.41% |
| 24h range | EUR 50,418 to 55,433 |
| Market cap | EUR 1.081 trillion (rank 1) |
| 24h volume | EUR 40.6 billion |
| All-time high | EUR 107,662 (2025-10-06); current price -50.10% |
| BTC dominance | 57.66% of a EUR 1.868 trillion total crypto market cap |
| Supply | 20,115,540 of 21,000,000 max (95.8% circulating) |
| Fed funds target | 3.75% to 4.00% (as of 2026-11-21) |
| ECB deposit rate | 2.50% (as of 2026-11-22) |
Calculations: intraday range of EUR 5,015 equals roughly 9.3% of spot, an unusually wide band that signals positioning-driven trading. Daily turnover of EUR 40.6 billion against a EUR 1,081 billion market cap is a 3.76% turnover ratio. The 24-hour bounce of +4.86% does little to change a 30-day trend of -27.60%.
Market Setup
The cross-asset backdrop is firmly risk-off. Risk sentiment is negative and equity momentum is broadly negative across regions: the Nasdaq Composite is the weakest 5-day performer at -7.72% and is down 15.30% over one month, the S&P 500 is down 6.83% over 5 days and 10.92% over one month, and the DAX has lost 6.75% over 5 days. DACH indicators average -6.59% over 5 days, broadly in line with the -6.40% global average. Rates are mixed in the euro area: the AAA 10Y yield sits at 3.44% after a 3.0 bp 5-day move, the 2Y at 3.13%, and the 10Y-2Y spread at 31.6 bp. FX is mixed, with EUR/USD at 1.0987 (-0.06% over 5 days, -6.49% YTD) and EUR/GBP the strongest 5-day mover at +0.41%. Policy is restrictive on both sides of the Atlantic: the Fed funds target range is 3.75% to 4.00% after a 25 bp hike effective 2026-09-17, and the ECB deposit rate is 2.50% after a 25 bp hike effective 2026-09-16. For a non-yielding asset like Bitcoin, this backdrop keeps the opportunity cost of holding high and ties its fortunes directly to global risk appetite.
Investment Thesis
Bitcoin at EUR 53,726 sits exactly at the tension between two forces. The structural case is intact: spot ETFs, public companies and governments together hold roughly one-sixth of all bitcoin that will ever exist, and this supply rarely trades, which amplifies price moves in both directions [T6]. US spot Bitcoin ETFs hold over $118 billion in assets with 38% institutional ownership, up from 24% a year earlier [T4]. The cyclical case is deteriorating: ETFs have proven to be a two-way portfolio-allocation channel rather than a permanent structural bid, swinging from roughly $4.7 billion of net outflows in Q2 to $6.4 billion of inflows in Q3 [T2]. With the Fed funds range at 3.75% to 4.00% and the ECB deposit rate at 2.50%, both following 25 bp hikes in September 2026, the opportunity cost of holding Bitcoin is elevated and macro is the dominant driver [T1].
Base case (scenario): Bitcoin stays range-bound and macro-sensitive while rates remain restrictive. Adoption metrics keep improving, but price recovery awaits a rates catalyst. Bear case (scenario): continued ETF redemptions and extending equity drawdowns push BTC toward the sub-$75,000 (USD) zone flagged in undated market commentary [T3]. Bull case (scenario): a dovish repricing or risk-appetite recovery reactivates the ETF demand channel, with roughly $3.3 billion in short positions providing squeeze fuel [T3]. These are scenario assumptions, not forecasts.
Bullish Drivers
The most important bullish datapoint is relative demand. In October 2026, digital-asset ETPs recorded $1.86 billion of net outflows, but Bitcoin attracted $87.4 million of inflows while Ethereum products bled $1.66 billion, 89.3% of the total. Bitcoin’s ETP market share rose 2.77 percentage points to 79.5% despite its own AUM falling 8.58%, evidence of selective rather than broad demand [T5]. Year to date, digital-asset ETPs attracted $7.99 billion of net inflows through October, led by BlackRock’s IBIT with $4.47 billion, or 55.9% of aggregate flows [T5]. Corporate accumulation also persists: digital-asset treasuries added $1.16 billion to holdings in October, led by Strive’s purchase of 15,124 BTC, with the value of holdings falling 8.61% to $129 billion on price, not selling [T5].
The adoption runway remains long. Spot ETFs gathered about 1.3 million BTC within 1,000 days of the January 2024 launch, while the average US financial adviser still allocates only 0.008% of assets to bitcoin. River estimates bitcoin at roughly 3% of its maximum adoption potential [T6]. Sovereign wealth funds, central banks and pensions continue building exposure through regulated wrappers [T1]. There is also a monetary-hedge bid: net flows into gold and Bitcoin ETFs have trended in the same direction, with their correlation at a six-year high and cumulative flows since launch near $55 billion for BTC and $50 billion for gold (September 2026) [T8]. If the “cornered central bank” narrative persists, with policy unable to ease on sticky inflation, demand for non-fiat stores of value could accelerate for both assets together [T8].
Relative Positioning vs Gold and Ethereum
Versus gold, Bitcoin is failing the “digital gold” test in this drawdown. CNBC reported on 20 November 2026 that crypto is again not acting as a hedge, and that ETF ownership makes bitcoin especially easy to sell [T7]. IBIT, the largest fund, recorded six-month net outflows of $1.65 billion through 18 November and one-month outflows of $1.37 billion; Fidelity’s FBTC had one-month outflows of $322.65 million, per ETF Database [T7]. The counterpoint: gold and Bitcoin ETF flows have trended together, with correlation at a six-year high, and both series bottomed in mid-2026 and recovered in tandem [T8]. If that correlation holds, gold’s safe-haven bid could continue to pull BTC flows, but gold retains the diversification benefit that Bitcoin lacks in equity risk-off episodes. Note that the bundle contains no EUR-quoted gold or Ethereum price data, so this comparison rests on flow and narrative data rather than comparable performance figures.
Versus Ethereum, Bitcoin is clearly winning the flow battle. Ethereum products drove 89.3% of October’s ETP outflows while Bitcoin attracted inflows, a roughly 19x divergence in relative terms ($1.66 billion out vs $87.4 million in) [T5]. Institutions concentrate on Bitcoin first, then Ethereum, which signals where trust and liquidity are deepest [T4]. Bitcoin’s ETP share gain to 79.5% looks like a flight to quality within crypto; a scenario of further ETH underperformance would consolidate BTC dominance, currently 57.66%, at higher levels.
Scenario Framework
Anchor: BTC EUR 53,726, -50.10% from the October 2025 ATH, -27.60% over 30 days. Fed funds target range 3.75% to 4.00%; ECB deposit rate 2.50%.
Bull scenario: A dovish Fed repricing or a recovery in risk appetite reactivates ETF inflows. Undated market commentary cites roughly $3.3 billion in short positions that could be liquidated on higher prices, creating squeeze potential [T3]. FOMC meetings, inflation reports and pending digital-asset legislation are the identified catalysts [T1]. BTC reclaims a meaningful share of the 50% drawdown.
Base scenario: Rates stay restrictive, ETF flows stay two-way and choppy, and BTC-EUR oscillates with equity risk sentiment while adoption metrics keep improving. The Q2-to-Q3 flow swing from -$4.7 billion to +$6.4 billion illustrates the range of outcomes within a single quarter [T2].
Bear scenario: A renewed redemption wave comparable to the $6.38 billion of ETF outflows seen between November 2025 and February 2026 [T4], combined with an extension of the equity drawdown, pushes BTC toward the sub-$75,000 (USD) zone flagged in undated commentary [T3]. As an illustrative scenario conversion only, at EUR/USD 1.0987 that reference implies roughly EUR 68,000, which would still sit well above the current EUR 53,726 spot; this is a labeled conversion of a stale USD reference, not a current level.
Valuation Discussion
Bitcoin has no cash flows or yield, so valuation rests on scarcity and adoption. At EUR 53,726, the market cap of EUR 1.081 trillion equals the fully diluted valuation because 95.8% of the 21 million cap is already circulating; price is therefore purely demand-driven at the margin, increasingly through ETF and institutional channels. Roughly one-sixth of total supply held by ETFs, companies and governments rarely trades, which thins exchange liquidity and amplifies moves in both directions [T6]. Public companies collectively hold close to 1.29 million BTC, more than 6% of coins in existence, as of September 2026 [T7].
Adoption is the main fundamental: a fall in price with rising adoption suggests the holder base is still growing rather than a rally resting on existing holders trading among themselves [T6]. Undated market commentary argues Bitcoin faces a market-structure problem, not just a valuation problem, with liquidity and positioning currently driving price action [T3]. For euro-based investors there is an FX layer: EUR/USD at 1.0987 is down 6.49% YTD, meaning USD-quoted BTC weakness is partially cushioned in EUR terms. The dataset contains no USD-quoted BTC price, so a precise FX attribution of BTC-EUR returns is unavailable. Scenario assumption: if EUR/USD rebounds from 1.0987, EUR-quoted BTC would mechanically underperform USD-quoted BTC, all else equal.
Risks
Rates and opportunity cost: The Fed funds range of 3.75% to 4.00% (last change a 25 bp hike effective 2026-09-17) and the ECB deposit rate of 2.50% (25 bp hike effective 2026-09-16) keep the carry against Bitcoin negative. Undated commentary in [T1] references markets pricing a meaningful probability of a further Fed hike; this is a dated-source expectation, not a decision, and cannot be verified against current futures pricing in this dataset. Competition from higher-yielding assets such as AI-related equities and short-term Treasuries is a principal headwind [T1].
Flow fragility and concentration: IBIT commands roughly half of US spot Bitcoin ETF assets and about $67 billion of the $118 billion-plus ETF AUM [T1] [T4], making its flows a single point of failure. An IBIT-led redemption wave would transmit faster and larger than broad-based outflows. The ETF wrapper cuts both ways: it brought institutions in, and it makes Bitcoin especially easy to sell [T7].
Correlated drawdowns: Institutions sell BTC alongside equities in risk-off conditions. The November 2025 to February 2026 episode saw $6.38 billion of ETF outflows during macro uncertainty [T4]. With global equities in a 5-day drawdown of 6% to 8%, this channel is live.
Leverage and treasury overhang: One year after a $19 billion liquidation event, excessive leverage can still overwhelm fundamentals within hours [T3]. Public companies holding over 6% of supply create a tail risk of forced selling if digital-asset treasury valuations come under pressure [T7].
Appendix
Methodology and data notes. All BTC figures are quoted in EUR from bundle market data retrieved 2026-11-22T05:15:08Z. Macro data is as of 2026-11-20 for equities and 2026-11-19 for euro area AAA yields; FX is as of 2026-11-22. Policy rates come from the authoritative Policy Rates block: Fed funds target range 3.75% to 4.00% (as of 2026-11-21) and ECB deposit facility rate 2.50% (as of 2026-11-22). News figures quoted in USD are not converted to EUR unless explicitly labeled as illustrative; USD-quoted levels from news sources are contextual and do not represent the current BTC-EUR state. Sources T1, T2, T3, T4 and T6 are undated; T5 is an October 2026 report, T7 is dated 20 November 2026, and T8 is dated 4 September 2026. Undated figures are treated as market commentary, not current state. No on-chain metrics, gold prices or Ethereum prices are present in the dataset; the relative-positioning analysis relies on flow data from the cited sources.
Sources
- [T1] IBIT: Weighing Bitcoin ETF Prospects Against Evolving Macro and Institutional Forces (Tickeron, undated)
- [T2] Crypto After the Midterms: Regulation, Liquidity and the Institutional Era (AMINA Bank, undated)
- [T3] Bitcoin Price Won’t Be Saved by Scarcity, ETF Outflows Signal Sub-$75,000 (LinkedIn, undated)
- [T4] How retail investors can benefit from institutional crypto adoption in 2026 (Diamond Pigs, undated)
- [T5] Digital Assets Institutional Adoption – October 2026 (CoinDesk Research)
- [T6] Bitcoin Adoption in Numbers: Who Owns Bitcoin in 2026 (BIT, undated)
- [T7] Bitcoin selloff: Crypto is failing the ‘digital gold’ test again (CNBC, 20 November 2026)
- [T8] Fomo Goes Parabolic (Blockworks 0xResearch, 4 September 2026)
Disclaimer. This report is AI-generated and provided for informational purposes only. It does not constitute investment advice, a recommendation, or an offer to buy or sell any financial instrument. Figures should be independently verified before any decision is made based on this content.
Important Note / Wichtiger Hinweis:
EN: This report may have been generated using AI. It processes data from publicly available sources. The content is provided for informational purposes only.DE: Dieser Bericht kann mithilfe von KI erstellt worden sein. Dabei werden Daten aus öffentlich zugänglichen Quellen verarbeitet. Die Inhalte dienen ausschließlich Informationszwecken.
* DE: Die ergänzenden Inhalte können KI-generiert sein. EN: The additional content may be AI-generated.