
Watch the video
This player shows only the Bitcoin chapter of the daily altii market briefing. Watch the full video on tube.altii.de.
Key Data Snapshot
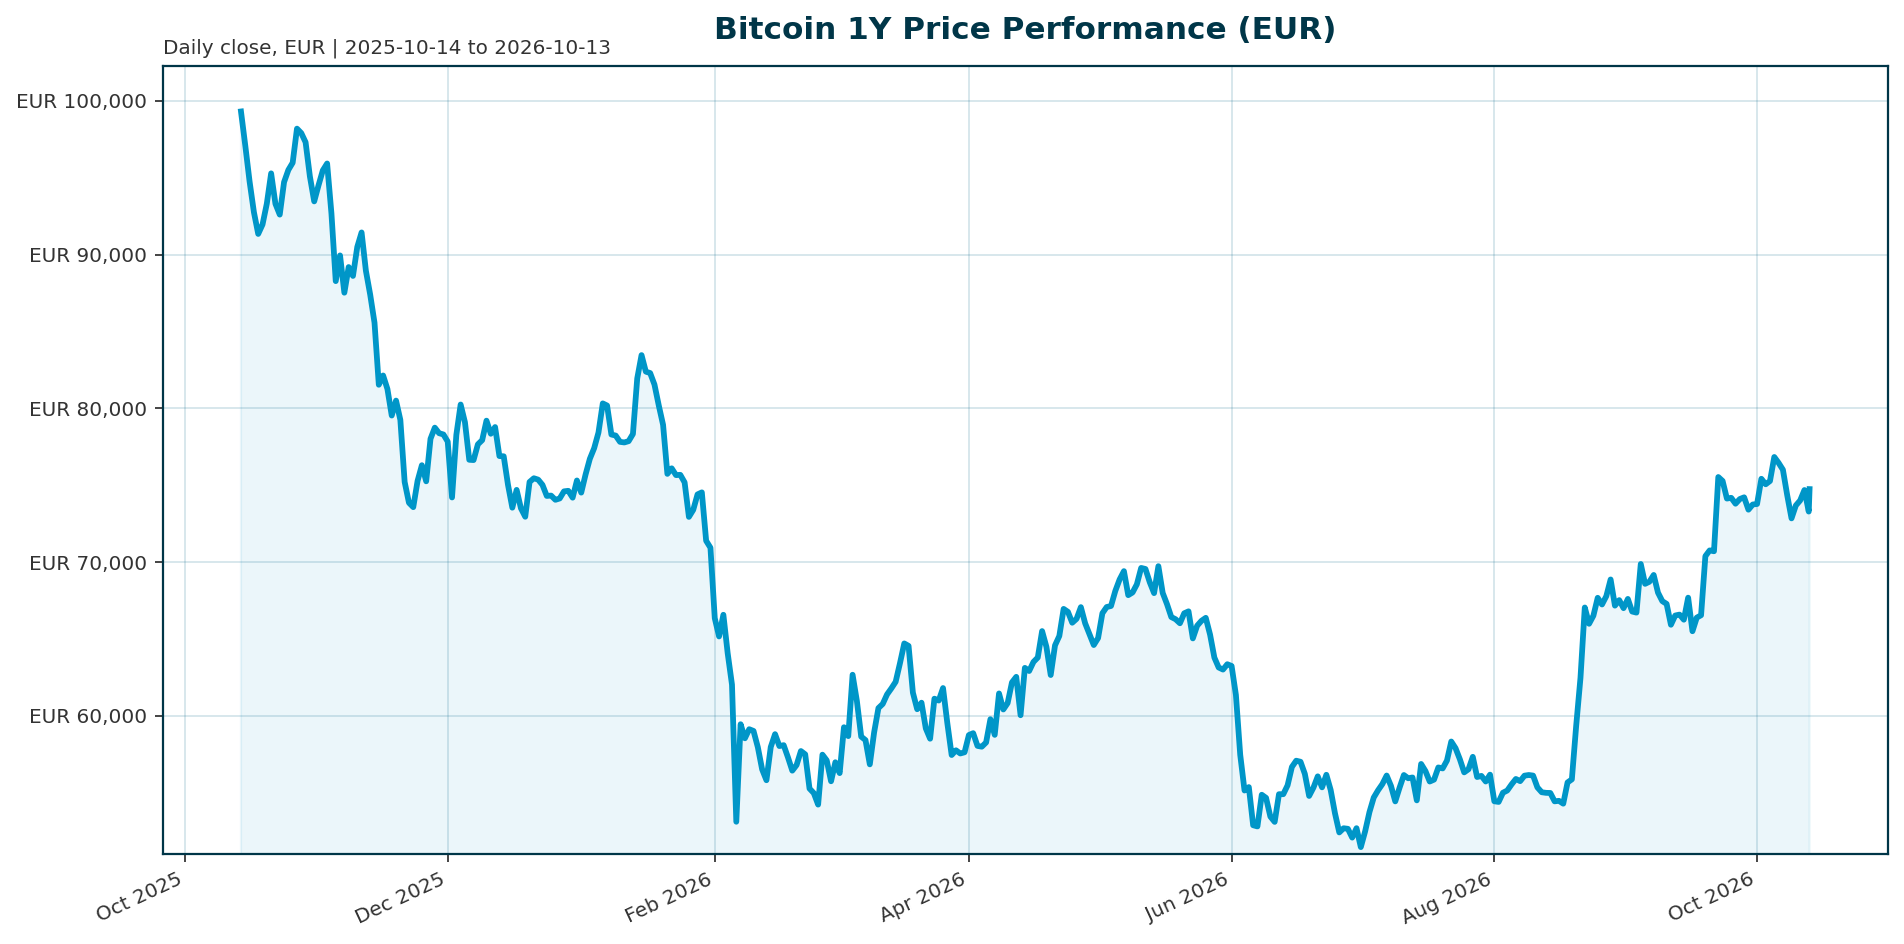
| Metric | BTC/EUR Data | Interpretation |
|---|---|---|
| Spot price | €74,513 | Consolidating after a mixed short-term trend. |
| Market cap / rank | €1.498tn / #1 | Bitcoin remains the largest crypto asset. |
| 24h volume | €28.42bn | Volume-to-market-cap: €28.42bn / €1,497.74bn = 1.90%. |
| Performance | +0.07% 24h; -2.68% 7d; +7.71% 30d; +20.87% 200d; -27.89% 1y | Positive medium-term momentum contrasts with weak 7-day and 1-year returns. |
| 24h range | €72,515 to €75,391 | Range: (€75,391 – €72,515) / €74,513 = 3.86%. |
| All-time high | €107,662 on 6 Oct 2025 | Current drawdown is -30.79%; recovery to ATH implies (€107,662 – €74,513) / €74,513 = 44.49% upside. |
| Supply | 20.097m circulating / 21.000m max | 20.097m / 21.000m = 95.70% issued; 902,632 BTC remain, or 4.30% of max supply. |
| BTC dominance | 59.30% | Bitcoin retains majority weight within the crypto complex. |
| FDV | €1.497739tn | FDV-to-market-cap: €1.497739tn / €1.497738tn = 1.000001, reflecting mature issuance. |
Bitcoin’s data profile is mixed but institutionally relevant. Liquidity remains deep, the supply curve is mature, and market dominance is high. The bearish counterpoint is that current spot remains materially below the euro all-time high and the 1-year return is still negative.
Market Setup
The cross-asset backdrop is not a clean tailwind for Bitcoin. Risk sentiment is neutral-to-negative, euro yields are mixed, and FX is mixed. The Euro Area AAA 10-year yield is 3.51%, up 0.9 bp over five days, while the 10-year minus 2-year spread is 46.4 bp. EUR/USD is 1.1201, down 0.13% over five days and 3.51% over one month. Equity momentum is mixed: DACH indicators average -1.68% over five days versus -1.46% for global equity indicators, the Nikkei 225 is the weakest five-day performer at -4.58%, and the Hang Seng is the strongest at +0.17%.
For BTC/EUR investors, the key point is that Bitcoin now behaves as both a crypto asset and a macro-liquidity asset. Market commentary increasingly frames ETF flows, policy expectations, Treasury liquidity, and broader financial conditions as direct inputs into Bitcoin pricing [T1][T6]. Higher yields can also make institutional buyers more selective because sovereign debt offers a more competitive return profile [T4].
The base case is therefore flow-aware consolidation rather than a one-directional scarcity trade. Better liquidity and durable ETF creations would support upside. Higher rates, ETF redemptions, or weaker risk appetite would argue for lower sizing and tighter risk controls.
Investment Thesis
Bitcoin’s institutional thesis rests on three pillars: capped supply, high liquidity, and expanding regulated access. The hard cap is 21.0m BTC, with 20.097m already circulating. That means scarcity is no longer a distant narrative; it is visible in the current supply profile.
The second pillar is scale. At €1.498tn market capitalization and 59.30% crypto-market dominance, Bitcoin is the crypto asset most likely to pass institutional liquidity, custody, and governance filters. The asset has no cash flows, but it has network durability, monetary scarcity, and deep secondary-market trading.
The third pillar is market structure. Sources describe 2025 as an “institutional supply era,” with 6.7m BTC reportedly held across ETFs, exchanges, and treasuries, and with spot ETFs, corporate treasuries, and regulated vehicles making Bitcoin easier to integrate into adviser, private-bank, and institutional workflows [T1]. ETF wrappers are now a key way institutions express views on Bitcoin scarcity [T5]. Spot Bitcoin ETFs are also described as a primary structural source of institutional demand, although outflows can amplify volatility [T8].
The balanced conclusion: Bitcoin is becoming more institutionally investable, but not less cyclical. Institutionalization improves access and deepens demand channels. It also transmits traditional-market stress into Bitcoin more efficiently when fund flows reverse.
Bullish Drivers
- Supply scarcity: The 21.0m BTC max supply is central to the bullish case. With 95.70% of maximum issuance already circulating, incremental new supply is structurally limited.
- ETF-led institutional demand: One source reported Bitcoin ETF inflows of $1.92bn in one week, arguing that the scale and concentration of flows showed a deepening institutional footprint rather than purely retail speculation [T5].
- Broader adoption channels: External analysis cites institutional adoption through ETFs, corporate treasury accumulation, regulatory clarity, and post-halving supply constraints as supportive for potential appreciation [T2].
- Potentially persistent flow support: One source cited daily ETF inflows above $400m and stated that 94% of institutional investors recognized the long-term value of blockchain technology [T2]. Another cited ETF inflows above $500m daily as part of a supportive 2026 setup [T3]. These figures should be treated as source-specific claims, not verified current flow data.
- Product innovation and fee compression: ETF competition, lower costs, and product development can expand the addressable market for Bitcoin exposure [T3].
- Regulatory clarity: Clearer market-structure rules could reduce compliance friction and remove one barrier to institutional crypto ETF adoption [T7].
The bullish case requires persistent regulated inflows, not isolated squeezes. If ETF creations remain large while freely available supply tightens, the scarcity premium can expand. The caveat is concentration: strong headline flows matter less if they are short-lived, issuer-concentrated, or quickly reversed.
Relative Positioning vs Gold and Ethereum
Bitcoin sits between gold and Ethereum in institutional portfolio construction. Versus gold, BTC offers a digital scarcity asset with higher volatility, shorter institutional history, stronger liquidity sensitivity, and potentially higher upside if allocators increase digital store-of-value exposure. One external model explicitly frames Bitcoin’s opportunity as market-share capture from traditional store-of-value assets such as gold [T2].
Versus Ethereum, Bitcoin is the cleaner scarcity and reserve-asset exposure. Ethereum requires a different analytical framework that includes staking economics, transaction fees, application demand, settlement activity, Layer-2 dynamics, and smart-contract ecosystem value. Those data are unavailable in the provided bundle.
| Comparison | Bitcoin Position | Data Limitation |
|---|---|---|
| BTC vs gold | Digital store-of-value candidate with fixed 21m supply and ETF access. | Current gold price, gold market capitalization, and gold/BTC ratio are unavailable. |
| BTC vs Ethereum | Reserve-asset and scarcity exposure; 59.30% BTC dominance supports relative defensive positioning inside crypto. | ETH price, ETH market capitalization, ETH/BTC ratio, ETH ETF flows, staking yield, and network revenue are unavailable. |
| BTC vs broader crypto | Dominant asset by market cap, but relative rotation risk remains. | Altcoin market-cap breakdown and current ETF flow split are unavailable. |
Relative risk is real. Sources note that U.S.-listed BTC and ETH ETF outflows coincided with Bitcoin breaking key support levels, showing that regulated capital can drive downside as well as upside [T1]. The ETF market is also expanding beyond Bitcoin and Ethereum toward other assets, which could dilute Bitcoin’s share of marginal crypto allocations if risk appetite rotates [T7].
Scenario Framework
All USD scenario levels below are third-party reference points, not altii forecasts. We convert them mechanically into EUR using EUR/USD 1.1201. Formula: USD target / 1.1201 = EUR target.
| Scenario | Drivers | Reference Level | EUR Conversion | Move vs €74,513 Spot |
|---|---|---|---|---|
| Bear case | Persistent ETF outflows, higher yields, weaker liquidity, and risk-off positioning. | No robust price floor provided | Unavailable | Unavailable |
| Lower base reference | Mixed macro, continuing adoption, but uneven flows. | $85,000 [T3] | $85,000 / 1.1201 = €75,886 | +1.84% |
| Base-to-constructive | Institutional demand persists, but without aggressive multiple expansion. | $100,000 [T2] | $100,000 / 1.1201 = €89,278 | +19.81% |
| Upper conservative reference | Supportive ETF demand and clearer regulatory backdrop. | $118,000 [T3] | $118,000 / 1.1201 = €105,268 | +41.27% |
| Bull case | Sustained ETF creations, lower macro stress, and higher scarcity premium. | $150,000 [T2] | $150,000 / 1.1201 = €133,917 | +79.72% |
| Blue-sky 2026 reference | Aggressive institutional adoption and store-of-value share capture. | $200,000 [T2] | $200,000 / 1.1201 = €178,555 | +139.63% |
| Longer-term blue-sky reference | Favorable policy, liquidity, and adoption conditions into 2029. | $300,000 to $500,000 [T3] | €267,833 to €446,389 | +259.44% to +499.08% |
The downside scenario should focus on mechanism rather than a false-precision price target. One source reported Bitcoin ETF funds on pace for more than $700m in weekly outflows during a period of market pressure, removing a key source of spot demand [T4]. Another source notes that ETF outflows can amplify volatility even as long-term institutional participation broadens [T8].
Valuation Discussion
Bitcoin valuation does not fit traditional discounted cash-flow or earnings-multiple frameworks because Bitcoin has no issuer cash flows. The main anchors are supply scarcity, market capitalization, liquidity depth, dominance, realized adoption, and marginal flows.
- Supply-adjusted valuation: Market capitalization is €1.498tn. FDV is €1.497740tn. The FDV-to-market-cap ratio is 1.000001, so dilution risk from future issuance is minimal relative to earlier-cycle assets.
- Scarcity valuation: Circulating supply is 20.097m BTC versus 21.000m max. Remaining issuance is 902,632 BTC. This supports the argument that demand changes matter more than new supply growth.
- Dominance valuation: BTC dominance is 59.30%, confirming that Bitcoin remains the crypto reserve asset. Direct market cap divided by provided total crypto market cap gives approximately 59.45%, close to the reported dominance figure, with minor provider or timing differences.
- ATH recovery valuation: A return from €74,513 to the prior ATH of €107,662 implies 44.49% upside before any new high.
- Flow-based valuation: External sources cite flow-based models, including a JPMorgan Chase analysis pointing to a $150,000 peak target for Q4 2026, and more aggressive models built around institutional adoption and store-of-value share capture [T2].
The valuation debate is therefore not whether Bitcoin is cheap on earnings, but whether institutional demand growth can justify a larger monetary premium. ETF flows have become a key marginal pricing mechanism [T1][T8]. If creations persist, Bitcoin can re-rate. If redemptions dominate, scarcity alone may not prevent sharp drawdowns.
Risks
- ETF-flow reversal risk: ETF outflows remove a visible source of spot demand [T4]. Record outflows from U.S.-listed BTC and ETH ETFs reportedly coincided with Bitcoin breaking support levels and retesting lower ranges [T1].
- Rate sensitivity: Higher yields can make institutional buyers more selective because government debt offers a stronger return profile [T4]. This is especially relevant with Euro Area AAA 10-year yields at 3.51%.
- Macro-liquidity risk: Bitcoin can trade like both a crypto asset and a macro-liquidity asset, reacting to exchange-level positioning and broader financial conditions [T6].
- Volatility despite institutionalization: Institutional participation can support rallies, but it can also amplify volatility when flows reverse [T8].
- Regulatory risk: Regulation remains a major wildcard. Clear rules could support adoption, but delay, fragmentation, or adverse legislation could reduce allocation willingness [T7].
- Relative-rotation risk: Capital can rotate into Ethereum or newer altcoin ETF products, potentially weakening BTC dominance.
- Performance risk: BTC is still -27.89% over one year and -2.68% over seven days, despite +7.71% over 30 days and +20.87% over 200 days.
- Data risk: Current ETF holdings, net flows, derivatives positioning, realized volatility, exchange balances, and on-chain liquidity metrics are unavailable in the bundle.
The key bearish setup is a combination of rising yields, ETF redemptions, and declining liquidity. In that environment, Bitcoin may trade less like a defensive store of value and more like a high-beta macro asset.
Appendix
Data and Methodology Notes
- Report generated at: 2026-10-13T04:15:26.832459Z.
- BTC market data retrieved at: 2026-10-13T04:15:08.640017Z.
- News data retrieved at: 2026-10-13T04:15:14.014817Z.
- Market overview data points retrieved between 2026-10-13T04:15:14.824421Z and 2026-10-13T04:15:26.825179Z.
- Quote currency: EUR.
- USD scenario conversion assumption: EUR/USD 1.1201. Formula: USD price target / 1.1201 = EUR equivalent.
- Third-party USD targets are presented as external scenarios, not altii forecasts.
- Several Tavily sources lack published_at timestamps. They are used as thematic support, not as time-stamped verification of current market flows.
- Live gold price, gold market capitalization, Ethereum price, Ethereum market capitalization, ETH/BTC ratio, and ETH ETF flow data are unavailable in the provided bundle.
Core Calculations
- Volume-to-market-cap: €28,419,753,107 / €1,497,737,539,292 = 1.90%.
- Circulating supply as share of max supply: 20,097,368 / 21,000,000 = 95.70%.
- Remaining issuance: 21,000,000 – 20,097,368 = 902,632 BTC, or 4.30% of max supply.
- FDV-to-market-cap: €1,497,739,625,966 / €1,497,737,539,292 = 1.000001.
- Upside to ATH: (€107,662 – €74,513) / €74,513 = 44.49%.
- 24h range as share of spot: (€75,391 – €72,515) / €74,513 = 3.86%.
- Direct BTC market-cap share of provided total crypto market cap: €1,497,737,539,292 / €2,519,128,605,399 = 59.45%, versus reported BTC dominance of 59.30%.
Sources
- [T1] Crypto Market 2025: Year-End Review & Expert Insights — TradingView News
- [T2] Bitcoin Price Prediction 2026: Institutional Adoption & ETF Impact Analysis
- [T3] menu
- [T4] US Treasury yields surge to new highs as liquidity tightens, pushing Bitcoin back below $82,000 resistance
- [T5] Bitcoin ETF Inflows Surge to $1.92 Billion Last Week
- [T6] Bitcoin Tests $70,000 As Intraday Squeeze Lifts Market | Cryptocurrency Market News liquidations | CryptoRank.io
- [T7] Crypto ETFs Enter a New Phase in September: Here’s What Investors Should Watch – Bitcoin Foundation
- [T8] Bitcoin Outlook: ETF Outflows, Institutional Adoption & Price Forecast 2026 | IG South Africa
This report is AI-generated, for informational purposes only, and does not constitute investment advice, investment research, an offer, or a solicitation to buy or sell any financial instrument or crypto asset.
Important Note / Wichtiger Hinweis:
EN: This report may have been generated using AI. It processes data from publicly available sources. The content is provided for informational purposes only.DE: Dieser Bericht kann mithilfe von KI erstellt worden sein. Dabei werden Daten aus öffentlich zugänglichen Quellen verarbeitet. Die Inhalte dienen ausschließlich Informationszwecken.
* DE: Die ergänzenden Inhalte können KI-generiert sein. EN: The additional content may be AI-generated.