
Watch the video
This player shows only the Bitcoin chapter of the daily altii market briefing. Watch the full video on tube.altii.de.
Key Data Snapshot
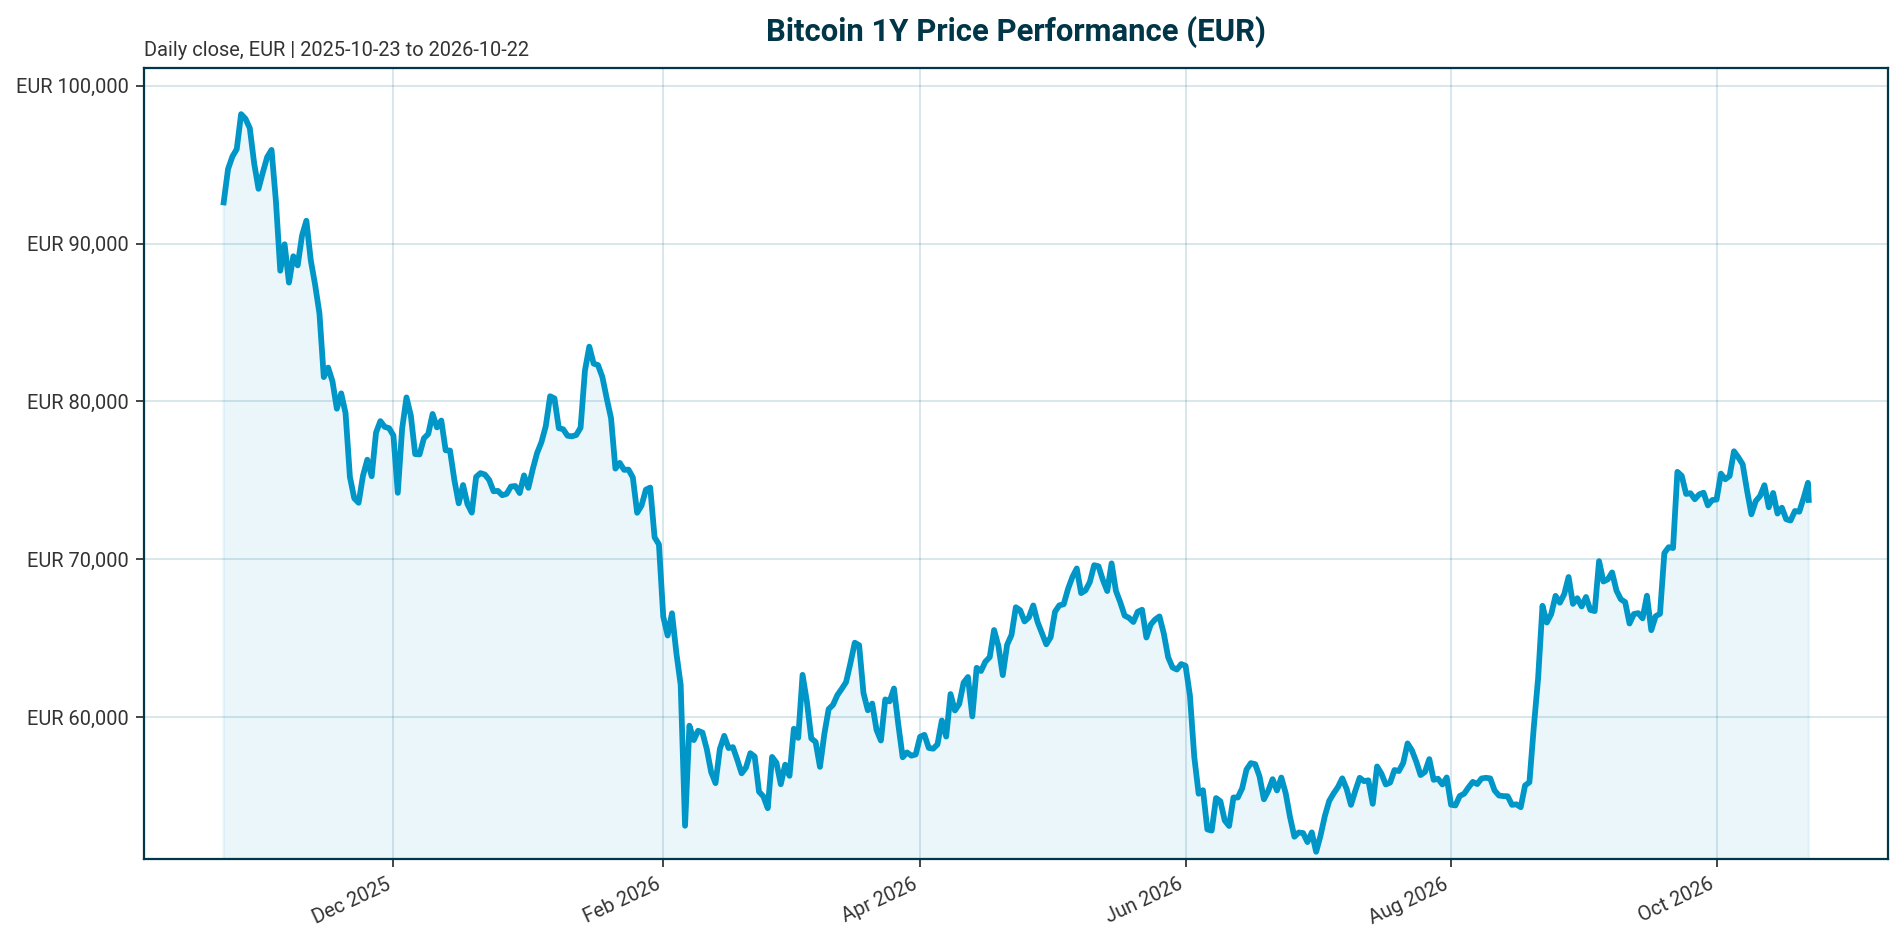
| Metric | Value | Comment |
|---|---|---|
| BTC/EUR price | €73,681 | Market data retrieved 2026-10-22 04:15:08 UTC |
| Market cap | €1,480,893,096,963 | Rank 1 crypto asset |
| 24h volume | €31,562,860,640 | Volume/market cap = €31.56bn / €1,480.89bn = 2.13% |
| BTC dominance | 59.53% | Primary institutional crypto allocation vehicle |
| Performance | 1h +0.02%, 24h -0.01%, 7d +1.70%, 30d -3.33%, 200d +23.68%, 1y -23.45% | Mixed near-term trend, positive medium-term impulse, negative 1-year return |
| 24h range | €73,440 to €75,433 | Range = (€75,433 – €73,440) / €73,681 = 2.70% |
| All-time high | €107,662 on 2025-10-06 | Current price/ATH = €73,681 / €107,662 = 68.44%, drawdown -31.56% |
| Supply | 20,101,715 BTC circulating vs 21,000,000 max | Issued supply = 20,101,715 / 21,000,000 = 95.72%; remaining supply = 898,285 BTC |
Bitcoin trades in consolidation rather than in clear trend acceleration. The 24h move is effectively flat at -0.01449%, the 7-day move is positive at +1.7027%, the 30-day move is negative at -3.3338%, and the 200-day move remains constructive at +23.6833%. That combination supports a base-case view of range-bound to moderately constructive price action, not a confirmed breakout.
Market Setup
The broader market backdrop is neutral to negative. Equity momentum is moderately negative, DACH equities are outperforming global indicators, euro yields are mixed, and FX signals are mixed. DACH indicators average +0.96% over 5 days versus -1.86% for global equity indicators. The euro-area AAA 10-year yield is 3.44%, down 7.1 bp over 5 days, and EUR/USD is 1.1230, down 0.08% over 5 days. This context is not hostile enough to invalidate Bitcoin’s structural case, but it does not provide a strong risk-on tailwind.
For BTC/EUR, the relevant marginal driver is no longer only crypto-native momentum. ETF demand can strengthen when risk appetite and financial conditions improve, while higher yields, a stronger dollar or tighter-policy expectations can weaken Bitcoin demand [T6]. Higher yields can also make institutional buyers more selective, and ETF outflows remove a visible source of spot demand [T5].
The setup therefore remains two-sided. Lower yields and improving liquidity would help Bitcoin’s flow-sensitive valuation. A renewed rise in yields or a deterioration in risk sentiment would likely cap rallies, even if the long-term adoption narrative remains intact.
Investment Thesis
Bitcoin is increasingly priced as a flow-driven macro asset rather than a purely narrative-led crypto asset. Market-structure commentary describes 2025 as the first full year in which crypto operated in an ETF- and macro-led regime, with ETF flows and monetary-policy repricing becoming dominant drivers of sentiment [T1].
The institutional thesis rests on three pillars:
- Regulated access: Spot ETFs, corporate treasuries and regulated investment vehicles have made BTC easier to integrate into institutional workflows [T1].
- Systematic demand: BTC demand is moving from episodic speculation toward rules-based flows across wealth management, institutional finance and potentially retirement channels [T4].
- Scarce supply: 95.72% of the maximum 21 million BTC supply has already been issued, leaving 898,285 BTC unissued.
The bullish version of the thesis is that broader distribution through wealth platforms and retirement channels converts Bitcoin into a persistent allocation line item. The bearish version is that the same ETF infrastructure can transmit outflows rapidly when liquidity tightens, turning regulated access into a downside channel [T4].
Bullish Drivers
- ETF-anchored demand: U.S. spot Bitcoin ETFs and regulated vehicles have become central to institutional access. Sustained multi-week inflows across providers would be stronger evidence of a new accumulation phase than a single large inflow day [T7].
- Potential retirement-channel expansion: The largest potential extension of ETF-anchored demand lies in the $22 trillion U.S. 401(k) and Defined Contribution system. A 1% allocation could generate $90 billion to $130 billion of steady inflows, according to the cited 21Shares analysis [T4].
- Supply absorption: Net new BTC supply is estimated at about 160,000 BTC per year, small relative to ETF holdings above 1 million BTC equivalent [T4]. At the current BTC/EUR price, 160,000 BTC equals approximately €11.79 billion.
- Institutional supply structure: By end-2025, 6.7 million BTC reportedly sat across ETFs, exchanges and treasuries, supporting the view that Bitcoin has entered an institutional supply era [T1].
- Lower volatility profile: A cited Glassnode x Fasanara report noted that Bitcoin volatility declined from 84% to 43%, which may improve institutional suitability, although it may also increase sensitivity to macro flows [T1].
The most constructive near-term signal would be broad, sustained ETF inflows combined with easier financial conditions. A single inflow event is insufficient. One source noted that U.S. spot Bitcoin ETFs attracted $526.7 million on October 19, led by BlackRock’s IBIT at $665.2 million, but also warned that other funds recorded withdrawals and that one strong session does not establish a durable trend [T3].
Relative Positioning vs Gold and Ethereum
Versus gold: Bitcoin can be framed as a scarce, non-sovereign digital asset with institutional ETF access. However, current gold price, gold performance, gold volatility, gold ETF flows and gold valuation data are unavailable in the bundle. A quantitative BTC-versus-gold spread, beta or relative-value conclusion is therefore unavailable.
Versus Ethereum: Bitcoin remains the dominant crypto asset in the supplied data, with market-cap rank 1 and 59.53% crypto-market dominance. Current Ethereum price, Ethereum market cap, ETH/BTC ratio and Ethereum performance data are unavailable in the bundle. The available source commentary still supports BTC as the primary institutional crypto access point: Bitcoin showed relative resilience as institutional flows returned, while Ethereum and several altcoins were weaker during the cited period [T3]. Ether ETFs recorded $103.3 million of net outflows, their fourth consecutive withdrawal session in that source’s window [T3].
The allocation implication is balanced. BTC remains the cleaner institutional crypto proxy today. Ethereum offers potential upside if regulated access broadens and ETF demand improves, but available data do not support a current quantitative rotation signal.
Scenario Framework
| Scenario | Drivers | BTC/EUR implication | Evidence to monitor |
|---|---|---|---|
| Bull case | Sustained ETF inflows, lower yields, improving risk appetite, broader wealth and retirement-channel distribution | BTC/EUR can re-rate toward prior cycle highs if flow demand overwhelms new issuance | Multi-week ETF inflows across providers, stronger spot volumes, improving global equity breadth |
| Base case | Institutional demand persists, but macro conditions remain mixed and ETF flows are uneven | Range-bound to moderately constructive price action around current levels | Price stability above recent lows, no persistent ETF outflow trend, neutral rates backdrop |
| Bear case | ETF outflows, tighter liquidity, higher yields, weaker risk sentiment or leverage unwind | BTC/EUR retests lower ranges despite long-term adoption progress | Weekly ETF outflows, rising real yields, stronger dollar dynamics, declining market depth |
The current price of €73,681 sits 31.56% below the all-time high, up 23.68% over 200 days but down 23.45% over 1 year. That profile argues against both complacency and capitulation. Fair value is increasingly determined by flows, liquidity and positioning rather than ideology or issuance alone [T4]. ETF inflows can support price when demand exceeds selling pressure, but rates, leverage, liquidity, sentiment and regulation remain material drivers [T6].
Valuation Discussion
Bitcoin has no supplied cash-flow, earnings or dividend data. An equity-style discounted cash-flow model is therefore inappropriate. The relevant valuation framework is flow absorption, scarcity, holder reallocation and macro discounting.
Supply math:
- Circulating supply = 20,101,715 BTC.
- Maximum supply = 21,000,000 BTC.
- Issued supply = 20,101,715 / 21,000,000 = 95.72%.
- Remaining supply = 21,000,000 – 20,101,715 = 898,285 BTC.
- Estimated annual new supply = 160,000 BTC [T4].
- Annual new-supply value = 160,000 x €73,681 = €11.79 billion.
Illustrative retirement-channel demand: The cited 401(k)/Defined Contribution scenario estimates $90 billion to $130 billion of potential inflows from a 1% allocation [T4]. Using EUR/USD of 1.1230:
- $90bn / 1.1230 = €80.14bn.
- $130bn / 1.1230 = €115.76bn.
- €80.14bn / €73,681 = approximately 1.09 million BTC.
- €115.76bn / €73,681 = approximately 1.57 million BTC.
- Demand versus annual new-supply value = €80.14bn to €115.76bn / €11.79bn = 6.8x to 9.8x.
This is not a forecast. It is a sensitivity exercise. It shows why even modest institutional allocation percentages can matter when new issuance is limited. It also shows why holder reallocation matters more than mining supply. ETFs already hold more than 1 million BTC equivalent according to the cited 21Shares analysis [T4], while a broader category of ETFs, exchanges and treasuries reportedly held 6.7 million BTC by end-2025 [T1].
The valuation constraint is macro. Strong structural demand can be offset by restrictive liquidity, higher-yield alternatives or forced ETF selling in a tight-liquidity environment [T4][T5].
Risks
- Flow reversal risk: ETF flows can swing from heavy buying to heavy selling within weeks, and flows are only one part of the price equation [T6].
- Macro risk: Higher yields can make institutional buyers more selective, while ETF outflows remove a key source of spot demand [T5].
- False-confirmation risk: A single large inflow day or provider-concentrated inflow does not confirm a durable accumulation phase [T3].
- Liquidity transmission risk: In a tight-liquidity environment, ETFs can become marginal sellers rather than marginal buyers [T4].
- Drawdown risk: BTC remains 31.56% below its all-time high and is down 23.45% over 1 year despite a +23.68% 200-day move.
- Benchmark-data risk: Current gold and Ethereum market data are unavailable in the bundle, limiting relative-value conclusions.
- Regulatory and market-structure risk: Regulation, leverage and sentiment remain material price drivers [T6]. Thin liquidity and regulatory uncertainty can also limit broader institutional crypto access beyond BTC and ETH [T7].
- Data-quality risk: Several Tavily source summaries are undated. ETF-flow figures refer to different windows and should not be combined into a continuous time series.
Appendix
Report parameters
- Asset: Bitcoin (BTC).
- Quote currency: EUR.
- Report generated: 2026-10-22 04:15:27 UTC.
- Market data retrieved: 2026-10-22 04:15:08 UTC.
- Market-overview data include equities, euro-area rates and EUR FX pairs.
- EUR/USD used for conversion: 1.1230 as of 2026-10-22.
Calculation notes
- 24h volume/market cap = €31,562,860,640 / €1,480,893,096,963 = 2.13%.
- Issued supply = 20,101,715 / 21,000,000 = 95.72%.
- Remaining supply = 21,000,000 – 20,101,715 = 898,285 BTC.
- Price as percentage of ATH = €73,681 / €107,662 = 68.44%; ATH drawdown = -31.56%.
- 24h range percentage = (€75,433 – €73,440) / €73,681 = 2.70%.
- Distance from 24h high = (€73,681 / €75,433 – 1) = -2.32%.
- Distance from 24h low = (€73,681 / €73,440 – 1) = +0.33%.
- Annual new-supply value = 160,000 BTC x €73,681 = €11.79bn.
- $90bn / 1.1230 = €80.14bn; $130bn / 1.1230 = €115.76bn.
- €80.14bn / €73,681 = approximately 1.09mn BTC; €115.76bn / €73,681 = approximately 1.57mn BTC.
- Illustrative retirement-channel inflow versus annual new-supply value = €80.14bn to €115.76bn / €11.79bn = 6.8x to 9.8x.
- Supplied BTC dominance is 59.53%. Using supplied BTC market cap and total crypto market cap produces a slightly different share due to vendor timing differences, so the report uses the supplied dominance field.
Unavailable metrics
- Current gold price, performance, ETF flows, volatility and valuation data: unavailable.
- Current Ethereum price, market cap, performance, ETH/BTC ratio and Ethereum volatility: unavailable.
- On-chain metrics such as realized cap, MVRV, exchange balances and long-term-holder supply: unavailable.
- Current ETF flow time series by provider and date: unavailable in structured form.
- Regulatory jurisdiction-by-jurisdiction analysis: unavailable.
Sources
- [T1] Crypto Market 2025: Year-End Review & Expert Insights – TradingView News
- [T3] BITCOIN HOLDS THE LINE, ALTCOINS FALTER AS CRYPTO ENTERS A NEW INSTITUTIONAL CYCLE – MarinaTimes NG.
- [T4] Bitcoin 2026 outlook: ETF gravity vs. Macro ceiling
- [T5] US Treasury yields surge to new highs as liquidity tightens, pushing Bitcoin back below $82,000 resistance
- [T6] Bitcoin ETF Inflows: How Institutional Money Affects BTC Price
- [T7] BlackRock Is Buying the Dip: What Its $1 Billion Bitcoin Bet Says About the Crypto Market – Bitcoin Foundation
This report is AI-generated, for informational purposes only, and not investment advice. It does not constitute a recommendation to buy, sell or hold Bitcoin or any related instrument. Investors should conduct independent due diligence and consider their own risk tolerance, liquidity needs and regulatory constraints.
Important Note / Wichtiger Hinweis:
EN: This report may have been generated using AI. It processes data from publicly available sources. The content is provided for informational purposes only.DE: Dieser Bericht kann mithilfe von KI erstellt worden sein. Dabei werden Daten aus öffentlich zugänglichen Quellen verarbeitet. Die Inhalte dienen ausschließlich Informationszwecken.
* DE: Die ergänzenden Inhalte können KI-generiert sein. EN: The additional content may be AI-generated.