
Watch the video
This player shows only the Bitcoin chapter of the daily altii market briefing. Watch the full video on tube.altii.de.
Key Data Snapshot
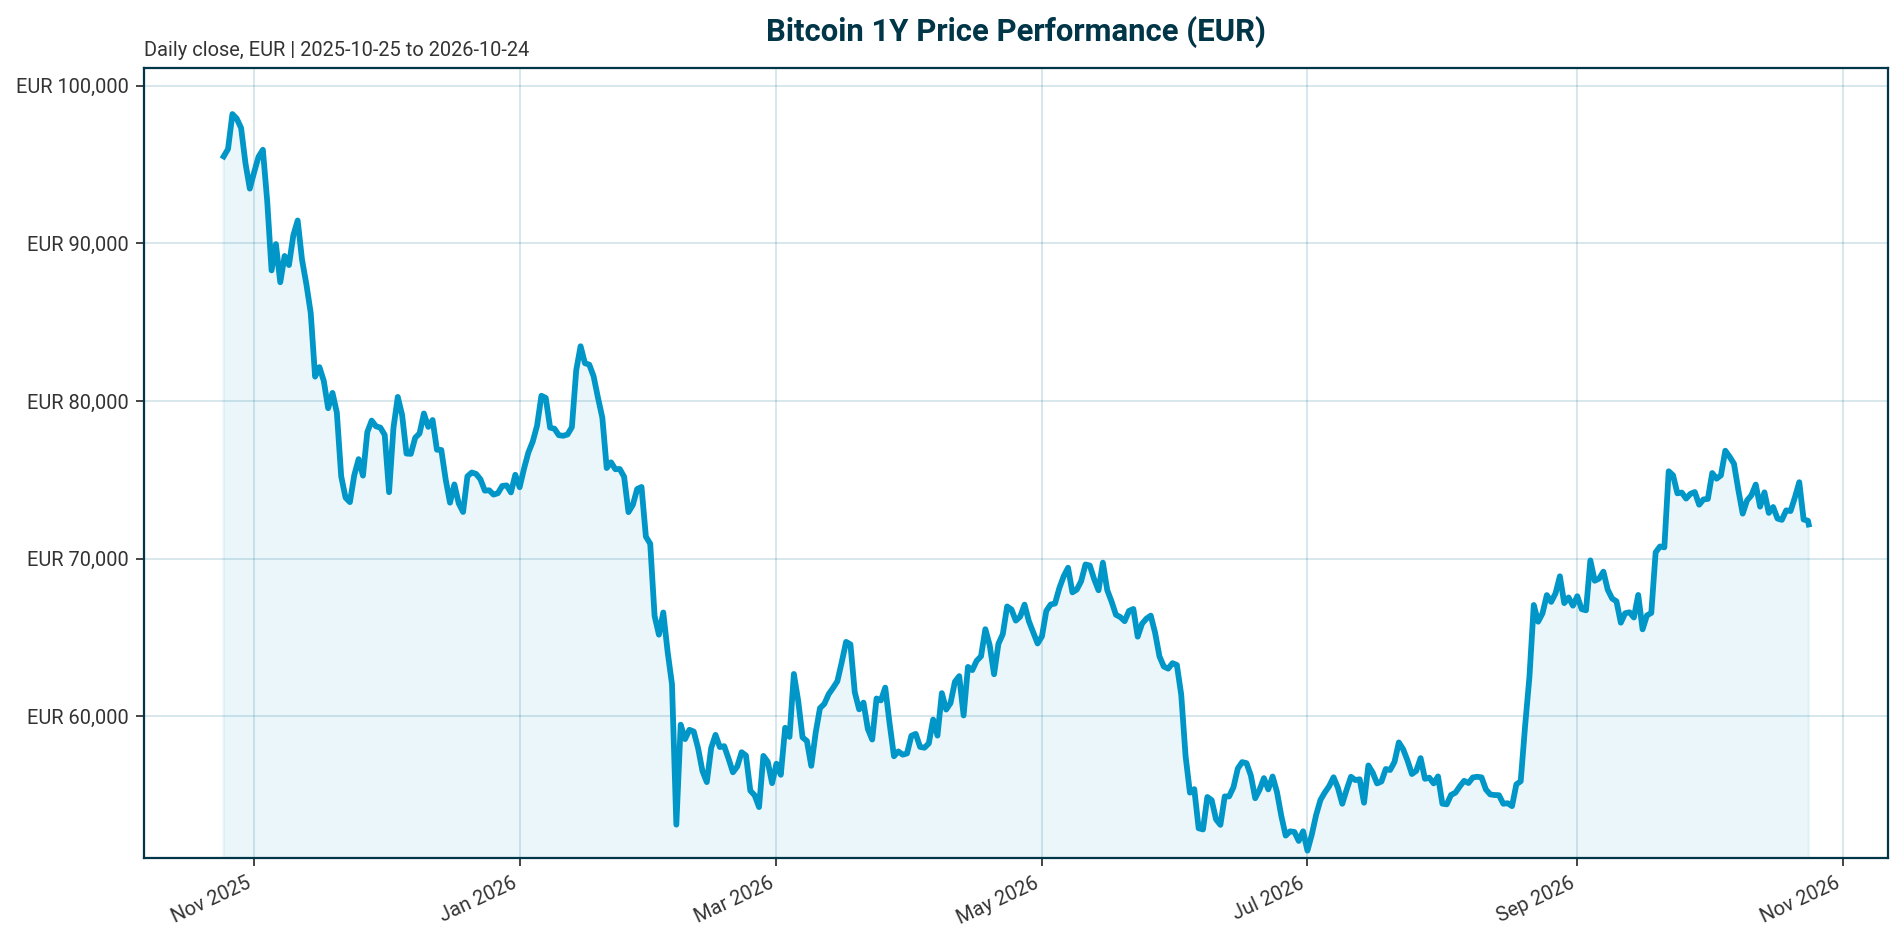
Bitcoin (BTC) trades at EUR 72,166 as of 24 October 2026, 04:15 UTC. The asset is in a corrective phase within a longer-term uptrend: positive over 200 days but negative across shorter horizons and down 26.89% over one year.
| Metric | Value |
|---|---|
| Price (EUR) | 72,166 |
| 24h range (EUR) | 71,823 to 73,148 |
| 24h change | -0.89% |
| 7d / 14d / 30d change | -0.64% / -2.05% / -4.13% |
| 200d / 1y change | +18.00% / -26.89% |
| Market cap (EUR) | 1,450.7 billion (rank 1) |
| Fully diluted valuation (EUR) | 1,450.7 billion |
| 24h volume (EUR) | 20.0 billion |
| Circulating / max supply | 20,102,671 / 21,000,000 (95.73% issued) |
| All-time high (EUR) | 107,662 on 2025-10-06; current price -32.97% below |
| BTC dominance | 59.48% of EUR 2,437.0 billion total crypto market cap |
| BTC share of total crypto volume | 34.44% (20.0bn / 58.1bn) |
Calculation: supply issued = 20,102,671 / 21,000,000 = 95.73%. Volume share = 20,006,911,993 / 58,099,630,891 = 34.44%. Because market cap equals FDV and nearly all supply is issued, marginal demand rather than issuance is the dominant price driver.
Market Setup
The cross-asset backdrop is defensive. Risk sentiment is negative and equity momentum is broadly negative, with the DAX the strongest 5-day performer at -0.55% and the Hang Seng the weakest at -4.52%. DACH indicators average -2.09% over 5 days versus -2.65% for global equity indicators, so the region is broadly in line with global peers. Euro area AAA yields are mixed: the 10Y sits at 3.38% after a 6.0 bp drop over 5 days, the 2Y at 3.01%, leaving a 10Y-2Y spread of 37.7 bp. FX is mixed, with EUR/USD at 1.1222 (-0.05% over 5 days, -4.49% YTD). This context is subordinate to the Bitcoin-specific flow picture below.
Policy remains restrictive. The US Federal Funds target range is 3.75% to 4.00% as of 2026-10-23, following a 25 bp hike effective 2026-09-17. The ECB deposit facility rate is 2.50% as of 2026-10-24, following a 25 bp hike effective 2026-09-16. The Fed target range sits above the ECB deposit rate, leaving US policy the tighter of the two. According to [T1] from July 2026, the Fed under Chair Kevin Warsh was expected to hold rates through Q3; the subsequent September hike shows policy has not been static since that expectation was published, so it should be treated as a dated scenario input rather than a current commitment. According to [T6], US Treasury yields surged to new highs as liquidity tightened, pushing Bitcoin back below USD 82,000 resistance. According to [T4], September US PPI accelerated to 6.3% YoY and 1.3% MoM, the strongest monthly increase since March 2022, complicating any easing narrative.
Investment Thesis
Bitcoin has transitioned into a flow-driven macro asset whose fair value is set by the tension between expanding rules-based institutional demand and restrictive liquidity. According to [T5], ETFs are now the dominant institutional trading channel, and demand has moved from episodic speculation to systematic, rules-driven flows across wealth management and, prospectively, retirement channels. According to [T2] from the 2025 year-end review, 6.7 million BTC sat across ETFs, exchanges and treasuries per Glassnode, and realized volatility fell from 84% to 43% per the Glassnode x Fasanara report, supporting treatment as an allocatable institutional line item.
Supply dynamics reinforce the demand-side framing. Net new mining supply of roughly 160,000 BTC per year is small against ETF holdings above 1 million BTC equivalent, so holder reallocation matters more than issuance [T5]. At the current price, the structural question is whether the ETF bid broadens or, in a tight-liquidity environment, the same channel becomes a forced seller [T5]. According to [T8], ETF issuers must acquire physical Bitcoin to back newly created shares, but institutional participation can amplify volatility in both directions.
The near-term catalyst map is two-sided. The CLARITY Act would establish a federal market-structure framework in the US and could unlock broader institutional participation if passed [T1]. In Asia, adoption is shifting toward tokenization and stablecoin infrastructure, with Hong Kong’s Stablecoins Ordinance as the template, meaning pure bitcoin exposure plays a smaller strategic role there than in North America and Europe [T1]. At EUR 72,166, 32.97% below the October 2025 high but 18.00% higher over 200 days, the thesis is constructive on structure, conditional on flows, and capped by macro.
Bullish Drivers
- Retirement-channel demand architecture. A 1% allocation of the USD 22 trillion US 401(k) and Defined Contribution system would generate USD 90 to 130 billion of steady, rules-based inflows, on par with the entire current spot BTC ETF market size [T5]. Indicatively, at EUR/USD 1.1222 that is roughly EUR 80 to 116 billion.
- Supply discipline. 95.73% of the 21 million maximum supply is issued, and mining adds only about 160,000 BTC per year [T5]. Scarcity dynamics favor demand-side expansion as the marginal price setter.
- Institutional depth. 6.7 million BTC held across ETFs, exchanges and treasuries per Glassnode, with volatility declining from 84% to 43%, marks 2025 as Bitcoin’s institutional supply era [T2].
- Flow evidence, though episodic. US spot Bitcoin ETFs attracted USD 526.7 million on October 19, the strongest daily inflow since September 22, led by BlackRock’s IBIT at USD 665.2 million [T4]. Whale wallets holding 1,000 BTC or more accumulated into recent fear, suggesting a provisional floor [T5].
- Regulatory catalysts pending. The CLARITY Act would create a federal market-structure framework and potentially unlock broader institutional participation if passed [T1].
- Third-party projections. According to [T3], JPMorgan’s flow-based model projects a USD 150,000 peak for Q4 2026 with 72% confidence, and Ark Invest maintains a USD 200,000 2026 milestone and USD 1,000,000 by 2030. These are dated analyst projections, not house forecasts, and [T3] also cites daily ETF inflows consistently exceeding USD 400 million, a claim that conflicts with the outflow weeks documented in [T6] and [T8] and should be treated as contested.
Relative Positioning vs Gold and Ethereum
Gold and Ethereum spot prices are not in the dataset, so direct price comparison is unavailable; positioning must be assessed through dominance and flow data, which we flag as a limitation.
Versus Ethereum: BTC dominance stands at 59.48% within a EUR 2,437 billion total crypto market cap, and the flow divergence is stark. According to [T4], BTC ETFs took in USD 526.7 million on October 19 while Ether ETFs recorded USD 103.3 million of net outflows, a fourth consecutive session of withdrawals. BTC showed relative resilience around USD 81,000 to 83,000 while ETH and major altcoins remained weaker [T4]. Continued divergence would support dominance rising further; a reversal would signal broad risk appetite returning to the alt complex.
Versus gold: Ark Invest frames BTC as capturing market share from traditional store-of-value assets like gold [T3]. With euro AAA 10Y yields at 3.38% and US yields at highs per [T6], non-yielding defensive allocations compete within the same bucket, and elevated real yields favor the asset that at least offers a yield-bearing alternative in government bonds. A Fed easing cycle would favor both, with BTC the higher-beta expression. In Asia, the competitive set differs: tokenization and stablecoin infrastructure, not pure bitcoin ETFs, are the institutional entry points [T1].
Scenario Framework
All scenarios are assumptions, not forecasts. Technical levels from sources are USD-denominated; EUR equivalents are indicative at EUR/USD 1.1222.
- Bull scenario (assumption): The Fed pivots to easing sooner than the Q3-hold expectation of July 2026 [T1], the CLARITY Act passes, and ETF inflows broaden across wealth and retirement platforms. BTC reclaims the USD 84,000 confirmation level cited in [T4] (about EUR 74,870) and targets the USD 100,000 to 150,000 analyst range from [T3], roughly EUR 89,100 to 133,670, taking the price toward or past the EUR 107,662 ATH. Reclaiming the ATH requires +49.17% from the current price.
- Base scenario (assumption): The Fed holds through Q3 per the dated [T1] expectation, and flows oscillate between outflow weeks exceeding USD 700 million [T6] and strong single days such as October 19 [T4]. BTC ranges below USD 84,000, with EUR price consolidating in the low-to-mid 70,000s while dominance grinds higher on relative ETH weakness.
- Bear scenario (assumption): Liquidity tightens further, yields stay at highs [T6], and ETF outflows accelerate to the point where ETFs become forced sellers [T5]. The whale-supported floor breaks and BTC retests the levels seen in the 2025 Q4 episode, when record outflows coincided with a break of USD 98,000 support and a retest of the low USD 90,000 range [T2]. In EUR terms this implies a deeper drawdown below current levels; the EUR 71,823 24h low marks the immediate reference.
Valuation Discussion
Market cap equals FDV at EUR 1,450.7 billion because 95.73% of maximum supply is issued, so there is no meaningful dilution overhang. Valuation therefore rests on demand models rather than supply schedules.
Flow-based framing: Per [T5], fair value is determined by the tension between expanding distribution into wealth and retirement platforms and the macro forces governing risk appetite and real rates. The 401(k) demand vector of USD 90 to 130 billion at a 1% allocation [T5] is the largest identified incremental source, indicatively EUR 80 to 116 billion.
Third-party models: According to [T3], JPMorgan’s flow-based valuation model projects a USD 150,000 peak with 72% confidence targeting Q4 2026, indicatively EUR 133,670 at EUR/USD 1.1222. Ark Invest’s model, based on gold market-share capture, projects USD 200,000 for 2026 (indicatively EUR 178,220) and USD 1,000,000 by 2030. These are dated projections from a promotional third-party source whose flow claims conflict with observed outflow data [T6, T8]; weight accordingly.
Volatility-adjusted framing: The decline in volatility from 84% to 43% per the Glassnode x Fasanara report [T2] supports the institutional-allocation premium embedded in current valuation. A re-expansion of the volatility regime would undermine that premium. On the rates side, higher government bond yields have made institutional buyers more selective because government debt offers a stronger return profile [T6], which directly compresses the valuation multiple the market will pay for a non-yielding asset.
Recovery math: Reclaiming the EUR 107,662 ATH requires (107,662 / 72,166 – 1) = +49.17%. The JPMorgan-implied EUR target of roughly 133,670 requires +85.2% from current levels.
Risks
- Restrictive policy path. The Fed funds target of 3.75% to 4.00% follows a September hike, and the ECB deposit rate of 2.50% also follows a September hike. A further hike would extend the restrictive regime and pressure the ETF bid. Inflation complicates easing: September US PPI at 6.3% YoY was the strongest monthly increase since March 2022 [T4].
- ETF flow reversal and forced-selling mechanics. Weekly ETF outflows exceeded USD 700 million in one recent stretch, the largest retreat since late January [T6]. In tight liquidity, ETFs can become forced sellers, and whale accumulation creates a future overhang if macro deteriorates [T5].
- Demand concentration. IBIT alone received USD 665.2 million on October 19 while other funds saw withdrawals; one strong session does not establish a durable accumulation trend [T4].
- Treasury-company financing stress. Strategy, formerly MicroStrategy, has reportedly temporarily slowed purchases amid weaker financing conditions and falling ETF demand [T8], removing a previously reliable structural buyer.
- Regulatory non-delivery. CLARITY Act passage is explicitly conditional (“if passed”) [T1]. Failure removes the nearest regulatory catalyst and leaves macro as the sole driver.
- Two-sided institutional amplification. Institutional participation can amplify volatility as easily as it supports rallies [T8].
- Data limitations. Gold and ETH spot prices are not in the dataset, no on-chain metrics (MVRV, realized price, exchange flows) are available, and ETF flow data points are episodic snapshots from different periods rather than an aggregate series.
Appendix
Methodology and provenance. Market data was retrieved 2026-10-24 04:15 UTC from a CoinGecko-style feed; market overview data is as of the 2026-10-23 close, with FX as of 2026-10-24 and the euro area AAA yield curve as of 2026-10-22 (ECB). Policy rates come from the authoritative policy rates block: Fed funds target range 3.75% to 4.00% as of 2026-10-23 (last change: 25 bp hike effective 2026-09-17) and ECB deposit facility rate 2.50% as of 2026-10-24 (last change: 25 bp hike effective 2026-09-16). Several Tavily sources lack publication dates; where dating is inferred from content (for example [T1] is a July 2026 Q2 review and [T4] references October 19 flows), this is flagged inline. USD-denominated source figures are converted at EUR/USD 1.1222 and labeled as indicative.
Glossary. BTC dominance: Bitcoin’s share of total crypto market capitalization. FDV: fully diluted valuation, price multiplied by maximum supply. ETF net flows: creations minus redemptions in exchange-traded funds; issuers must buy or sell physical BTC to back shares. DAT: digital asset treasury structure, a corporate vehicle holding crypto on balance sheet. Whale wallets: addresses holding 1,000 BTC or more. Euro area AAA 10Y-2Y spread: difference between AAA-rated 10-year and 2-year euro government yields, at 37.7 bp.
Sources
- [T1] Q2 2026 Digital Asset Review. CoinDesk Indices
- [T2] Crypto Market 2025: Year-End Review & Expert Insights. TradingView News
- [T3] Bitcoin Price Prediction 2026: Institutional Adoption & ETF Impact Analysis. Intellectia
- [T4] Bitcoin Holds the Line, Altcoins Falter as Crypto Enters a New Institutional Cycle. MarinaTimes NG
- [T5] Bitcoin 2026 outlook: ETF gravity vs. Macro ceiling. 21Shares
- [T6] US Treasury yields surge to new highs as liquidity tightens, pushing Bitcoin back below $82,000 resistance. CryptoSlate
- [T7] Bitcoin ETFs Absorb $134.4M as Macro Backdrop Improves. LinkedIn (Elevano Capital)
- [T8] Bitcoin Outlook: ETF Outflows, Institutional Adoption & Price Forecast 2026. IG South Africa
Disclaimer. This report is AI-generated, for informational purposes only, and does not constitute investment advice. Scenarios and probability framings are labeled assumptions, and all third-party price targets are dated analyst projections rather than house forecasts. Digital assets are volatile and may lose substantial value; readers should conduct their own due diligence and consult a licensed advisor before making investment decisions.
Important Note / Wichtiger Hinweis:
EN: This report may have been generated using AI. It processes data from publicly available sources. The content is provided for informational purposes only.DE: Dieser Bericht kann mithilfe von KI erstellt worden sein. Dabei werden Daten aus öffentlich zugänglichen Quellen verarbeitet. Die Inhalte dienen ausschließlich Informationszwecken.
* DE: Die ergänzenden Inhalte können KI-generiert sein. EN: The additional content may be AI-generated.