
Watch the video
This player shows only the Bitcoin chapter of the daily altii market briefing. Watch the full video on tube.altii.de.
Key Data Snapshot
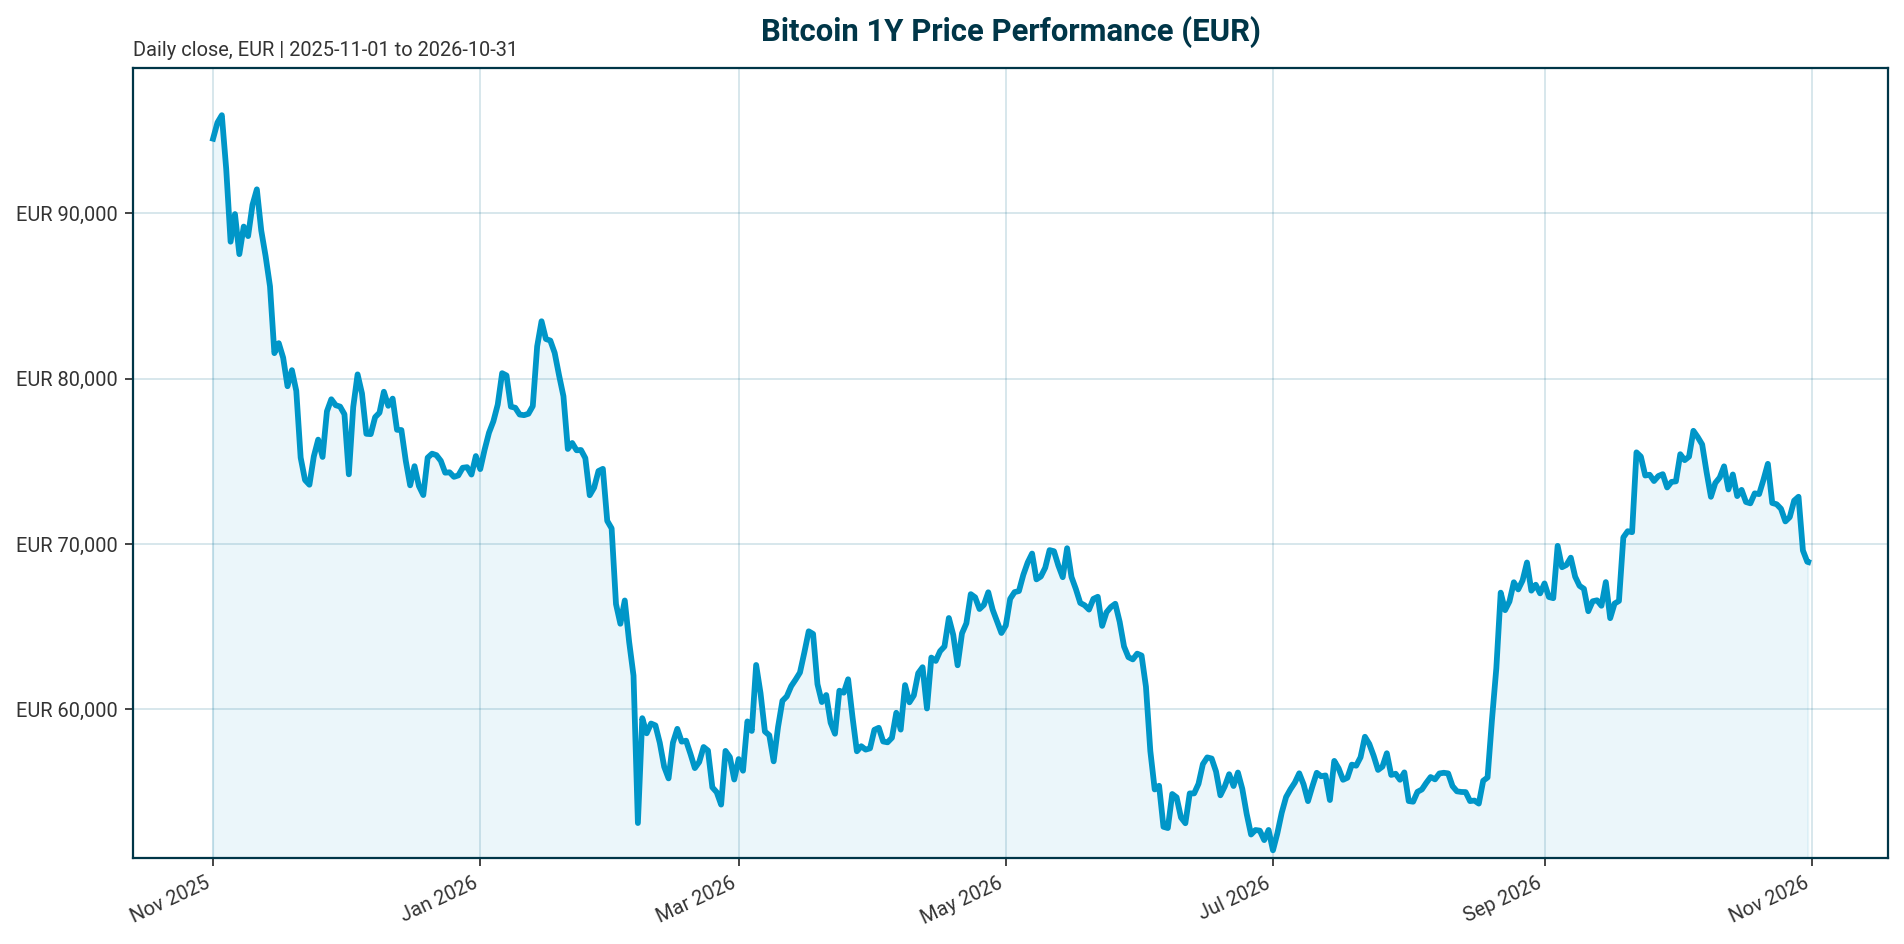
Bitcoin (BTC) trades at EUR 68,939 as of 31 October 2026, down 1.77% over 24 hours and 7.95% over 30 days. The asset ranks first by market capitalisation at EUR 1.386 trillion and holds 59.22% of the total crypto market, which stands at EUR 2.338 trillion.
| Metric | Value |
|---|---|
| Price (EUR) | 68,939 |
| 24h range (EUR) | 68,162 to 70,195 |
| Market cap (EUR) | 1.386 trillion (rank 1) |
| 24h volume (EUR) | 180.2 billion |
| Change 1h / 24h / 7d | -0.03% / -1.77% / -4.73% |
| Change 14d / 30d / 200d / 1y | -5.43% / -7.95% / +3.54% / -29.44% |
| All-time high (EUR) | 107,662 (6 October 2025); current price -35.97% below |
| Circulating / total supply | 20,105,365 BTC (95.74% of 21,000,000 max) |
| Fully diluted valuation (EUR) | 1.386 trillion (equal to market cap) |
| BTC dominance | 59.22% of total crypto market cap |
Recovery to the all-time high requires a gain of 107,662 / 68,939 – 1 = +56.2% from current levels.
Market Setup
The cross-asset backdrop is neutral to negative for risk. Equity momentum is moderately negative: the Nasdaq Composite is the weakest 5-day performer at -2.80% and the S&P 500 fell 1.26% over 5 days to 7,580.07, while DACH equities outperform with a 5-day average of +2.00% versus -0.48% for global equity indicators. The DAX leads on a 1-month basis at +2.46%. The rates backdrop is mixed within a restrictive regime: the Euro Area AAA 10Y yield sits at 3.37% (as of 29 October 2026) with a 10Y-2Y spread of 36.5 bp, though the 2Y yield is up roughly 90 bp year to date. FX is mixed, with EUR/USD at 1.1173, down 1.36% over one month. Policy is a headwind: the US Federal Funds target range stands at 3.75% to 4.00% after a 25 bp hike effective 17 September 2026, and the ECB deposit facility rate is 2.50% after a 25 bp hike effective 16 September 2026. Dated commentary frames Bitcoin as a macro-sensitive risk asset that does not trade in isolation from monetary policy, with a stronger dollar and rising yields increasing downside risk [T3]. Tighter policy and weakening growth pressure crypto, while rate-cut expectations have historically supported Bitcoin rallies [T7].
Investment Thesis
Bitcoin is in a corrective phase within a longer-term structure: the price sits 35.97% below its October 2025 all-time high yet remains +3.54% positive over 200 days. The structural case rests on fixed supply of 21 million coins with 95.74% already issued, and on mature institutional access through ETFs, futures, custody and regulated venues [T6]. The cyclical case is weaker. Dated commentary argues Bitcoin faces a market-structure problem, not only a valuation problem: liquidity and positioning, not long-term adoption alone, are driving price action [T2]. One year after a $19 billion liquidation event, leverage remains the key fragility [T2]. ETF flows are the critical indicator of structural demand [T3], and the flow picture is currently conflicting: one dated source cites weekly US spot Bitcoin ETF outflows above $700 million [T2], while another cites a $3.55 billion inflow week that turned cumulative 2026 flows positive [T6]. The near-term path depends on which reading proves durable.
Bullish Drivers
- A $3.55 billion inflow week into crypto funds turned cumulative 2026 Bitcoin ETF flows positive after early-year withdrawals, according to undated coverage [T6].
- Ethereum funds attracted $702 million in the same period, signalling a broad institutional return rather than a Bitcoin-only trade [T6].
- Lower prices create more attractive entry points, and deep liquidity plus mature infrastructure support institutional allocation [T6].
- Single-day ETF inflows of $1.1 billion [T5] and $1 billion [T1] are cited in adoption coverage, illustrating the scale regulated vehicles can absorb.
- Regulatory tailwinds: clearer US stablecoin and market-structure rules could broaden institutional participation [T4].
- Approximately $3.3 billion in short positions could be liquidated on higher prices, creating short-squeeze potential, per dated commentary [T2].
Relative Positioning vs Gold and Ethereum
Current EUR price and performance data for gold and Ethereum are not in the provided dataset, so a quantitative comparison is not possible here. Qualitatively, dated commentary positions Bitcoin as a high-beta risk asset sensitive to rates and liquidity, in contrast to gold’s traditional safe-haven role [T3]. Blockchain-equity proxies carry beta well above 2 versus the S&P 500, illustrating the rate sensitivity of the crypto complex [T4]. Against Ethereum, Bitcoin retains the dominant allocation with 59.22% market share; Ethereum funds drew $702 million in the cited inflow week [T6], and a raised 12-month Ether target of $3,028 appeared in dated commentary [T2]. In a risk-off, higher-for-longer environment, gold would be expected to outperform Bitcoin on defensive rotation, consistent with Bitcoin’s 1-year EUR return of -29.44%. In a liquidity-driven risk-on rotation, dominance could erode modestly as capital spreads to Ethereum and Solana products [T6].
Scenario Framework
Three variables drive the path: the direction and size of US spot Bitcoin ETF flows, Fed policy expectations and Treasury yields [T2][T3], and technical zones from dated commentary: resistance near $85,000, support at $80,948 to $81,110, and a key reference zone at $71,000 to $72,000 [T2][T3]. Using EUR/USD at 1.1173, the $71,000 to $72,000 support zone corresponds to roughly EUR 63,500 to 64,400, and $85,000 resistance to roughly EUR 76,100. These are dated commentary levels, not current market prices.
- Bull (assumption): ETF inflows resume sustainably and Fed expectations turn dovish. Bitcoin reclaims resistance and dated bullish targets, such as the reported 12-month target of $113,000 (raised from $82,000, citing stronger crypto activity and renewed ETF inflows) [T2], become relevant. This is a market expectation, not a decision.
- Base (assumption): Flows stay choppy and policy stays restrictive after the September 2026 hikes by the Fed (3.75% to 4.00%) and ECB (2.50%). Bitcoin consolidates in the referenced $81,000 to $85,000 range with two-way volatility [T2].
- Bear (assumption): Renewed outflows plus stronger-than-expected inflation push Bitcoin through the $71,000 to $72,000 reference zone [T3], extending the drawdown beyond the current -35.97% from the all-time high.
Valuation Discussion
Bitcoin has no cash-flow basis, so valuation is relative and flow-driven. Price sits 35.97% below the EUR 107,662 all-time high of 6 October 2025, requiring a +56.2% recovery to reclaim it. Market cap equals fully diluted valuation at EUR 1.386 trillion because total supply equals circulating supply; only 894,635 BTC remain to be mined, preserving the scarcity framing. Liquidity is deep: 24h volume of EUR 180.2 billion equals roughly 13.0% of market cap. Note a data inconsistency: the reported BTC 24h volume exceeds the reported total crypto 24h volume of EUR 76.84 billion, likely reflecting different aggregation methodologies; treat volume comparisons with caution. Dominance of 59.22% within a EUR 2.338 trillion total market underscores Bitcoin’s role as the core crypto allocation. Dated commentary frames the current phase as a market-structure and positioning problem rather than a valuation problem [T2]. If ETF demand normalises at 2026-positive cumulative levels [T6], current pricing may reflect a liquidity discount rather than structural impairment. Conversely, if leverage-driven liquidations recur as in the cited $19 billion event [T2], realised prices can detach from any fundamental anchor for days.
Risks
- Policy risk: The Fed target range of 3.75% to 4.00% and the ECB deposit rate of 2.50% follow September 2026 hikes. Renewed tightening expectations would pressure risk assets [T3].
- Flow risk: Dated commentary cites US spot Bitcoin ETF weekly outflows above $700 million [T2] and $386.3 million in October outflows through 9 October [T2]; a $450 million outflow day and a fall below $76,000 after a CLARITY Act setback are also referenced [T6].
- Leverage risk: The $19 billion liquidation event one year ago shows excessive leverage can overwhelm fundamentals within hours [T2].
- Regulatory risk: Institutions require predictable rules; changes to ETF, custody, taxation or trading requirements could trigger outflows [T6].
- Volatility risk: Repeated extreme moves can trigger redemptions and deter institutional allocation [T6].
- Macro risk: Tighter monetary policy and weakening growth pressure crypto; a stronger dollar and rising yields increase downside risk [T3][T7].
- Data caveats: Most news items lack publication dates, and USD-quoted commentary levels (near $83,000) differ from the current EUR bundle price of EUR 68,939. Applying EUR/USD at 1.1173, $83,000 corresponds to roughly EUR 74,300, indicating the commentary predates the current market. All commentary figures are dated context, not current state.
Appendix
Methodology and Data Notes
All primary market data comes from the CoinGecko bundle retrieved 2026-10-31T05:15:11Z, quoted in EUR. Policy rates come from the bundle’s policy rates block: US Federal Funds target range 3.75% to 4.00% (last change: hike of 25 bp, effective 2026-09-17, as of 2026-10-30) and ECB deposit facility rate 2.50% (last change: hike of 25 bp, effective 2026-09-16, as of 2026-10-31). Equity, rates and FX data points are as of 29 to 31 October 2026 from stoxx_csv, wienerboerse_csv, fmp, ecb_yield_curve and frankfurter_fx. News sources T1 to T8 are commentary and secondary reporting, mostly undated; USD figures are quoted with source attribution and labelled as dated commentary, not current state. Missing from the dataset: current EUR prices for the gold and Ethereum benchmarks, on-chain metrics, derivatives open interest, funding rates, realised volatility, and a dated ETF flow series. Scenario labels (bull, base, bear) are analyst assumptions, not forecasts or decisions. Calculations shown: supply issued 20,105,365 / 21,000,000 = 95.74%; remaining supply 894,635 BTC; volume turnover 180,197,496,515 / 1,386,053,698,865 = 13.0%; recovery to ATH 107,662 / 68,939 – 1 = +56.2%.
Sources
- [T1] Bitcoin ETFs Absorb $1B in a Day, Institutional Liquidity …
- [T2] Bitcoin Faces Market Structure Problem Amid Volatility
- [T3] Bitcoin is holding above $82,000, but the market’s risk appetite is weakening
- [T4] Amplify Transformational Data Sharing ETF (BLOK): Blockchain Exposure Amid Regulatory and Macro Shifts
- [T5] Institutional adoption of Bitcoin ETFs, led by BlackRock
- [T6] Crypto Funds See $3.55B Inflows: Bitcoin Leads as Ethereum and Solana Surge
- [T7] Quartz: Global economy watch: trade, rates, and jobs data
- [T8] Global X ETFs: U.S. Innovation Meets Investing
Disclaimer
This report is AI-generated and provided for informational purposes only. It does not constitute investment advice, a recommendation, or an offer to buy or sell any financial instrument. Data may be incomplete, delayed, or inconsistent, and scenario labels are assumptions rather than forecasts. Readers should conduct their own research and consult a licensed financial adviser before making investment decisions.
Important Note / Wichtiger Hinweis:
EN: This report may have been generated using AI. It processes data from publicly available sources. The content is provided for informational purposes only.DE: Dieser Bericht kann mithilfe von KI erstellt worden sein. Dabei werden Daten aus öffentlich zugänglichen Quellen verarbeitet. Die Inhalte dienen ausschließlich Informationszwecken.
* DE: Die ergänzenden Inhalte können KI-generiert sein. EN: The additional content may be AI-generated.