
Watch the video
This player shows only the Bitcoin chapter of the daily altii market briefing. Watch the full video on tube.altii.de.
Key Data Snapshot
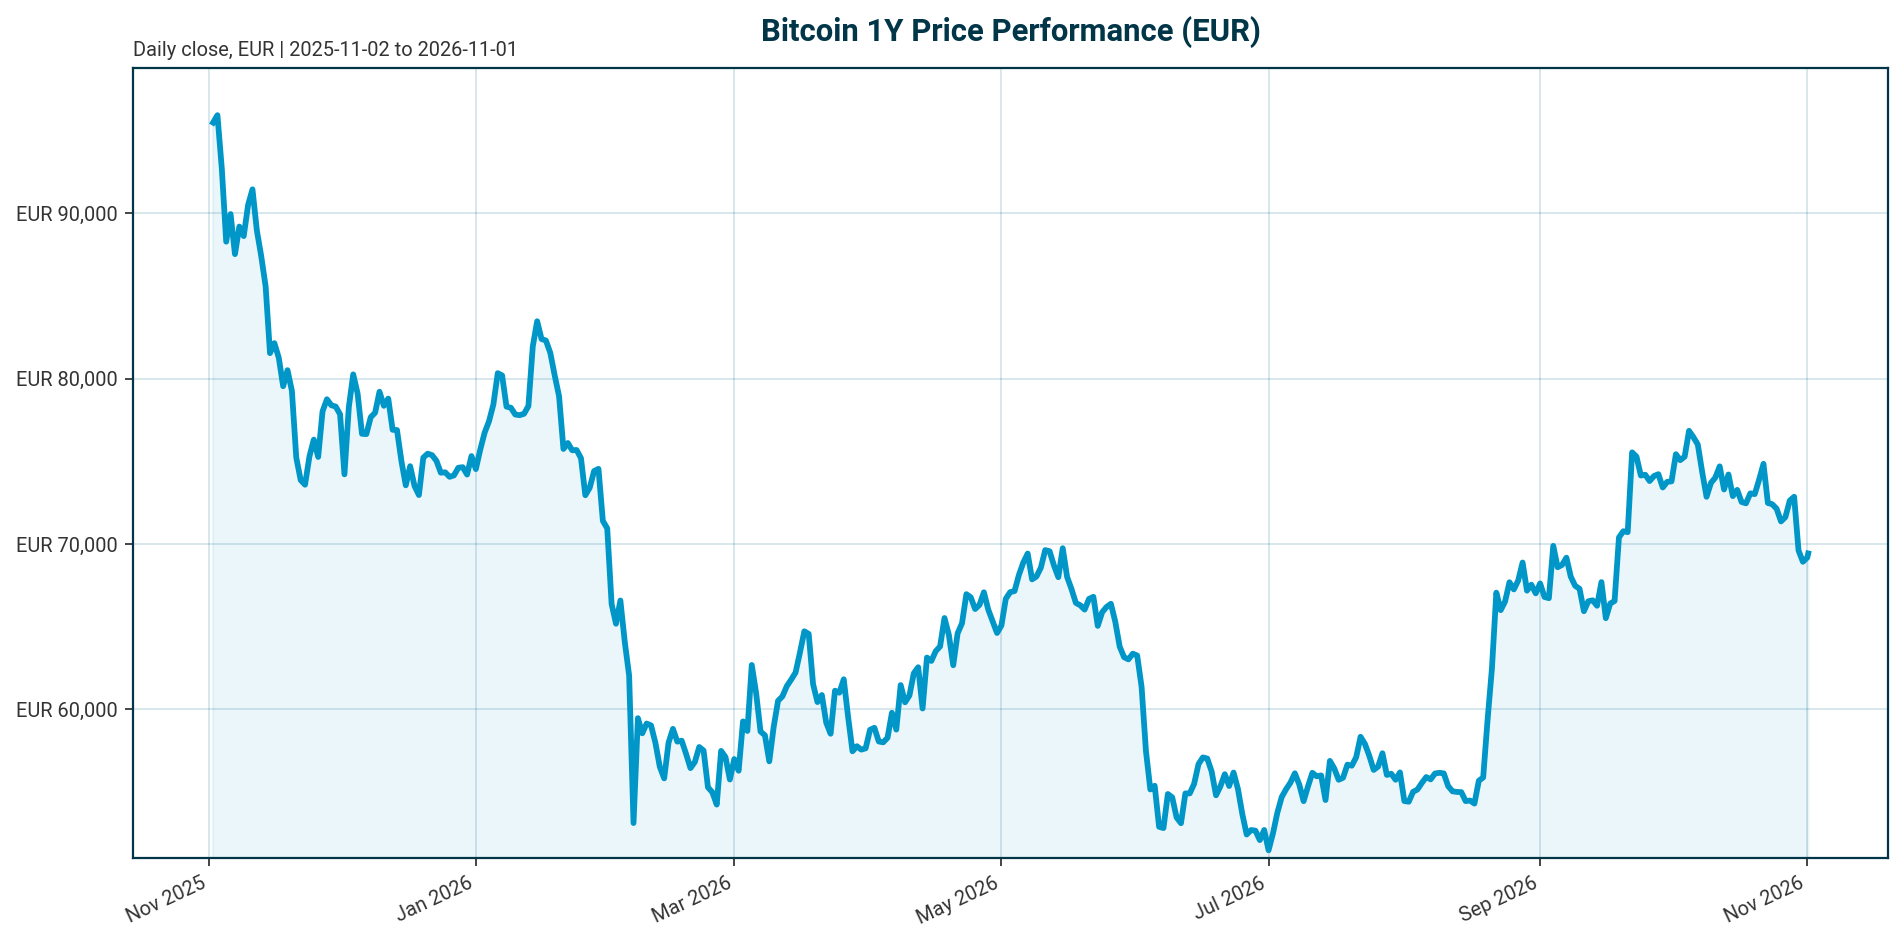
| Metric | Value | As of / Note |
|---|---|---|
| BTC price (EUR) | EUR 69,429 | Retrieved 2026-11-01 05:15 UTC |
| 24h range (EUR) | EUR 68,917 to 69,435 | +0.72% over 24h |
| 7d / 14d / 30d change | -3.75% / -5.04% / -9.06% | EUR terms |
| 1y change | -29.47% | EUR terms |
| 200d change | +4.53% | EUR terms |
| All-time high | EUR 107,662 (2025-10-06) | Current price -35.51% below ATH |
| Market cap / FDV | EUR 1,395.9bn / EUR 1,395.9bn | Rank 1 |
| 24h volume | EUR 40.59bn | ~2.9% of market cap (40.59 / 1,395.9) |
| Circulating supply | 20,105,365 of 21,000,000 | 95.74% issued; 894,635 coins remain |
| BTC dominance | 59.29% | Total crypto market cap EUR 2,351.3bn |
| Fed funds target range | 3.75% to 4.00% | Last change: +25 bp hike, effective 2026-09-17; as of 2026-10-31 |
| ECB deposit facility rate | 2.50% | Last change: +25 bp hike, effective 2026-09-16; as of 2026-10-31 |
| Euro area AAA 10Y yield | 3.37% | As of 2026-10-29; 10Y-2Y spread 36.5 bp |
| EUR/USD | 1.1176 | As of 2026-11-01; +0.20% over 5 days, -4.89% YTD |
Market Setup
Risk sentiment is neutral to negative and equity momentum is moderately negative, with the Nasdaq Composite the weakest 5-day performer at -2.80% and the S&P 500 down 1.26% over 5 days. DACH equities are outperforming: DACH indicators average +2.00% over 5 days versus -0.48% for global equity indicators, with the ATX strongest at +2.39% and the DAX leading on a 1-month basis at +2.46%. The rates backdrop is mixed in the euro area: the AAA 10Y yield sits at 3.37%, up 0.4 bp over 5 days but down 23.4 bp over the past month, with a 10Y-2Y spread of 36.5 bp. FX is mixed, with EUR/USD at 1.1176 (+0.20% over 5 days). Policy is restrictive for liquidity-sensitive assets: the Fed funds target range stands at 3.75% to 4.00% after a 25 bp hike effective 2026-09-17, and the ECB deposit facility rate is 2.50% after a 25 bp hike effective 2026-09-16. According to [T2] from July 2026, markets under Fed Chair Kevin Warsh expected the Fed to hold rates through Q3, leaving limited room for the policy easing that has historically supported crypto recoveries; that expectation was overtaken by the September hike. For Bitcoin, this setup means the recovery path depends on ETF flow momentum rather than monetary easing.
Investment Thesis
Bitcoin has transitioned from a retail-driven, halving-dominated asset into an institution-dominated, macro-sensitive reserve asset. Institutional entities, including ETFs, governments, and public and private companies, now hold approximately 18.5% of the 21 million coin supply cap, according to [T7] (no as-of date given, treat as an approximate third-party estimate). This adoption has deepened liquidity and strengthened infrastructure, but it has also tied BTC more closely to traditional macro and credit cycles than during the retail era, per [T3].
The near-term picture is constrained. BTC trades at EUR 69,429, down 35.51% from its October 2025 ATH and down 29.47% over one year in EUR terms. US spot Bitcoin ETF flows swung from roughly USD 4.7 billion of net outflows in Q2 2026 to USD 6.4 billion of net inflows in Q3 2026, an approximately USD 11.1 billion quarterly swing, per [T4]. A single late-October 2026 session saw about USD 635 million of net outflows, per [T1], showing how quickly the marginal institutional bid can reverse. The same ETF wrapper that brought capital in gives allocators a one-click way to take it out.
The structural thesis remains intact: supply growth is below 1% annually by code, and institutions managing more than USD 140 trillion could eventually allocate even a small single-digit percentage to digital assets, per [T1]. Distribution is widening, with Morgan Stanley and Vanguard adding bitcoin to their investment platforms in Q4, per [T8] from February 2026. The base case is consolidation in a macro-constrained range while ETF flows and the stalled CLARITY Act determine direction. The bull case requires a regulatory catalyst plus sustained inflows; the bear case is a repeat of the Q2 outflow regime under restrictive policy. Note that one dated forecast, per [T5] from February 2026, saw BTC reaching USD 180,000 in 2026; that forecast conflicts with the current -29.5% one-year reality and should be treated strictly as a dated third-party view, not a live target.
Bullish Drivers
- Fixed, scarce supply. The cap is 21 million coins, 95.74% are already issued, and annual supply growth is below 1%, per [T1]. Only 894,635 coins remain to be mined.
- Large allocation headroom. Institutions managing more than USD 140 trillion could eventually allocate a small single-digit percentage to digital assets, per [T1]. Even fractional allocation against sub-1% supply growth creates a structural demand-supply gap.
- ETF infrastructure as a structural buyer. Spot Bitcoin ETFs managed over USD 150 billion in AUM as of late 2025 and attracted tens of billions in net inflows through 2025, per [T5]. BlackRock’s IBIT was the fastest ETF in history to reach USD 10 billion in AUM, hitting the milestone in 49 trading days, per [T7].
- Widening distribution. Morgan Stanley expanded client access to regulated bitcoin products and Vanguard added third-party bitcoin ETFs to its platform in Q4, per [T8]. Pension funds, sovereign wealth funds and central banks are appearing in 13F filings, though disclosed positions remain modest, per [T3].
- Regulatory milestones achieved. The SEC’s March 2026 classification of Bitcoin as a digital commodity was a milestone, per [T1]. Texas is buying and adding bitcoin to state reserves and federal reserve-addition discussions are ongoing, per [T8].
- Product depth. Deep, liquid options markets on regulated bitcoin ETFs enable covered call, buffered and other derivatives-based income and hedging strategies, broadening the investable wrapper set, per [T2].
Relative Positioning vs Gold and Ethereum
Gold spot and Ethereum price data are not in the dataset, so this comparison is framework-based rather than level-based. Bitcoin dominates the crypto complex at 59.29% of a EUR 2,351.3 billion total market cap, and per [T5] liquidity concentrates on assets with clear adoption, making Bitcoin the default institutional allocation and making broad altcoin rallies unlikely. The value accrual framing in [T5] positions Bitcoin as store of value, Ethereum for staking and DeFi infrastructure, and other protocols for real-world assets.
Against gold, the key distinction is behaviour under current policy. With the Fed at 3.75% to 4.00% and the ECB at 2.50%, Bitcoin’s zero-carry, macro-sensitive profile makes it behave closer to a high-beta risk asset than to gold in the near term; institutional adoption has tied BTC to macro and credit cycles, per [T3]. A policy easing pivot is the scenario under which the gold-like store-of-value framing regains traction. Against Ethereum, Bitcoin offers no native yield; income-oriented BTC exposure requires derivatives overlays such as covered call ETFs, per [T2], whereas staking provides Ethereum with a carry alternative. Relative performance hinges on whether the next institutional inflow wave is store-of-value-driven, favouring BTC, or infrastructure-driven, favouring ETH.
Scenario Framework
All price zones below are analyst scenario assumptions derived from the current drawdown, flow data and policy anchor in the bundle and cited sources. They are not third-party forecasts.
- Bull scenario. Triggers: CLARITY Act progress, ETF flows returning to Q3-2026-style net inflows of USD 6 billion or more per quarter, and any Fed easing signal. Implication: BTC recovers toward the EUR 90,000 to 107,000 zone, approaching the prior ATH, amplified in EUR terms if EUR/USD weakens from 1.1176.
- Base scenario. Triggers: Fed holds at 3.75% to 4.00% and ECB at 2.50%, flows oscillate session to session as in late October 2026, and market-structure legislation stays stalled. Implication: BTC ranges roughly EUR 60,000 to 75,000 in a compressed volatility regime; institutional participation has compressed volatility from historical 60% to 80% toward roughly 30%, per [T1], though that figure comes from a source promoting a specific ETF product and may carry promotional bias.
- Bear scenario. Triggers: renewed multi-week ETF outflow streaks, further policy tightening, or adverse regulatory or custody events, per [T3]. Implication: BTC breaks through a -40% drawdown toward the EUR 55,000 to 60,000 area; euro strength would deepen EUR-quoted losses. Positioning can amplify moves in both directions, as shown by the more than USD 1.6 billion of shorts liquidated in 24 hours on 1 August 2026, per [T4].
Valuation Discussion
Bitcoin has no cash flows, dividends or earnings, so discounted cash flow valuation does not apply. Valuation rests on scarcity, adoption and liquidity. Market cap equals fully diluted valuation at EUR 1,395.9 billion because circulating supply equals total supply at 20,105,365 coins. The residual unmined supply is 894,635 coins, and annual issuance is below 1%, per [T1].
The demand-supply gap framework is the core valuation argument: institutions have absorbed multiples of daily miner issuance, per [T5], against a fixed residual supply. If institutional demand persists, the scarcity premium expands; the magnitude depends on flow persistence, which is unproven given the roughly USD 11.1 billion quarterly swing from Q2 outflows to Q3 inflows, per [T4]. The de-rating case is equally clear: if institutional demand normalises to a lower run-rate, the market must re-price without the marginal ETF bid, which is consistent with the current -35.51% drawdown from ATH. That drawdown is mid-range by historical BTC bear-market standards rather than a cycle-bottom extreme. Opportunity cost matters for a zero-carry asset: the euro AAA 10Y yield of 3.37% is the risk-free benchmark EUR-based allocators weigh against BTC exposure.
Risks
- Policy and rates risk. The Fed funds target range of 3.75% to 4.00% after the September 2026 hike and the ECB deposit rate of 2.50% after its own September hike keep liquidity conditions restrictive. A further hike would pressure all macro-sensitive assets.
- Flow reversal risk. The roughly USD 635 million single-session ETF outflow in late October 2026, per [T1], and the Q2 2026 regime of about USD 4.7 billion in net outflows, per [T4], show the marginal buyer can become the marginal seller within days.
- Regulatory risk. Market-structure legislation is stalled and banking and custody rules remain uncertain, per [T1]. Negative regulatory developments could significantly affect institutional allocation, per [T3].
- Custody and concentration risk. Hacks and internal exploits remain possible even with qualified custodians, and ETF assets are concentrated in a handful of issuers, creating market-structure risk if any issuer experiences operational stress, per [T3].
- Macro correlation risk. Institutionalisation has tied BTC more tightly to macro and credit cycles, per [T3], and BTC responded alongside other macro-sensitive assets when policy expectations tightened, per [T4]. Diversification benefits shrink exactly when equity drawdowns hit.
- Leverage and positioning risk. The more than USD 1.6 billion of shorts liquidated in 24 hours on 1 August 2026, per [T4], illustrates how compressed positioning amplifies moves in both directions.
- EUR translation risk. EUR/USD at 1.1176, up 4.89% YTD, means EUR-quoted BTC returns differ from USD-quoted returns; a stronger euro mechanically reduces EUR-quoted performance even if the USD price is flat.
Appendix
Data Provenance
- All BTC metrics derive from a CoinGecko-based bundle retrieved 2026-11-01T05:15:13Z, quoted in EUR.
- Policy rates come from the bundle’s authoritative policy rates block as of 2026-10-31: Fed funds target range 3.75% to 4.00% (last change: +25 bp hike, effective 2026-09-17); ECB deposit facility rate 2.50% (last change: +25 bp hike, effective 2026-09-16).
- Equities, yields and FX come from the bundle’s market overview data points as of 2026-10-29 and 2026-10-30 for indices and yields, and 2026-11-01 for FX.
- Gold spot price and current Ethereum price are not in the dataset; the relative positioning section is therefore framework-based.
Labelling Conventions
- Third-party figures are quoted with source and date context. Examples: Q3 2026 ETF net inflows of USD 6.4 billion per [T4]; the USD 180,000 2026 forecast per [T5] from February 2026 is a dated forecast, not a live target; [T8]’s February 2026 framing of a Fed rate-cutting cycle in early innings conflicts with the September 2026 hike and is quoted only as a dated historical view.
- Some Tavily items lack publication dates; dates are inferred from content and flagged as approximate.
- All scenario price zones are analyst constructions, not sourced forecasts.
Sources
- [T1] MAXI ETF: Bitcoin Exposure with an Income Overlay in a Challenging Macro Backdrop (Tickeron)
- [T2] Q2 2026 Digital Asset Review (CoinDesk Indices, July 2026)
- [T3] Institutional Bitcoin Adoption Explained: How Blackrock, Fidelity and Others Embraced BTC (The Block)
- [T4] Crypto After the Midterms: Regulation, Liquidity and the Institutional Era (AMINA Bank)
- [T5] The Retail vs. Institutional Divide: How Trading Patterns Reveal Two Completely Different Markets (Blockhead, February 2026)
- [T6] Bitcoin ETFs Absorb $134.4M as Macro Backdrop Improves (Elevano Capital via LinkedIn)
- [T7] The End of Bitcoin’s Four-Year Cycle? How ETFs and Institutions Are Reshaping the Market (Wolf & Company)
- [T8] Bitcoin’s Evolving Institutional Role (ARK Invest, February 2026)
Disclaimer
This report is AI-generated and provided for informational purposes only. It does not constitute investment advice, a recommendation, or an offer to buy or sell any asset. Scenario price zones are analyst assumptions, third-party figures are quoted with their source and date context, and data may be incomplete or subject to revision. Readers should conduct their own due diligence and consult a licensed financial advisor before making investment decisions.
Important Note / Wichtiger Hinweis:
EN: This report may have been generated using AI. It processes data from publicly available sources. The content is provided for informational purposes only.DE: Dieser Bericht kann mithilfe von KI erstellt worden sein. Dabei werden Daten aus öffentlich zugänglichen Quellen verarbeitet. Die Inhalte dienen ausschließlich Informationszwecken.
* DE: Die ergänzenden Inhalte können KI-generiert sein. EN: The additional content may be AI-generated.