
Watch the video
This player shows only the Bitcoin chapter of the daily altii market briefing. Watch the full video on tube.altii.de.
Key Data Snapshot
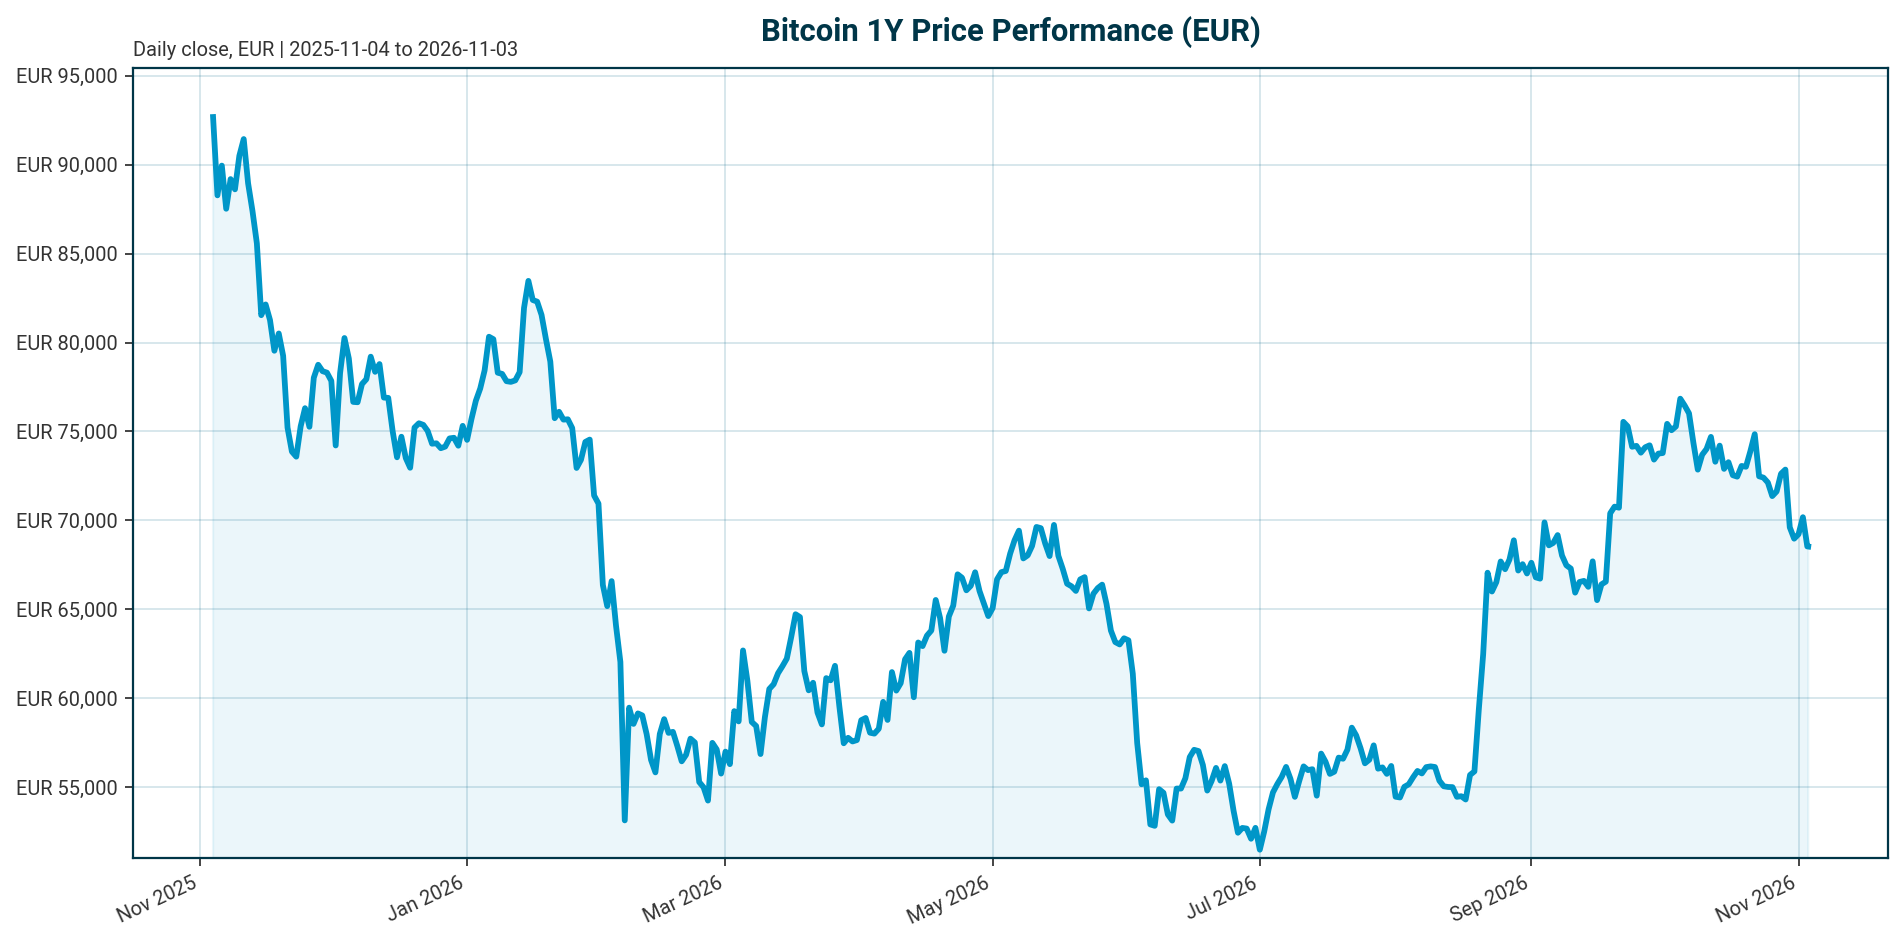
Bitcoin (BTC) trades at EUR 68,565 as of 2026-11-03, down 36.31% from its all-time high of EUR 107,662 set on 2025-10-06. Momentum is negative across all short- and medium-term windows, while the 200-day change remains marginally positive.
| Metric | Value |
|---|---|
| Price (EUR) | 68,565.00 |
| 24h range (EUR) | 68,350 to 69,967 |
| 24h volume (EUR) | 23.80 billion |
| Performance: 24h / 7d / 14d / 30d | -1.98% / -3.59% / -6.36% / -9.41% |
| Performance: 200d / 1y | +2.97% / -28.83% |
| All-time high (EUR) | 107,662 (2025-10-06); drawdown -36.31% |
| Market cap (EUR) | 1.379 trillion (rank 1) |
| Fully diluted valuation (EUR) | 1.379 trillion (equal to market cap) |
| BTC dominance | 59.27% of a EUR 2.316 trillion total crypto market |
| Circulating supply | 20,105,365 of 21,000,000 max (95.74% issued) |
| Fed funds target range | 3.75% to 4.00% (as of 2026-11-02); last change: hike of 25 bp, effective 2026-09-17 |
| ECB deposit facility rate | 2.50% (as of 2026-11-03); last change: hike of 25 bp, effective 2026-09-16 |
Calculations: drawdown = 68,565 / 107,662 – 1 = -36.31%. Recovery required to reclaim the ATH = 107,662 / 68,565 – 1 = +57.0%. Daily turnover = 23.80bn / 1,378.5bn = 1.73%. Momentum spread: 30d (-9.41%) versus 200d (+2.97%) = a 12.38 percentage point gap, quantifying short-term deterioration within a longer-term uptrend under stress.
Market Setup
The macro backdrop is a headwind. The bundle flags negative risk sentiment and moderately negative equity momentum, with the Nasdaq Composite the weakest 5-day performer at -4.96% and the S&P 500 down 2.35% over 5 days. DACH equities are outperforming: DACH indicators average +0.77% over 5 days versus -1.48% for global equity indicators, and the DAX leads on a 1-month basis at +2.97%. The rates backdrop is mixed: the Euro Area AAA 10Y yield sits at 3.37% (-0.9 bp over 5 days), the AAA 10Y-2Y spread is 36.0 bp, and 2Y and 5Y yields have fallen 15 to 19 bp over the past month. FX is mixed, with EUR/USD at 1.1192 (+0.15% over 5 days, -4.75% YTD) and EUR/JPY the strongest 5-day mover at +0.20%.
Policy is restrictive. The Fed funds target range stands at 3.75% to 4.00% after a 25 bp hike effective 2026-09-17, and the ECB deposit facility rate stands at 2.50% after a 25 bp hike effective 2026-09-16. This removes the liquidity tailwind that historically supported crypto recoveries. Bitcoin’s 30-day decline of -9.41% coincides with the equity risk-off window, consistent with the macro-linked regime described in the sources [T4] [T5]. Base scenario: with both central banks having tightened in September, BTC stays correlated to equity risk appetite rather than decoupling. Alternative scenario: a dovish repricing in rate expectations would, per the mechanism described in a 2025 year-end review [T2], historically have supported risk-asset recoveries; this is a market-expectation scenario, not a decision.
Investment Thesis
The core institutional thesis is that Bitcoin has become an ETF- and macro-led allocatable asset. Its near-term direction is set by ETF flows and rate expectations; its long-term case rests on structural adoption and regulatory clarity. The evidence for the flow regime is concrete: record outflows from U.S.-listed BTC and ETH ETFs in Q4 2025 coincided with Bitcoin breaking key support around $98,000, per a 2025 year-end review [T2]. The same review reported 6.7 million BTC held across ETFs, exchanges and treasuries at end-2025, which Glassnode described as Bitcoin’s “institutional supply era” [T2].
Regulated vehicles have turned BTC into an allocatable line item for registered investment advisors, private banks and institutions [T2], with model portfolio integration and macro risk underwriting expanding [T5]. Institutions absorbed far more daily supply than miners produce, turning BTC into a macro-sensitive reserve asset, according to a February 2026 outlook [T6]. The regulatory swing factor is the U.S. CLARITY Act, which would establish a federal market-structure framework and could unlock broader institutional participation if passed, according to a July 2026 review [T1]; a September 15 CLARITY Act vote was flagged as a sentiment catalyst in a 2026 piece [T7].
The current price of EUR 68,565 sits 36.3% below the October 2025 ATH. The market is pricing the restrictive macro phase, not the structural adoption story. Bull scenario: ETF flows turn positive and the CLARITY Act passes, restoring the demand vector that drove prior cycles. Bear scenario: outflows persist under restrictive policy and BTC continues to trade as a high-beta liquidity asset, extending the drawdown beyond -36%.
Bullish Drivers
- Supply constraint. 95.74% of the 21 million max supply is already issued, leaving 894,635 BTC unissued. Halving-cycle supply dynamics are augmented by institutional demand vectors, per a 2026 outlook piece [T3].
- Regulatory catalyst. The CLARITY Act market-structure framework is the most cited potential unlock for institutional capital [T1] [T7]. Clearer rules would simplify internal approval processes for institutions, though passage would not guarantee immediate inflows [T7].
- Custody and infrastructure. Regulated platforms now custody an estimated 5% to 7% of all circulating Bitcoin under institutional audit standards, per a community-sourced piece, use with caution [T5]. Banking integration deepens via custody, trading and lending services [T4].
- Pension and sovereign participation. U.S. pension plans are gradually adding ETF positions, and sovereign wealth funds and central banks have appeared as ETF holders in 13F filings, though disclosed positions remain modest [T4].
- Corporate treasuries. Strategy (formerly MicroStrategy) remains a closely monitored holder, though it reportedly slowed purchases amid weaker financing conditions, according to a May 2026 outlook [T8].
- Flow recovery potential. A 2026 outlook piece cites daily ETF inflows exceeding $400 million and 94% institutional recognition of blockchain value; this is a promotional source and should be weighted lowest [T3].
Scenario: if ETF creation loops resume alongside CLARITY Act passage, the demand vector that absorbed multiples of daily miner supply [T6] could re-engage. If corporate treasury buying resumes as financing conditions ease, the marginal buyer base broadens beyond ETF flows.
Relative Positioning vs Gold and Ethereum
Data gap disclosure: the dataset contains no current gold or ethereum price, market cap or performance data. This section therefore relies on qualitative source material and the single in-bundle relative-value metric.
Against gold: Ark Invest’s model focuses on Bitcoin’s potential to capture market share from traditional store-of-value assets like gold, with a $1,000,000 by 2030 projection and a $200,000 2026 milestone; these are dated third-party expectations, not facts [T3]. The competition thesis strengthens if BTC continues institutionalizing as a macro-sensitive reserve asset [T6]. If macro-linked drawdowns persist, gold’s lower-beta profile dominates in multi-asset portfolios, a structural advantage in the current risk-off regime.
Against ethereum: BTC dominance of 59.27% within a EUR 2.316 trillion total crypto market is the only in-bundle relative metric, and it shows capital concentrated in the largest asset. Spot ETFs, corporate treasuries and regulated vehicles made BTC an allocatable store-of-value-like line item, a path distinct from ethereum’s smart-contract platform role [T2] [T5]. A broad altcoin rally is viewed as unlikely, with liquidity concentrating on assets with clear adoption and business models [T6]. In Asia, institutional adoption favors tokenization and stablecoins over pure bitcoin ETF plays, per Hong Kong’s Stablecoins Ordinance context from a July 2026 review [T1].
Scenario Framework
Bull scenario. Trigger: CLARITY Act passage plus a turn to positive ETF flows. Price recovers toward the $150,000 to $180,000 range cited in dated 2026 analyst forecasts: JPMorgan’s flow-based model projected a $150,000 peak by Q4 2026 with 72% stated confidence [T3], and a February 2026 outlook forecast $180,000 [T6]. These are scenario anchors, not house forecasts. At EUR/USD 1.1192, $150,000 converts to roughly EUR 134,030 and $180,000 to roughly EUR 160,830, illustrative only.
Base scenario. Policy stays restrictive with the Fed at 3.75% to 4.00% and the ECB at 2.50%. ETF flows stay choppy. BTC ranges below the ATH with dominance holding near 59% as liquidity concentrates in the largest asset [T6]. Note on expectations: a July 2026 review stated the Fed was expected to hold rates through Q3 under Chair Warsh [T1]; the policy rates block shows a 25 bp hike effective 2026-09-17, so that hold expectation was overtaken by events and must not be treated as current policy.
Bear scenario. Trigger: sustained ETF redemptions plus renewed equity drawdowns. The Q4 2025 precedent, where record outflows coincided with support breaks around $98,000 [T2], describes the transmission mechanism. The drawdown extends beyond -36% from ATH. Volatility context: Bitcoin’s volatility reportedly fell from 84% to 43% per the Glassnode x Fasanara 2025 report [T2], but its volatility is now tied to interest rates, equity rotations and margin demands [T5].
Valuation Discussion
Bitcoin has no cash-flow-based intrinsic value, so all valuation frameworks are reflexive on flows and sentiment. Three anchors apply:
- Flow-based models. JPMorgan’s flow-based valuation model projected a $150,000 peak targeting Q4 2026, with methodology emphasizing structural ETF and treasury demand; a dated third-party expectation [T3].
- Long-term adoption models. Ark Invest projects $1,000,000 by 2030 based on institutional adoption and gold market-share capture; a dated third-party expectation [T3].
- Supply-side scarcity. 20,105,365 of 21,000,000 BTC are issued (95.74%). FDV equals market cap at EUR 1.379 trillion, so valuation is fully supply-adjusted and price is the only lever.
Demand-side context: institutions absorbed multiples of daily miner issuance, per a February 2026 outlook [T6], and 6.7 million BTC sat in institutional-adjacent custody at end-2025 [T2]. Recovery math: reclaiming the ATH of EUR 107,662 requires +57.0% from EUR 68,565. EUR-denominated targets depend on EUR/USD direction; a stronger euro mechanically lowers EUR-quoted BTC prices absent USD price moves. No on-chain metrics (MVRV, realized price, hash rate) are available in the dataset, which caps valuation depth.
Risks
- Macro-policy risk. Institutionalization has tied BTC more closely to traditional macro and credit cycles [T4], introducing a systemic volatility profile tied to interest rates, equity rotations and margin demands [T5]. The Fed at 3.75% to 4.00% and the ECB at 2.50% after September 2026 hikes leave no liquidity tailwind; no further central bank decision exists in the dataset, and any expectation of one must be sourced and dated.
- Flow reversal risk. Institutional participation amplifies volatility in both directions; recent ETF outflows demonstrated this, according to a May 2026 outlook [T8]. Strategy reportedly slowed purchases amid weaker financing conditions [T8].
- Regulatory risk. Future negative regulatory developments could significantly affect institutional capital allocation [T4]. CLARITY Act failure is a downside trigger [T1] [T7].
- Custody and concentration risk. Custody remains an operational risk even with qualified custodians, and ETF assets concentrated in a handful of issuers raise market-structure questions if any issuer experiences operational stress [T4]. Treasury-leveraged equity strategies have shown amplified drawdowns relative to the underlying token [T4].
- Volatility misconception. Contrary to some expectations, institutional adoption has not made Bitcoin less volatile in the way assumed; it has changed the volatility’s source [T4].
Appendix
Methodology and provenance. Market data retrieved 2026-11-03T05:15:07Z via CoinGecko, quoted in EUR. Policy rate provenance: Fed funds target range 3.75% to 4.00% (FRED, as of 2026-11-02); ECB deposit facility rate 2.50% (ECB key rate, as of 2026-11-03); both hikes effective mid-September 2026. Market overview provenance: DAX (STOXX), ATX (Wiener Boerse), Euro Stoxx 50, S&P 500, Nasdaq, Nikkei, Hang Seng (FMP), ECB AAA yield curve (as of 2026-10-30), Frankfurter FX rates.
Data gaps. No live gold or ethereum prices in the dataset. No current BTC ETF flow figures; flow discussion relies on dated sources (Q4 2025 outflows in [T2], May 2026 commentary in [T8]), so the present flow regime is unknown. Most Tavily sources lack publication dates; dates are inferred from content (T1 from July 2026, T6 from February 2026, T8 from May 2026) and are approximate. Source quality notes: T3 (intellectia.ai) is a promotional source and is weighted lowest; T5 (moomoo) is a community post and its 5% to 7% custody figure is unsourced within it; the remainder are trade press or research summaries. The most recent BTC-specific news is from May 2026, leaving a potential information gap for Q4 2026.
Glossary. ETF creation/redemption loops: the mechanism by which authorized participants create or redeem ETF shares, requiring physical BTC purchases or sales. DAT: digital asset treasury, a corporate structure holding crypto on the balance sheet. BTC dominance: Bitcoin’s share of total crypto market capitalization. FDV: fully diluted valuation, price multiplied by maximum supply. CLARITY Act: proposed U.S. legislation establishing a federal market-structure framework for digital assets. AAA yield curve spread: the difference between Euro Area AAA 10Y and 2Y yields, here 36.0 bp.
Sources
- [T1] Q2 2026 Digital Asset Review, CoinDesk Indices: link
- [T2] Crypto Market 2025: Year-End Review & Expert Insights, TradingView News: link
- [T3] Bitcoin Price Prediction 2026: Institutional Adoption & ETF Impact Analysis, Intellectia: link
- [T4] Institutional Bitcoin Adoption Explained, The Block: link
- [T5] Bitcoin ETF Flows Remain a Key Market Driver, Moomoo Community: link
- [T6] The Retail vs. Institutional Divide, Blockhead (February 2026): link
- [T7] Crypto ETFs Enter a New Phase in September, Bitcoin Foundation: link
- [T8] Bitcoin Outlook: ETF Outflows, Institutional Adoption & Price Forecast 2026, IG South Africa (May 2026): link
Disclaimer. This report is AI-generated, for informational purposes only, and does not constitute investment advice. Figures are drawn from the cited dataset and sources as of the retrieval dates shown; readers should verify current data before making any investment decision.
Important Note / Wichtiger Hinweis:
EN: This report may have been generated using AI. It processes data from publicly available sources. The content is provided for informational purposes only.DE: Dieser Bericht kann mithilfe von KI erstellt worden sein. Dabei werden Daten aus öffentlich zugänglichen Quellen verarbeitet. Die Inhalte dienen ausschließlich Informationszwecken.
* DE: Die ergänzenden Inhalte können KI-generiert sein. EN: The additional content may be AI-generated.