
Watch the video
This player shows only the Bitcoin chapter of the daily altii market briefing. Watch the full video on tube.altii.de.
Key Data Snapshot
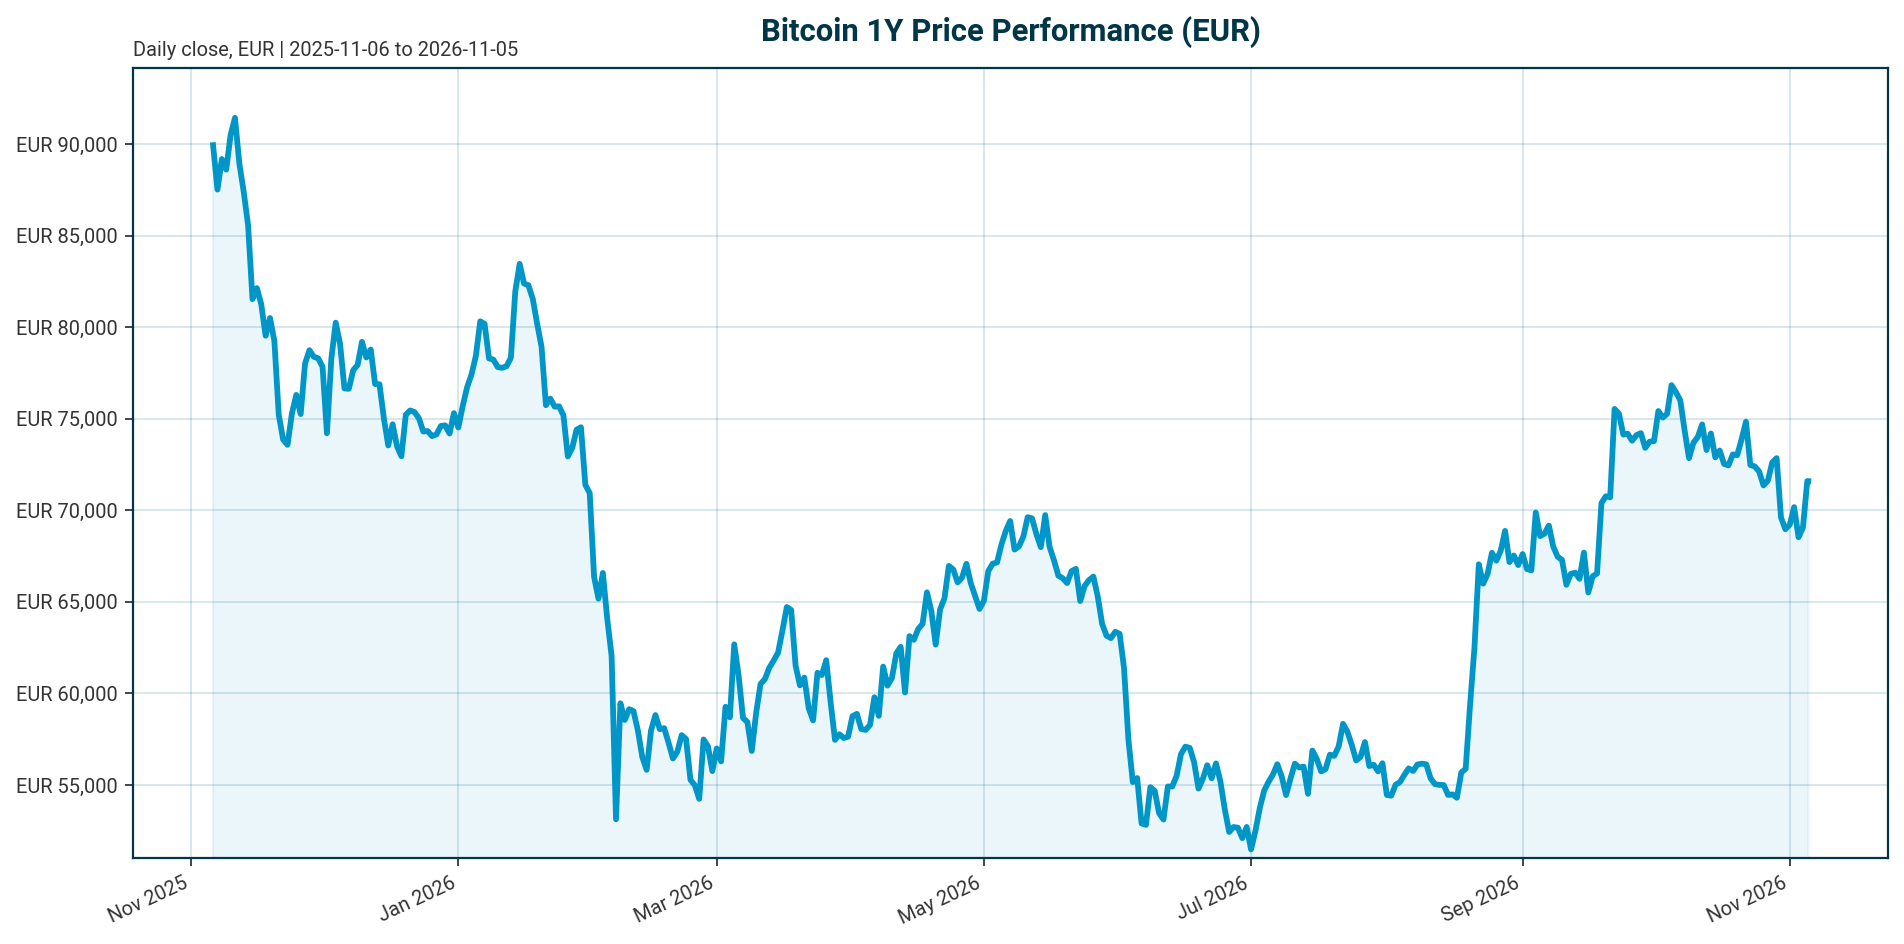
Bitcoin trades at EUR 71,422 as of 5 November 2026, rebounding 3.81% over 24 hours but still down 5.88% over 30 days and 21.19% year-on-year. The asset sits 33.66% below its all-time high of EUR 107,662 set on 6 October 2025.
| Metric | Value | Metric | Value |
|---|---|---|---|
| Price (BTC/EUR) | EUR 71,422.00 | Market cap | EUR 1.436 trillion |
| 24h range | EUR 68,970 to 71,930 | Fully diluted valuation | EUR 1.436 trillion |
| 24h volume | EUR 32.13 billion | Market cap rank | 1 |
| 1h / 24h change | -0.04% / +3.81% | BTC dominance | 59.54% |
| 7d / 14d change | +0.89% / -2.88% | Total crypto market cap | EUR 2.41 trillion |
| 30d / 200d change | -5.88% / +6.54% | Circulating supply | 20,105,365 BTC (95.74% of 21m cap) |
| 1y change | -21.19% | ATH (6 Oct 2025) | EUR 107,662, currently -33.66% |
| Fed funds target | 3.75% to 4.00% (as of 2026-11-04) | ECB deposit rate | 2.50% (as of 2026-11-05) |
Calculations: supply issued is 20,105,365 / 21,000,000 = 95.74%. 24h turnover is 32.13bn / 1,436bn = roughly 2.24% of market cap. Reclaiming the ATH requires (107,662 – 71,422) / 71,422 = +50.75% from the current level.
Market Setup
The macro backdrop is neutral in risk sentiment with moderately negative equity momentum. DACH indicators average +1.10% over five days versus -0.40% for global equity indicators, with the DAX up 4.69% over one month. The Hang Seng posts the strongest five-day move at +5.91% while the Nikkei 225 is weakest at -5.39%. Euro area yields are mixed: the AAA 10Y yield stands at 3.35%, down 4.6 bp over five days, with a 10Y-2Y spread of 36.0 bp. FX is mixed, with EUR/USD at 1.1229 (+0.43% over five days) and EUR/JPY the strongest mover at +0.87%.
Policy is the key tension. The Fed funds target range is 3.75% to 4.00% after a 25 bp hike effective 17 September 2026, and the ECB deposit facility rate is 2.50% after a 25 bp hike effective 16 September 2026. This tightening tilt contradicts the easing narrative in a Grayscale outlook [T5], which argued that Fed cuts would support crypto in 2026. That view is a dated source expectation and is superseded by the observed September hikes. For Bitcoin, the opportunity cost of a zero-yield asset against a 3.35% euro AAA 10Y yield is a real headwind for EUR-based allocators.
Within crypto, ETF flows have become the dominant marginal driver. Record Q4 outflows from US-listed BTC and ETH ETFs coincided with Bitcoin breaking support around $98,000 and retesting the low $90,000s, according to [T1]. A record 30-day net outflow streak was also reported [T8]. More recently, $3.55 billion in weekly crypto fund inflows, led by Bitcoin, restored cumulative 2026 flows to positive, according to [T7]. The flow tape, not supply issuance, now sets the short-term price path.
Investment Thesis
Bitcoin is a flow-driven, institutionalizing scarce asset. The structural case rests on three pillars. First, scarcity: 95.74% of the 21 million supply cap is issued, and 6.7 million BTC, roughly 33% of circulating supply, sits across ETFs, exchanges and treasuries in what Glassnode called the “institutional supply era” [T1]. Second, market maturation: realized volatility has fallen from 84% to 43%, supporting the case for larger institutional allocations [T1]. Third, structural demand: ETF issuers must acquire physical Bitcoin to back share creation, making ETF demand a persistent bid even when flows turn negative [T4].
The cyclical case is weaker. The asset is down 21.19% year-on-year and trades a third below its ATH. Marginal price discovery is dominated by ETF flows that can reverse as quickly as they build [T4]. Regulatory clarity is the gating factor for compliance-constrained institutions, making US market-structure legislation the key swing variable into late 2026 [T3, T6]. The tightening policy backdrop, with the Fed at 3.75% to 4.00% and the ECB at 2.50% after September hikes, raises the hurdle rate for a non-yielding asset. The thesis works if flow momentum and regulatory progress persist; it fails if outflow streaks resume or legislation stalls.
Bullish Drivers
- Flow turnaround: $3.55 billion in weekly crypto fund inflows with Bitcoin leading restored 2026 cumulative flows to positive, according to [T7]. Confirmation requires several consecutive positive weeks, not one strong print.
- Institutional depth: 94% of institutional investors recognize long-term blockchain value, and daily ETF inflows previously exceeded $400 million, according to [T2]. These are dated source figures, not current readings.
- Structural ETF bid: share creation requires physical BTC purchases, anchoring demand even through drawdowns [T4].
- Supply scarcity: 95.74% of max supply issued, with no unlock overhang beyond mining issuance (bundle market data).
- Third-party targets: a JPMorgan flow-based model projects a $150,000 peak at 72% confidence targeting Q4 2026, and Ark Invest maintains $200,000 for 2026 and $1,000,000 by 2030, according to [T2]. Grayscale expects new crypto highs in 2026 on macro demand for alternative stores of value and regulatory clarity [T5]. All are dated third-party expectations, not forecasts.
- Regulatory catalyst: passage of US market-structure legislation could unlock compliance-constrained institutional capital [T3, T6].
Relative Positioning vs Gold and Ethereum
Within crypto, Bitcoin’s dominance of 59.54% of a EUR 2.41 trillion total market cap confirms it remains the systemic core of the asset class. A computed cross-check gives 1,436bn / 2,407bn = 59.66%; the small gap versus the reported 59.54% reflects timing differences between data pulls.
Against the designated benchmarks, the dataset has gaps. No current gold price and no current ETH price in EUR are available in the bundle, so gold/BTC and ETH/BTC ratios cannot be computed from primary data. The only ETH reference is $2,340.98 in [T6], a dated source figure in USD, not a current state. Qualitatively, Bitcoin’s commodity-like profile, with no issuer backing, supports cleaner regulatory treatment than Ethereum, whose staking mechanics complicate classification [T6]. Ark Invest’s thesis frames Bitcoin as capturing share from traditional store-of-value assets like gold [T2], while Grayscale’s macro demand argument benefits the alternative store-of-value complex broadly [T5]. If capital rotates toward altcoin ETPs, including the SOL and XRP pipeline [T3], BTC dominance could compress, favoring Ethereum and broader baskets relatively. Current gold and ETH prices are not in the dataset.
Scenario Framework
- Bull scenario: CLARITY Act progress plus consecutive weeks of positive ETF flows and a stable rate path drive a recovery toward the $100,000 to $150,000 zone cited in [T2]. At EUR/USD 1.1229, that zone implies roughly EUR 89,060 to EUR 133,590. This is an illustrative conversion of a dated third-party expectation, not a forecast. Reclaiming the ATH requires +50.75% from the current price.
- Base scenario: flows oscillate around breakeven and BTC consolidates in EUR terms between the 30-day downtrend and the drawdown zone, with dominance holding near 59.5%. Neutral risk sentiment and mixed euro yields support range conditions.
- Bear scenario: a renewed outflow streak (the pattern in [T8]), a legislative setback, or further central bank tightening triggers a retest of cycle lows. A prior CLARITY Act setback coincided with $450 million in single-day outflows and BTC below $76K, according to [T7]. Institutional participation amplifies downside as well as upside [T4].
Valuation Discussion
Bitcoin has no cash flows, so valuation rests on scarcity, flows and positioning. Market cap equals fully diluted valuation at EUR 1.436 trillion because 95.74% of supply is issued; there is no unlock overhang. Roughly 33% of circulating supply sits in ETFs, exchanges and treasuries [T1], which reduces float but concentrates flow sensitivity.
Drawdown positioning is the cyclical anchor: at EUR 71,422, Bitcoin is 33.66% below its October 2025 ATH, and Grayscale notes there was no dramatic surge this cycle [T5], suggesting less froth than prior peaks. Volatility normalization from 84% to 43% [T1] supports a higher institutional allocation in flow-based models. Third-party frameworks, including the JPMorgan $150,000 flow-based model and Ark’s $200,000 2026 milestone [T2], are dated expectations in USD; converting at EUR/USD 1.1229 is illustrative only. The opportunity cost argument cuts the other way: a 3.35% euro AAA 10Y yield against Bitcoin’s zero yield raises the hurdle for EUR-based allocators, and the September 2026 hikes by both the Fed and ECB reinforce that headwind.
Risks
- Flow reversal: a record 30-day ETF net outflow was reported [T8], and Q4 record outflows broke the $98,000 support level [T1]. Strong inflows do not guarantee price gains; macro shocks and derivatives liquidations can overwhelm flows [T7].
- Regulatory failure: delay or defeat of US market-structure legislation would postpone institutional allocations [T3, T6]. A prior CLARITY setback coincided with sub-$76K prints and $450 million outflows [T7].
- Policy tightening: the Fed funds range of 3.75% to 4.00% after a 25 bp hike effective 17 September 2026, and the ECB deposit rate of 2.50% after a 25 bp hike effective 16 September 2026, contradict the easing assumptions in [T5]. Further hikes would pressure risk appetite and crypto ETP demand.
- Treasury seller risk: Strategy (formerly MicroStrategy) has temporarily slowed purchases amid weaker financing conditions [T4], and DAT premiums have compressed [T5]. Stressed DAT financing could add structural supply on top of ETF redemptions.
- Two-way volatility: institutional participation amplifies drawdowns as well as rallies [T4].
- Concentration: at 59.54% dominance, a BTC-specific shock propagates across the entire crypto asset class.
Appendix
Methodology and Data Provenance
Market data derives from the bundle retrieved 2026-11-05T05:15Z; market overview data is as of 2026-11-04/05. Policy rates come from the authoritative Policy Rates block as of 2026-11-04 (Fed) and 2026-11-05 (ECB). Tavily sources T1 to T8 lack reliable publication dates; all third-party figures are quoted with explicit attribution and labeled as dated, not current. A material conflict exists: [T5] expects further Fed cuts, while the Policy Rates block shows a 25 bp hike effective 2026-09-17 with the range at 3.75% to 4.00%. The Policy Rates block is authoritative.
Missing Data Disclosure
No current gold price, no current ETH price in EUR, and no BTC-specific ETF flow time series are in the dataset. Benchmark ratios cannot be computed from primary data. The computed BTC share of total crypto market cap (59.66%) differs slightly from the reported dominance (59.54%) due to timing differences between data pulls.
Glossary
ETF/ETP: exchange-traded fund/product providing regulated exposure to crypto. DAT: digital asset treasury structure, a corporate vehicle holding crypto on balance sheet. FDV: fully diluted valuation, price multiplied by maximum supply. ATH/ATL: all-time high/low. BTC dominance: Bitcoin’s share of total crypto market capitalization. CLARITY Act: proposed US market-structure legislation defining regulatory responsibilities for digital assets. Deposit facility rate: the ECB’s key policy rate for bank overnight deposits.
Sources
- [T1] Crypto Market 2025: Year-End Review & Expert Insights, TradingView News
- [T2] Bitcoin Price Prediction 2026: Institutional Adoption & ETF Impact Analysis, Intellectia
- [T3] Crypto ETFs Enter a New Phase in September, Bitcoin Foundation
- [T4] Bitcoin Outlook: ETF Outflows, Institutional Adoption & Price Forecast 2026, IG South Africa
- [T5] 2026 Digital Asset Outlook: Dawn of the Institutional Era, Grayscale Research
- [T6] U.S. Crypto Market Structure Reform, Bitcoin Foundation
- [T7] Crypto Funds See $3.55B Inflows: Bitcoin Leads as Ethereum and Solana Surge, Bitcoin Foundation
- [T8] Bitcoin ETF Flows Remain a Key Market Driver, moomoo Community
Disclaimer
This report is AI-generated and provided for informational purposes only. It does not constitute investment advice, a recommendation, or an offer to buy or sell any financial instrument. Figures marked as third-party expectations or scenario illustrations are dated source statements, not current market states or forecasts. Readers should conduct their own due diligence and consult a licensed advisor before making investment decisions.
Important Note / Wichtiger Hinweis:
EN: This report may have been generated using AI. It processes data from publicly available sources. The content is provided for informational purposes only.DE: Dieser Bericht kann mithilfe von KI erstellt worden sein. Dabei werden Daten aus öffentlich zugänglichen Quellen verarbeitet. Die Inhalte dienen ausschließlich Informationszwecken.
* DE: Die ergänzenden Inhalte können KI-generiert sein. EN: The additional content may be AI-generated.