
Watch the video
This player shows only the Bitcoin chapter of the daily altii market briefing. Watch the full video on tube.altii.de.
Key Data Snapshot
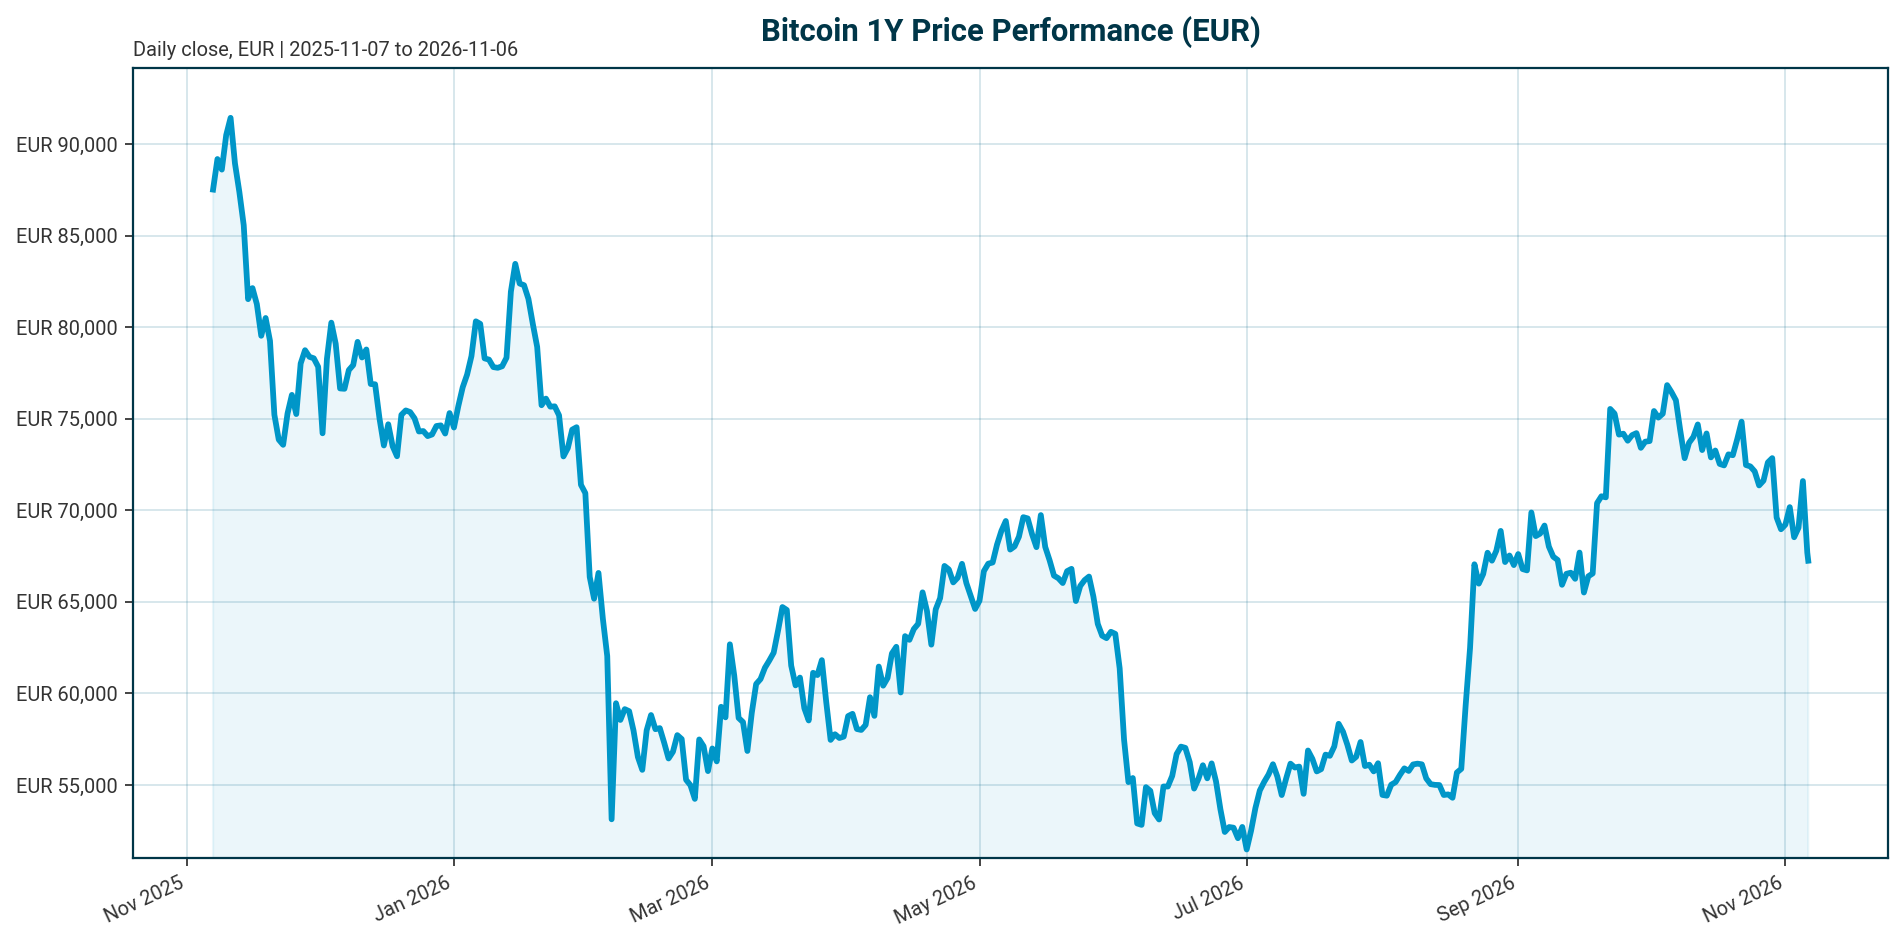
Bitcoin (BTC) trades at EUR 67,444 as of 6 November 2026, down 5.55% over 24 hours and 37.36% below its all-time high of EUR 107,662 set on 6 October 2025. The 24-hour range of EUR 67,174 to EUR 72,078 spans a 7.30% high-to-low spread, calculated as (72,078 − 67,174) / 67,174, signalling elevated intraday volatility. Daily turnover of EUR 39.63 billion equals 2.92% of market cap.
| Metric | Value |
|---|---|
| Price (EUR) | 67,444 |
| 24h change | -5.55% |
| 7d / 14d / 30d change | -3.03% / -7.45% / -10.03% |
| 200d / 1y change | +1.40% / -26.94% |
| Market cap (EUR) | 1.356 trillion (rank 1) |
| 24h volume (EUR) | 39.63 billion |
| ATH (EUR, 2025-10-06) | 107,662 (price -37.36% below) |
| BTC dominance | 59.16% |
| Circulating / max supply | 20,105,365 / 21,000,000 (95.74% issued) |
| Fed funds target range | 3.75% to 4.00% (as of 2026-11-05); last change: hike of 25 bp, effective 2026-09-17 |
| ECB deposit facility rate | 2.50% (as of 2026-11-06); last change: hike of 25 bp, effective 2026-09-16 |
Performance is negative across the 24h, 7d, 14d, 30d and 1y horizons. Only the 200-day change is marginally positive at +1.40%, indicating the longer-term uptrend has flattened but not fully rolled over. Fully diluted valuation equals market cap, so there is no dilution overhang; price discovery is flow-driven, not supply-driven.
Market Setup
The cross-asset backdrop is neutral to negative on risk sentiment, with equity momentum broadly negative. US indices are under acute pressure: the S&P 500 fell 4.36% and the Nasdaq Composite 5.52% on 5 November, while the Nikkei 225 is the weakest 5-day performer at -9.09%. DACH indicators are outperforming, averaging +1.69% over 5 days versus -3.01% for global equity indicators, with the DAX up 3.44% on a 1-month basis. Rates are mixed: the euro area AAA 10Y yield stands at 3.34%, down 3.3 bp over 5 days and 16.2 bp over 1 month, with the AAA 10Y-2Y spread at 34.2 bp. FX is mixed, with EUR/USD at 1.1251 (+0.54% over 5 days) and EUR/JPY the strongest 5-day mover at +0.89%. Policy is a headwind, not a tailwind: the Fed funds target sits at 3.75% to 4.00% after a 25 bp hike effective 2026-09-17, and the ECB deposit rate at 2.50% after a 25 bp hike effective 2026-09-16. For a EUR-based Bitcoin investor, the hawkish policy stance and global equity drawdown dominate the setup; DACH equity outperformance offers no direct support to BTC.
Investment Thesis
Bitcoin operates in an institutional-flow-led regime. ETF flows have effectively become its new macro indicator: every repricing of the Fed’s policy path — including shifts in market-implied rate expectations — and every spike in ETF redemptions has shown up almost immediately in crypto prices, according to Alexander Zahnd in the TradingView year-end review [T2]. The Q2 2026 record confirms the mechanism: spot BTC ETFs saw USD 4.67 billion in net redemptions, the largest quarterly outflow since spot products launched in January 2024, with June alone a record redemption month. The pattern was read as institutional profit-taking and rotation into traditional markets rather than a structural exit [T1].
The structural picture is firmer than the cyclical one. Glassnode counted 6.7 million BTC held across ETFs, exchanges and treasuries at end-2025, roughly 33.32% of current circulating supply (6,700,000 / 20,105,365), a level it described as Bitcoin’s institutional supply era [T2]. Regulation is the swing variable: the CLARITY Act failed to advance in the Senate in September, and midterm election outcomes could either revive or further delay US market-structure legislation [T8]. The most recent flow signal is cautiously positive: Bitcoin ETFs attracted USD 74.6 million on 4 November after three consecutive sessions of withdrawals, according to a crypto.news report from November 2026 [T6].
Thesis in one line: near-term momentum is negative and policy is a headwind — the latest Fed decision was a 25 bp hike to a 3.75% to 4.00% target range, effective 2026-09-17 — but the flow infrastructure and institutional access channels keep deepening. A sustained return to positive ETF net flows is the key signal to watch [T1].
Bullish Drivers
- Platform access widening. Morgan Stanley expanded client access to regulated bitcoin products including spot ETFs, and Vanguard added third-party bitcoin ETFs to its platform in Q4, according to ARK’s article from February 2026 [T7].
- Rotation capacity. ARK argued, in the same February 2026 piece, that more than USD 10 trillion in lower-yielding money-market and fixed-income ETFs could rotate into risk assets [T7]. Important caveat: this thesis, published in February 2026, assumed a Fed easing cycle. The actual latest decision was a 25 bp hike effective 2026-09-17, taking the target range to 3.75% to 4.00%, which weakens the driver unless policy pivots.
- Regulatory catalyst potential. Market-structure clarity from a revived CLARITY Act could remove a major barrier for institutional allocations; a September 15 vote had been flagged as a key sentiment catalyst before the bill stalled [T5], [T8].
- State and sovereign adoption. Texas is buying and adding bitcoin to reserves, with discussions ongoing on adding bitcoin to government reserves and managing seized holdings [T7]. Pension funds are gradually adding ETF positions, and sovereign wealth funds and central banks have appeared as ETF holders in 13F filings, though positions remain modest [T4].
- 2026 expansion projections. Corporate holdings surpassing USD 250 billion, more than 100 new crypto-linked ETFs, and potential volatility compression are projected for 2026, per a Blockchain Council analysis [T3].
- Flow recovery signals. Strong August inflows across major crypto ETF products improved the outlook into September [T5], and the 4 November inflow of USD 74.6 million after three down sessions suggests institutional interest remains intact [T6].
Relative Positioning vs Gold and Ethereum
vs Gold. No gold price is present in the dataset, so the comparison is necessarily qualitative. In a hawkish-hold regime with both the Fed and ECB having hiked in September 2026 and equity momentum broadly negative, gold would typically be favoured over BTC: gold carries no flow-sensitivity to ETF redemptions and benefits from the same de-sovereignisation demand. Bitcoin’s -26.94% one-year return in EUR terms frames the relative-performance burden. The counterargument is structural: Bitcoin’s volatility has compressed from 84% to 43% according to the Glassnode x Fasanara 2025 report [T2], narrowing but not closing the risk gap versus gold. The Block takes the opposing view that institutional adoption has not made bitcoin less volatile but has tied it more closely to traditional macro and credit cycles [T4]. Both views are presented here as contested.
vs Ethereum. Ethereum ETFs recorded USD 690 million in net outflows in Q2 2026, moving in tandem with Bitcoin’s redemptions [T1], confirming that crypto flows are currently a single risk factor rather than an asset-specific one. Bitcoin’s 59.16% dominance and first-mover ETF infrastructure position it as the primary allocation vehicle when institutional capital returns. Two dilution risks apply: ETF expansion is broadening to Solana, XRP and other altcoin products, which could fragment institutional crypto demand at the margin [T5]; and in Asia, pure bitcoin ETF plays a smaller strategic role than in North America and Europe, where tokenization and stablecoin frameworks such as Hong Kong’s Stablecoins Ordinance dominate institutional entry points [T1].
Scenario Framework
All scenarios below are assumptions, not forecasts or decisions. Three trigger variables govern outcomes: the Fed path (target range 3.75% to 4.00% after the 25 bp hike effective 2026-09-17), CLARITY Act progress (failed to advance in the Senate in September [T8]), and ETF flow sustainability (Q2 net redemptions of USD 4.67 billion [T1]; 4 November inflow of USD 74.6 million [T6]).
- Bull scenario (assumption). CLARITY-style legislation is revived post-midterms, ETF inflows re-accelerate sustainably, and the Fed signals easing. Sidelined institutional capital re-enters, and BTC recovers meaningfully toward its ATH zone. Probability is qualitatively lower while the Fed holds at 3.75% to 4.00%. Under Chair Kevin Warsh, the central bank was expected to hold rates through Q3, per the CoinDesk Q2 review from July 2026, a dated expectation rather than current consensus [T1].
- Base scenario (assumption). Fed on hold, regulation delayed but not dead, ETF flows choppy around flat. BTC-EUR consolidates in its current drawdown range, 37.36% below ATH and -10.03% over 30 days, with two-way volatility driven by daily flow prints.
- Bear scenario (assumption). Renewed ETF redemption streaks, further Fed tightening, and regulatory drift compound. BTC breaks below recent lows, echoing the Q4 2025 pattern in which record ETF outflows coincided with Bitcoin breaking support around USD 98,000 and retesting the low USD 90,000 range, per the TradingView year-end review [T2].
Valuation Discussion
Bitcoin has no earnings, cash flow or yield basis, so DCF frameworks do not apply. Valuation rests on scarcity, adoption and flow positioning. On scarcity: 20,105,365 of 21,000,000 BTC are issued (95.74%), and fully diluted valuation equals market cap at EUR 1.356 trillion, so there is no dilution overhang. On positioning: roughly 33.32% of circulating supply (6.7 million of 20.1 million BTC) sat in ETFs, exchanges and treasuries at end-2025 per Glassnode [T2]. With supply fixed in the short run, this concentration cuts both ways. Each marginal ETF inflow dollar carries outsized price impact in a float-constrained market; equally, persistent outflows amplify drawdowns beyond what retail-era dynamics would imply. The current 37.36% drawdown from ATH with a 7.30% intraday range is consistent with exactly this flow-dominated regime. On the volatility debate, the compression from 84% to 43% [T2] is contested by the view that institutionalisation ties BTC to macro cycles without reducing volatility [T4]; investors should not treat lower realised volatility as a permanent regime feature. No on-chain, derivatives positioning or funding-rate data are available in this dataset, so market-structure valuation relies on secondary source claims.
Risks
- Policy risk. The Fed hiked 25 bp effective 2026-09-17 to a 3.75% to 4.00% target range, and the ECB hiked 25 bp effective 2026-09-16 to a 2.50% deposit rate. Further tightening or a prolonged hold removes the easing tailwind that historically supported crypto recoveries. A further Fed hike would likely re-ignite ETF redemptions given the demonstrated sensitivity of crypto prices to Fed repricing (scenario assumption) [T2].
- Regulatory and political risk. The CLARITY Act failed to advance in the Senate in September, and a shift in congressional control after the midterms could complicate revival or increase scrutiny [T8]. Divided government could increase policy uncertainty and weigh on Bitcoin [T6].
- Concentration risk. ETF assets are concentrated in a handful of issuers, raising market-structure questions if any issuer experiences operational stress; an issuer failure would be a systemic event (scenario assumption) [T4].
- Custody and operational risk. Hacks and internal exploits remain a risk even with qualified custodians; compromised credentials, excessive internal permissions and connected applications are cited institutional exposure points [T4], [T6].
- Macro-correlation risk. Institutional adoption has tied BTC more closely to traditional macro and credit cycles than in the retail era [T4]. The current global equity drawdown, with the Nasdaq down 5.52% and the Nikkei down 9.09% over 5 days, transmits directly.
- Treasury-strategy risk. Treasury-leveraged equity strategies have shown amplified drawdowns relative to the underlying token [T4].
Appendix
Methodology and provenance. All BTC metrics come from the bundle market data, retrieved 2026-11-06T05:15:12Z, quoted in EUR. Policy rates come exclusively from the authoritative Policy Rates block: Fed funds target range 3.75% to 4.00% as of 2026-11-05, last change a 25 bp hike effective 2026-09-17; ECB deposit facility rate 2.50% as of 2026-11-06, last change a 25 bp hike effective 2026-09-16. Cross-asset context (equities, ECB yield curve, FX) is from the market overview, as of 2026-11-04 to 2026-11-06.
Calculations shown. Supply issued: 20,105,365 / 21,000,000 = 95.74%. Drawdown from ATH: (67,444 − 107,662) / 107,662 = -37.36%. Daily turnover: 39,632,824,474 / 1,356,022,661,985 = 2.92%. Intraday range: (72,078 − 67,174) / 67,174 = 7.30%. Institutional supply share: 6,700,000 / 20,105,365 = 33.32% (from [T2], dated end-2025). The computed BTC market-cap share of total crypto market cap is 59.30% in EUR terms versus a reported dominance of 59.16%; the small difference likely reflects USD versus EUR denomination and is flagged rather than reconciled.
Data gaps and dating caveats. No gold price or Ethereum price is present in the dataset, so the relative-value section is qualitative. No on-chain metrics beyond the 6.7 million BTC figure, no derivatives positioning, and no funding-rate data are available. Several Tavily items lack publication dates; dating is inferred from content and flagged inline. T1 is a Q2 2026 review from July 2026. T7 is dated February 11, 2026, and its easing thesis predates the September 2026 Fed hike, so it is presented as a dated opinion, not current state. T6 references flows from 4 November 2026. ETF flow figures are in USD and are not converted to EUR because no dated FX rate for the historical periods is available.
Sources
- [T1] Q2 2026 Digital Asset Review, CoinDesk Indices: link
- [T2] Crypto Market 2025: Year-End Review & Expert Insights, TradingView News: link
- [T3] Crypto Analysis for 2026: Bitcoin, ETFs, Regulation, Blockchain Council: link
- [T4] Institutional Bitcoin Adoption Explained: How Blackrock, Fidelity and Others Embraced BTC, The Block: link
- [T5] Crypto ETFs Enter a New Phase in September: Here’s What Investors Should Watch, Bitcoin Foundation: link
- [T6] Bitcoin ETF inflows return as US crypto legislation faces delays, crypto.news: link
- [T7] Bitcoin’s Evolving Institutional Role, ARK Invest (February 11, 2026): link
- [T8] $1 Billion Flows Out of Bitcoin ETFs as Midterm Elections Put Trump’s Crypto Agenda to the Test, TradingView News: link
Disclaimer. This report is AI-generated and for informational purposes only. It does not constitute investment advice, a recommendation, or an offer to buy or sell any asset. All forward-looking statements are scenario assumptions. Data may be incomplete or subject to revision.
Important Note / Wichtiger Hinweis:
EN: This report may have been generated using AI. It processes data from publicly available sources. The content is provided for informational purposes only.DE: Dieser Bericht kann mithilfe von KI erstellt worden sein. Dabei werden Daten aus öffentlich zugänglichen Quellen verarbeitet. Die Inhalte dienen ausschließlich Informationszwecken.
* DE: Die ergänzenden Inhalte können KI-generiert sein. EN: The additional content may be AI-generated.