
Watch the video
This player shows only the Bitcoin chapter of the daily altii market briefing. Watch the full video on tube.altii.de.
Key Data Snapshot
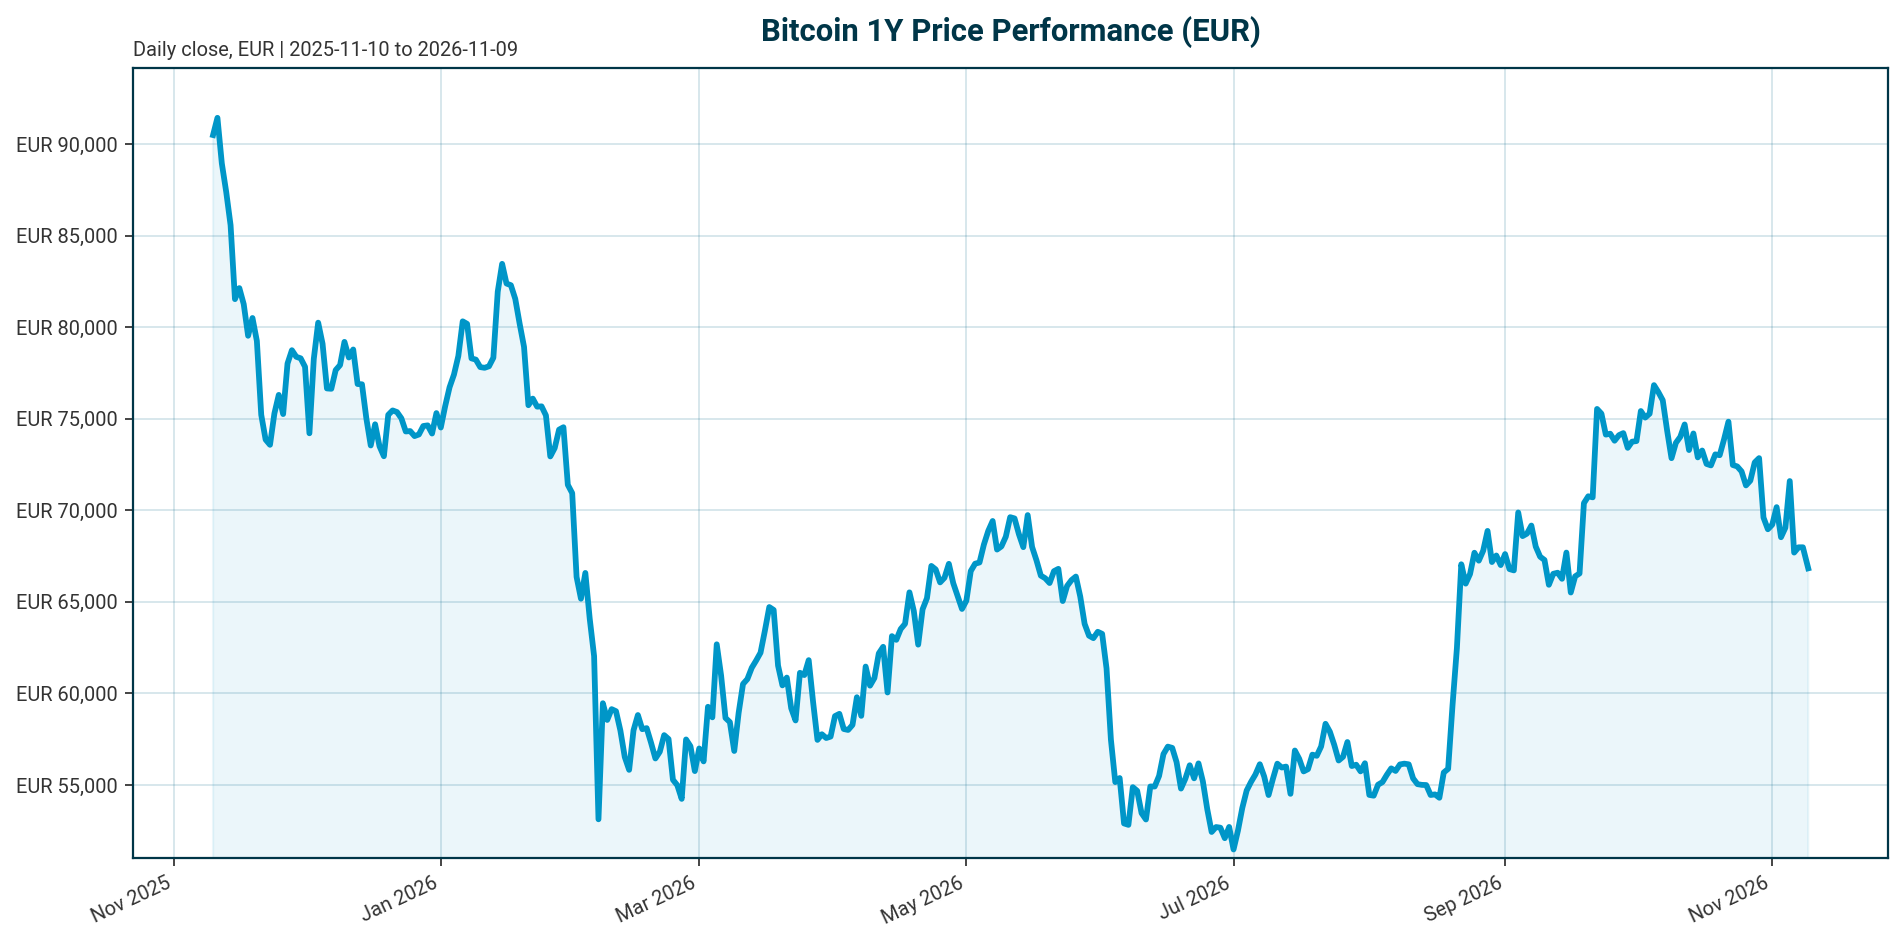
| Metric | Value | Comment |
|---|---|---|
| Price (BTC/EUR) | EUR 66,829.00 | 24h range EUR 66,275 to 68,195 |
| 24h change | -1.72% | 1h -0.09% |
| 7d / 14d / 30d change | -4.86% / -6.01% / -9.44% | Confirmed downtrend across horizons |
| 200d / 1y change | -3.85% / -26.47% | Price near longer-term trend, deep YoY loss |
| All-time high | EUR 107,662 (2025-10-06) | Current price -37.93% below ATH |
| Market cap | EUR 1.344 trillion | Rank 1; FDV equals market cap |
| 24h volume | EUR 18.80 billion | ~1.40% of market cap daily turnover |
| BTC dominance | 60.14% | Of EUR 2.23 trillion total crypto market cap |
| Circulating supply | 20,109,759 BTC | 95.76% of 21,000,000 max supply issued |
| Fed funds target range | 3.75% to 4.00% (as of 2026-11-08) | Last change: hike of 25 bp, effective 2026-09-17 |
| ECB deposit facility rate | 2.50% (as of 2026-11-09) | Last change: hike of 25 bp, effective 2026-09-16 |
| Euro area AAA 10Y yield | 3.29% | -7.1 bp over 5 days; +34.6 bp YTD |
| EUR/USD | 1.1198 | -0.45% over 5 days; -4.70% YTD |
Calculations: supply issued = 20,109,759 / 21,000,000 = 95.76%. Drawdown from ATH = (66,829 – 107,662) / 107,662 = -37.93%. Market cap check: 66,829 x 20,109,759 = EUR 1.344 trillion, consistent with the reported figure. Implied USD price cross-check: EUR 66,829 / 1.1198 = approximately USD 59,680; USD-quoted news levels must not be conflated with EUR prices.
Market Setup
The cross-asset backdrop is neutral to negative for risk. Equity momentum is broadly negative: the S&P 500 is down 5.45% and the Nasdaq Composite down 10.75% over one month, while the Nikkei 225 is the weakest 5-day performer at -6.26%. DACH indicators are outperforming, averaging -0.27% over 5 days versus -1.66% for global peers, with the DAX leading on a 1-month basis at +2.85% despite a -1.92% daily move. The Hang Seng is the strongest 5-day performer at +4.14%.
Rates are the key headwind. The Fed funds target range stands at 3.75% to 4.00% after a 25 bp hike effective 2026-09-17, and the ECB deposit facility rate at 2.50% after a 25 bp hike effective 2026-09-16. Euro area AAA 10Y yields at 3.29% keep the opportunity cost of a zero-yield asset elevated, and the 2Y yield is up 85 bp YTD. FX is mixed: EUR/USD at 1.1198 (-0.45% over 5 days, -4.70% YTD) means EUR-denominated BTC returns carry a modest translation effect on USD-quoted flows. For Bitcoin specifically, this regime transmits directly: institutionalization has tied BTC more closely to traditional macro cycles than during the retail era [T4], so the equity drawdown and restrictive policy stance are first-order drivers, not background noise.
Investment Thesis
Bitcoin is a structurally institutionalized asset in a cyclical, flow-driven drawdown. The price of EUR 66,829 sits 37.9% below the October 2025 ATH despite a full institutional infrastructure of ETFs, digital asset treasuries and regulatory frameworks that prior cycles lacked [T6]. The defining question for this cycle, as XWIN Research Japan frames it, is that the infrastructure has been built but the sustained spot demand that converts it into a durable bull market has not yet arrived [T6].
The evidence for the institutional regime is substantial. By end-2025, 6.7 million BTC sat across ETFs, exchanges and treasuries, which Glassnode described as Bitcoin’s “institutional supply era” [T2]. Volatility declined from 84% to 43% per the Glassnode x Fasanara 2025 report, though institutionalization has tied BTC more tightly to macro and credit cycles rather than eliminating risk [T2] [T4]. In 2025, every repricing of Fed policy and every ETF redemption spike showed up almost immediately in crypto prices [T2].
The investment case therefore rests on flow re-acceleration. Base case: BTC consolidates in a wide EUR 62,000 to 75,000 range while ETF flows stabilize, with the thesis remaining constructive on a 12-month horizon if flows turn positive. Bull case: CLARITY Act passage plus a Fed pivot toward easing re-ignites institutional flows toward a retest of the ATH region. Bear case: continued outflows and negative Coinbase Premium readings extend the drawdown toward deeper cyclical lows. These are scenario assumptions, not forecasts.
Bullish Drivers
- Regulatory catalyst. The CLARITY Act would establish a federal market-structure framework for digital assets and could unlock broader institutional participation if passed [T1]. Clearer rules would remove a major barrier for allocators whose internal approval processes require defined regulatory responsibilities [T5].
- Distribution channel expansion. Morgan Stanley expanded client access to regulated bitcoin products including spot ETFs, and Vanguard added third-party bitcoin ETFs to its platform in Q4 2025, a notable reversal after years of excluding crypto and commodities [T7].
- Sovereign and state-level adoption. Discussions on adding bitcoin to government reserves, treatment of seized federal holdings, and state-level purchases with Texas leading the way [T7].
- Rotation capital. ARK identifies more than USD 10 trillion in lower-yielding money-market and fixed-income ETFs as potential rotation capital into risk assets (ARK, February 2026) [T7].
- Deepening market structure. Projections of corporate holdings surpassing USD 250 billion and more than 100 new crypto-linked ETFs signal continued structural build-out (Blockchain Council, 2026) [T3].
- Sell-side constructive view. Grayscale’s 2026 outlook expects macro demand for alternative stores of value plus regulatory clarity to drive institutional inflows and sees conditions for new highs (Grayscale Research, 2026) [T8]. This is a sell-side view to be weighed against the flow evidence.
Relative Positioning vs Gold and Ethereum
Data gap disclosure: the bundle contains no current gold or Ethereum price data, so relative performance figures are unavailable. Positioning must rely on qualitative flow evidence.
Versus gold: both compete for the alternative store-of-value allocation, but elevated real yields (euro AAA 10Y at 3.29%) raise the opportunity cost of all non-yielding stores of value [T8]. In a risk-off extension, gold-type assets would likely retain a relative advantage given BTC’s increased macro-cycle correlation [T4]. Versus Ethereum: ETH spot ETFs recorded USD 690 million in net outflows in Q2 2026, moving in tandem with Bitcoin products, which indicates shared flow sensitivity rather than idiosyncratic ETH weakness [T1]. Grayscale’s framework expects institutional adoption to favor tokens with clear use case, sustainable revenue and regulated venue access, which partially favors ETH’s utility profile over BTC’s monetary premium narrative [T8]. In a flow-recovery regime, BTC’s dominance at 60.14% and deeper ETF liquidity would likely recapture share from ETH and altcoin products first, mirroring the Q2 pattern where ETH outflows followed BTC outflows [T1]. Altcoin ETF expansion (SOL and XRP products in the pipeline) could fragment institutional crypto allocations at Bitcoin’s margin [T5].
Scenario Framework
All probabilities are subjective analyst assumptions for structuring the report, not derived from the dataset. The current anchor is BTC at EUR 66,829, -37.9% from ATH, with the 200-day change at -3.85%.
- Base case (~50%): rates on hold at current levels (Fed 3.75% to 4.00%, ECB 2.50%) and ETF flows oscillate around flat. BTC trades EUR 60,000 to 75,000 with gradual floor-building as the supply overhang clears. The floor sits approximately 10.2% below spot.
- Bull case (~25%): CLARITY Act progress plus a dovish Fed repricing re-ignites inflows. BTC reclaims EUR 80,000 to 95,000 and targets a retest of the EUR 107,662 ATH on sustained positive weekly flows. The EUR 95,000 target is approximately 42% above spot.
- Bear case (~25%): continued institutional redemptions, persistent negative Coinbase Premium readings and an extension of the global equity drawdown push BTC below EUR 55,000. The 2025 pattern of outflow spikes breaking key support levels repeats [T2].
Flow context for the scenarios: Q2 2026 saw USD 4.67 billion in net spot Bitcoin ETF redemptions, the largest quarterly outflow since spot products launched in January 2024 (CoinDesk Indices, July 2026) [T1]. Bitcoin ETFs flipped negative for 2026 after a USD 1.28 billion outflow week, the worst since June, according to The Block dated Nov 07, 2026 [T4]. Note that a July 2026 expectation of Fed holds through Q3 under Chair Kevin Warsh [T1] has been overtaken by the actual 25 bp hike effective 2026-09-17 recorded in the policy rates block; the hike is the current fact, the hold expectation is stale. Any future rate moves discussed here are market expectations or scenario assumptions, not decisions.
Valuation Discussion
Cashflow-based valuation models are inapplicable to Bitcoin; the assessment rests on supply structure, flow evidence and cycle framing. With 95.76% of max supply issued and annual issuance a de minimis fraction of the EUR 1.34 trillion float, price is a pure flow-versus-stock equation. Market cap equals FDV, so there is no unlock overhang from supply schedule mechanics.
The stock side offers potential support: roughly one-third of supply, 6.7 million BTC, was held across ETFs, exchanges and treasuries at end-2025 per Glassnode [T2], implying a large sticky institutional cost basis. If that cost basis sits above spot, forced or discretionary de-risking could extend the drawdown; if below, the same holdings act as a valuation floor. The flow side is currently negative: the Coinbase Premium Index has repeatedly fallen into negative territory in 2026 and exchange stablecoin dry powder has declined, suggesting current prices are not being defended by fresh US institutional spot demand [T6].
The 37.9% drawdown from ATH is within the range of historical BTC cyclical drawdowns. The institutional-era question is whether drawdown depth compresses over time as the holder base matures [T6] [T8]. Grayscale argues cyclical drawdowns are possible but sees 2026 fundamentals as supportive of new highs [T8]. Valuation support here is flow-contingent, not intrinsic: a return to two consecutive months of positive net ETF creations would be the minimum evidence threshold for calling the drawdown complete.
Risks
- Policy risk. Further Fed or ECB hikes from current levels (Fed 3.75% to 4.00%, ECB 2.50%) would directly raise the opportunity cost of BTC. The September 2026 hikes show the direction of travel was restrictive, not accommodative.
- Flow risk. ETF outflows have become the dominant marginal price driver. The USD 1.28 billion outflow week in early November 2026 (The Block, Nov 07, 2026) shows the flow regime remains negative [T4].
- Regulatory risk. Failure or dilution of the CLARITY Act would remove the primary regulatory catalyst and could delay institutional allocations indefinitely [T1] [T4].
- Custody and operational risk. Hacks and internal exploits at qualified custodians remain a live risk to institutional funds even with qualified custodian arrangements [T4].
- Concentration risk. ETF assets concentrated in a handful of issuers creates market-structure vulnerability if any major issuer experiences operational stress [T4].
- Macro-coupling risk. Institutionalization has tied BTC more tightly to traditional macro and credit cycles; treasury-leveraged equity strategies have shown amplified drawdowns relative to the underlying token [T4].
- Demand-gap risk. Negative Coinbase Premium readings and shrinking stablecoin dry powder indicate a spot-demand shortfall beneath the institutional adoption narrative [T6].
Appendix
Methodology and data provenance. All BTC market data from CoinGecko via the report bundle, retrieved 2026-11-09T05:15:09Z, quoted in EUR. Policy rates from the bundle’s authoritative policy rates block: Fed funds target range 3.75% to 4.00% (as of 2026-11-08, FRED source); ECB deposit facility rate 2.50% (as of 2026-11-09, ECB source). Equities, rates and FX data from bundle market overview data points (STOXX, Wiener Boerse, FMP, ECB yield curve, Frankfurter FX), as of 2026-11-05 to 2026-11-09. News-derived figures carry their source dates inline. The bundle’s BTC dominance figure (60.14%) and the ratio computed from market caps (1,343,917,907,551 / 2,226,172,637,976 = 60.35%) differ slightly due to retrieval timing; the bundle figure is used. No current gold or Ethereum price data is available in the dataset. No October 2026 monthly ETF flow totals are available; the current flow regime is described with dated attribution only.
Glossary. Spot ETF net flows: net creations minus redemptions of US-listed spot Bitcoin ETFs. Digital asset treasury (DAT): a corporate structure holding digital assets on its balance sheet. Coinbase Premium Index: the price gap between Coinbase, the primary venue for US institutional spot buying, and offshore exchanges; negative readings signal absent US spot demand. Exchange stablecoin ratio: a measure of stablecoin “dry powder” on exchanges available for spot deployment. BTC dominance: Bitcoin’s share of total crypto market capitalization. CLARITY Act: proposed US federal market-structure legislation for digital assets.
Sources
- [T1] Q2 2026 Digital Asset Review, CoinDesk Indices: link
- [T2] Crypto Market 2025: Year-End Review & Expert Insights, TradingView News: link
- [T3] Crypto Analysis for 2026: Bitcoin, ETFs, Regulation, Blockchain Council: link
- [T4] Institutional Bitcoin Adoption Explained: How Blackrock, Fidelity and Others Embraced BTC, The Block: link
- [T5] Crypto ETFs Enter a New Phase in September: Here’s What Investors Should Watch, Bitcoin Foundation: link
- [T6] Bitcoin’s 2026 Market Structure Reveals A Problem Hidden Beneath ETF Growth, TradingView News: link
- [T7] Bitcoin’s Evolving Institutional Role, ARK Invest: link
- [T8] 2026 Digital Asset Outlook: Dawn of the Institutional Era, Grayscale Research: link
Disclaimer. This report is AI-generated, for informational purposes only, and does not constitute investment advice. It should not be relied upon as a basis for any investment decision. Figures are drawn from the cited sources and may be incomplete, delayed or subject to revision.
Important Note / Wichtiger Hinweis:
EN: This report may have been generated using AI. It processes data from publicly available sources. The content is provided for informational purposes only.DE: Dieser Bericht kann mithilfe von KI erstellt worden sein. Dabei werden Daten aus öffentlich zugänglichen Quellen verarbeitet. Die Inhalte dienen ausschließlich Informationszwecken.
* DE: Die ergänzenden Inhalte können KI-generiert sein. EN: The additional content may be AI-generated.