
Watch the video
This player shows only the Bitcoin chapter of the daily altii market briefing. Watch the full video on tube.altii.de.
Key Data Snapshot
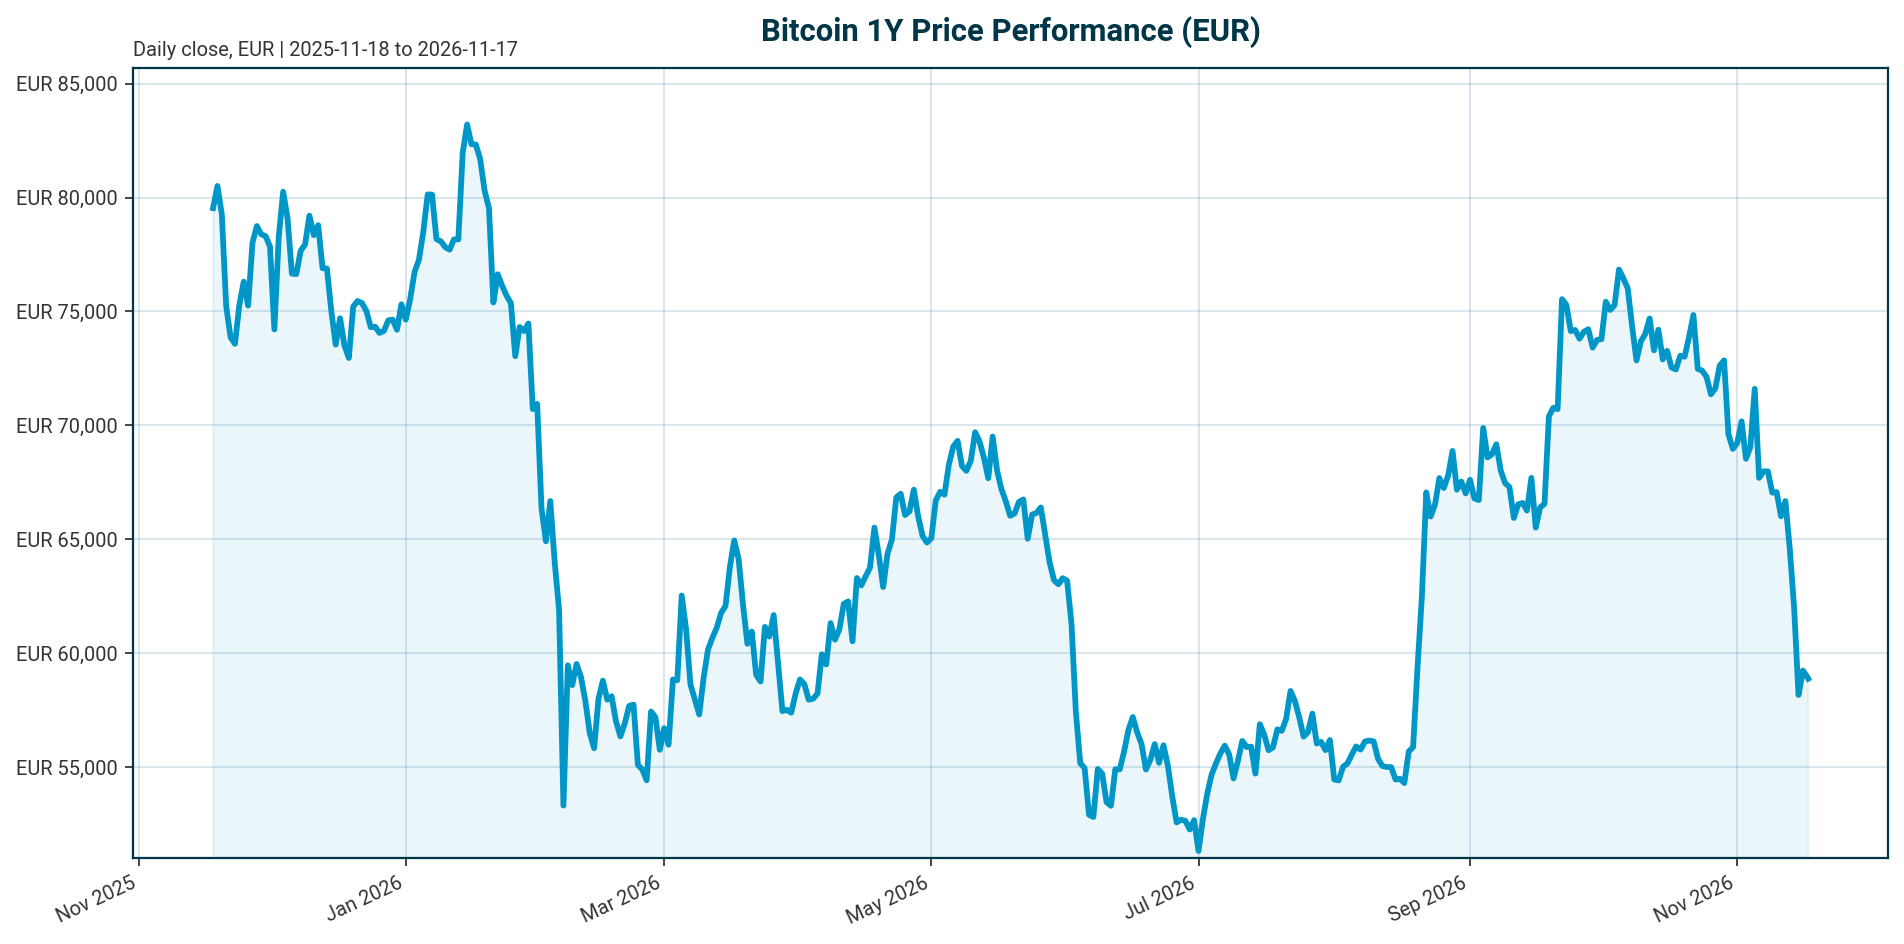
Bitcoin trades at EUR 58,853 as of 2026-11-17 (05:15 UTC). The asset remains in a sustained drawdown across every horizon beyond 24 hours, with the 30-day decline of 20.57% the sharpest leg. The 24-hour move of +0.34% is marginal and does not signal a trend reversal.
| Metric | Value |
|---|---|
| Price (EUR) | 58,853 |
| 24h range (EUR) | 58,040 to 59,514 |
| 24h / 7d / 14d change | +0.34% / -12.68% / -15.35% |
| 30d / 200d / 1y change | -20.57% / -15.64% / -31.84% |
| Market cap (EUR) | 1.184 trillion (rank 1) |
| 24h volume (EUR) | 30.31 billion |
| All-time high (EUR) | 107,662 on 2025-10-06; current price -45.34% below |
| Circulating / max supply | 20,113,162 / 21,000,000 (95.78% issued) |
| BTC dominance | 58.48% |
| Total crypto market cap (EUR) | 2.018 trillion |
Key calculations: drawdown from ATH = (58,853 / 107,662) – 1 = -45.34%. Daily turnover = 30.31bn / 1,184bn = ~2.56% of market cap, indicating functional liquidity. Momentum decay: the 7d return (-12.68%) accounts for most of the 14d decline (-15.35%), meaning selling pressure has intensified in the past week rather than faded. Unissued supply stands at 886,838 BTC.
Market Setup
The cross-asset backdrop is neutral to negative for risk. Global equity momentum is moderately negative: the S&P 500 is down 1.39% and the Nasdaq Composite down 2.22% over five days, with the Nasdaq off 6.24% over one month. DACH equities are outperforming, with the DAX up 0.95% over five days and 3.81% over one month, and DACH indicators averaging +0.33% over five days versus -2.61% for global peers. The FX backdrop is mixed: EUR/USD sits at 1.1034, down 0.39% over five days and 6.09% year-to-date, which cushions EUR-quoted BTC losses relative to USD pricing.
Rates remain the binding constraint. The Fed funds target range stands at 3.75% to 4.00% as of 2026-11-16, following a 25 bp hike effective 2026-09-17. The ECB deposit facility rate is 2.50% as of 2026-11-17, following a 25 bp hike effective 2026-09-16. Euro area AAA 10Y yields rose 14.0 bp over five days to 3.41% (as of 2026-11-13), and the AAA 2Y is up 96.3 bp year-to-date, the largest move on the curve. The 10Y-2Y spread sits at 34 bp. This is a restrictive liquidity environment for a zero-yield, duration-sensitive asset like Bitcoin. For context, a July 2026 review [T1] reported market expectations that the Fed would hold rates through Q3 under Chair Warsh; that expectation has since been overtaken by the actual September hike, so it should not be read as a current view. No further policy decisions are in the dataset.
Investment Thesis
Bitcoin has matured into an ETF- and macro-driven institutional asset. Its marginal price is now set by regulated capital flows rather than retail speculation, and the current drawdown reflects a liquidity unwind inside that regime, not a failure of the structural adoption story. Both sides of that equation carry weight.
The flow evidence is unambiguous on sensitivity. ETF flows have become Bitcoin’s new macro indicator: record Q4 2025 outflows from US-listed BTC and ETH ETFs coincided with Bitcoin breaking support around USD 98,000, according to the 2025 year-end review [T3]. A cumulative USD 6.35 billion ETF outflow episode was driven by fading rate-cut expectations, rising bond yields, rotation into high-beta equities, and liquidity reallocation, per [T2]. Institutional spot ETF holdings fell 17% (from 313,000 to 261,000 BTC) during early-2026 corrections, with selling concentrated among high-frequency hedge funds and market makers [T2].
The structural evidence is equally real. Regulated custody now covers 5% to 7% of all circulating Bitcoin, and over 2,000 wealth advisory firms, sovereign wealth funds, and global banks are shifting from speculative trading to strategic allocation [T2]. The trade-off is that institutional adoption has tied BTC more closely to traditional macro and credit cycles than during the retail era [T4]. One contested analysis argues that 20% to 35% of ETF capital was cash-and-carry basis-trade money whose yields have evaporated, making the “institutional floor” weaker than consensus believes [T5]; this is one analyst’s view and is unverifiable from this dataset.
Net assessment: the drawdown is consistent with a leveraged, flow-driven market digesting a restrictive rate environment, while the adoption infrastructure continues to build underneath. The direction of the next leg depends on which force dominates: flow reversal or regulatory unlock.
Bullish Drivers
- Regulatory catalyst. The US CLARITY Act would establish a federal market-structure framework and could unlock broader institutional participation if passed [T1]. A September 15 CLARITY Act vote was flagged as a potential sentiment catalyst, and clearer rules would ease internal institutional approval processes [T6]. This is a scenario contingent on legislation, not a prediction.
- Model-portfolio integration. Large wealth management firms are embedding spot Bitcoin ETFs into automated advisor models, and legal clarity has allowed insurers and pension funds to underwrite digital asset risk [T2].
- Flow recovery precedent. A USD 3.55 billion inflow week led by Bitcoin restored cumulative 2026 net flows to positive, per [T8]; earlier in May 2026, US spot Bitcoin ETFs saw more than USD 1 billion enter in a single week as Bitcoin climbed back above USD 80,000 [T7]. A single strong week is insufficient evidence, but a sustained multi-week positive flow period would confirm returning demand [T8].
- Entry-level and infrastructure appeal. Lower prices create more attractive entry points, and Bitcoin offers deep liquidity and mature infrastructure across ETFs, futures, custody, and regulated venues [T8]. Traditional financial institutions continue expanding crypto custody, brokerage, and trading infrastructure [T7].
- Utility anchoring. Expansion of stablecoins and tokenized real-world assets could anchor demand in utility rather than speculation, supporting renewed ETF and ETP inflows over a full cycle [T3].
Relative Positioning vs Gold and Ethereum
Data limitation first: the bundle contains no current gold price and no ethereum price data, so any relative-performance claim is qualitative. The comparison below is framed accordingly.
Versus gold: Bitcoin’s most cited institutional rationale is its fixed supply of 21 million and the scarcity thesis [T4], the primary differentiator against gold’s supply elasticity. However, in the current environment of rising euro yields (AAA 10Y at 3.41%, up 46.4 bp year-to-date) and both central banks having hiked in September 2026, gold’s lack of yield is less of a handicap than in easing cycles, and its lower macro sensitivity favors it in risk-off phases. Bitcoin’s 45.3% drawdown from its October 2025 high illustrates the asymmetry: gold competes as the lower-volatility scarcity asset while Bitcoin offers higher convexity at materially higher drawdown risk.
Versus Ethereum: Bitcoin’s 58.48% dominance within a EUR 2.018 trillion total crypto market cap marks it as the relative strength leader inside the asset class. Record Q4 2025 outflows hit BTC and ETH ETFs simultaneously [T3], indicating correlated institutional treatment, but Bitcoin’s rank-1 status, deeper regulated market, and ETF infrastructure concentration favor it over Ethereum in risk-off phases. That is an inference from dominance and flow data, not a price forecast. Ethereum, Solana, and XRP ETF products sit in the same flow complex; sustained altcoin demand would signal capital broadening beyond the two largest assets [T6][T8].
Scenario Framework
All scenarios are conditional frameworks, not forecasts. Anchors: Fed funds target 3.75% to 4.00% (hike effective 2026-09-17), ECB deposit rate 2.50% (hike effective 2026-09-16), euro AAA 10Y at 3.41%, BTC at EUR 58,853, and the flow history documented in [T2][T5][T7][T8].
- Bear scenario. Continued ETF outflows, an accelerating basis-trade unwind [T5], and no regulatory progress extend the drawdown beyond the current -45.3% from ATH. Rising euro yields sustain the restrictive backdrop. As a mechanical illustration only: if the 30-day rate of change (-20.57%) persisted another month, BTC would trade near EUR 46,700. This is arithmetic extrapolation, not a forecast. A regulatory setback is a proven trigger: one reported CLARITY Act setback coincided with BTC falling below USD 76,000 and USD 450 million of ETF outflows [T8].
- Base scenario. Policy rates hold at current levels, ETF flows oscillate between outflow and inflow weeks as they have through 2026 [T7][T8], and BTC consolidates in a wide range while the CLARITY Act outcome remains unresolved. The 24-hour bounce (+0.34%) and 2.56% daily turnover suggest stabilization attempts within a downtrend, not reversal.
- Bull scenario. CLARITY Act passage plus a multi-week positive flow regime reverses the drawdown. The most optimistic dated expert view, from the 2025 year-end review [T3], suggested BTC could push toward USD 200,000 over the next full cycle if macro conditions cooperate. That is a dated expert opinion, explicitly not a house forecast, and it predates the September 2026 policy hikes.
Valuation Discussion
Bitcoin has no cash flows, so all valuation frameworks here are heuristics. Three lenses apply.
Scarcity lens. 20,113,162 of 21,000,000 BTC are issued (95.78%), leaving 886,838 BTC of future issuance. Fully diluted valuation equals market cap at EUR 1.184 trillion because total supply equals circulating supply. If strategic allocators, including the 2,000+ advisory firms and sovereign wealth funds cited in [T2], continue converting to buy-and-hold, the speculative float shrinks and the scarcity premium rises. This is a structural argument, not a price target.
Drawdown and cycle lens. The -45.34% drawdown from the EUR 107,662 ATH of 2025-10-06 is deep but within the range of Bitcoin’s historical bear phases. The lifetime gain from the ATL of EUR 51.30 (2013) stands at +114,626%, illustrating the asset’s long-term convexity and the futility of point-estimate valuation.
Flow-implied lens. The ETF complex was valued at roughly USD 114 billion with cumulative net inflows exceeding USD 21 billion at peak, per [T5]. That demand is measurable but demonstrably reversible. If 20% to 35% of ETF capital was arbitrage that unwinds [T5], valuation support from the “institutional adoption” narrative weakens materially in the bear case. For reconciling EUR prices with USD-denominated news levels: the implied USD reference price is 58,853 / 1.1034 = approximately USD 53,340, a derived approximation using the current bundle FX rate. Note that USD levels cited in news sources were set at different EUR/USD rates, so direct translation distorts comparisons.
Risks
- Rates and liquidity risk. With the Fed at 3.75% to 4.00% and the ECB at 2.50% after September 2026 hikes, and euro AAA 10Y yields up 46.4 bp year-to-date, the backdrop is restrictive for zero-yield assets. Fading easing expectations and rising bond yields were primary drivers of the USD 6.35 billion ETF outflow episode [T2].
- Flow reversal risk. Institutional participation can amplify volatility as easily as it supports rallies [T7]. The 17% drop in institutional ETF holdings (313,000 to 261,000 BTC) shows the speed of reversal [T2].
- Basis-trade fragility. One analysis estimates 20% to 35% of ETF capital was cash-and-carry arbitrage now unwinding, and argues a dovish Fed turn could paradoxically accelerate selling by reviving unwind mechanics [T5]. This is a contested, unverifiable estimate but the mechanism deserves monitoring.
- Regulatory risk. Regulatory uncertainty remains a major risk; changes involving ETFs, custody, taxation, or trading requirements could affect demand [T8]. A CLARITY Act setback has already coincided with BTC below USD 76,000 [T8].
- Custody and concentration risk. Custody remains an operational risk even with qualified custodians, and ETF assets are concentrated in a handful of issuers, creating market-structure questions if any issuer experiences operational stress [T4].
- Macro-cycle coupling. Institutional adoption has tied BTC more closely to traditional macro and credit cycles than during the retail era [T4], reducing its diversification value precisely when it is most needed.
- Compounding stress scenario. A simultaneous ETF outflow wave [T2][T5], a regulatory setback [T8], and further euro yield rises would compound into a drawdown deeper than the current -45.3%. Conversely, market-structure legislation plus sustained positive flows would mitigate the flow and regulatory risks simultaneously [T6][T8].
Appendix
Methodology and provenance. Market data retrieved 2026-11-17T05:15 UTC from the CoinGecko-sourced bundle. Market overview data as of 2026-11-16/17. Euro area yields are from the ECB yield curve as of 2026-11-13. Policy rates come from the authoritative Policy Rates block: Fed funds target range 3.75% to 4.00% (FRED, as of 2026-11-16) and ECB deposit facility rate 2.50% (ECB, as of 2026-11-17).
Source dating caveats. Most news items lack publication dates. T1 is a Q2 2026 review (July 2026 URL), T3 is a 2025 year-end review, and T7 is from May 2026 (URL date 260527). All news figures are cited with their source context and should not be read as current state. The flow narrative is internally contradictory across sources: T2 and T5 describe sustained outflows and an unwinding arbitrage complex, while T7 and T8 describe inflow weeks that turned 2026 net flows positive. These reflect different periods; without precise dates, the current flow regime is genuinely uncertain. T1’s report that the Fed was expected to hold rates through Q3 predates the actual 25 bp hike effective 2026-09-17 and is superseded. T5 is an opinion piece with a strong thesis; its 20% to 35% basis-trade estimate is one analyst’s contested view.
Data gaps. No current gold or ethereum price data, no on-chain metrics (hash rate, funding rates, exchange balances, MVRV), no derivatives data, and no ETF flow time series are present in the dataset. These gaps are disclosed rather than estimated.
Consistency checks. Computed BTC share of total crypto market cap is 1,183.7bn / 2,018.1bn = 58.65%, versus the reported dominance of 58.48%; the small discrepancy likely stems from timing. Reported 24h market cap change of +0.26% versus price change of +0.34% shows a minor divergence, also timing-related.
Scenario labeling convention. All forward-looking statements are labeled as base/bear/bull scenarios, dated market expectations, or dated expert opinions. No scenario is presented as a house forecast.
Sources
- [T1] Q2 2026 Digital Asset Review. CoinDesk
- [T2] Bitcoin ETF Flows Remain a Key Market Driver. moomoo Community
- [T3] Crypto Market 2025: Year-End Review & Expert Insights. TradingView News
- [T4] Institutional Bitcoin Adoption Explained: How Blackrock, Fidelity and Others Embraced BTC. The Block
- [T5] The Invisible Margin Call: Why Bitcoin’s $114 Billion “Institutional Floor” Is a Trapdoor. Substack
- [T6] Crypto ETFs Enter a New Phase in September: Here’s What Investors Should Watch. Bitcoin Foundation
- [T7] Bitcoin Outlook: ETF Outflows, Institutional Adoption & Price Forecast 2026. IG South Africa
- [T8] Crypto Funds See $3.55B Inflows: Bitcoin Leads as Ethereum and Solana Surge. Bitcoin Foundation
Disclaimer. This report is AI-generated, for informational purposes only, and does not constitute investment advice. It should not be relied upon for making investment decisions. Data may be incomplete, delayed, or inaccurate, and past performance is not indicative of future results.
Important Note / Wichtiger Hinweis:
EN: This report may have been generated using AI. It processes data from publicly available sources. The content is provided for informational purposes only.DE: Dieser Bericht kann mithilfe von KI erstellt worden sein. Dabei werden Daten aus öffentlich zugänglichen Quellen verarbeitet. Die Inhalte dienen ausschließlich Informationszwecken.
* DE: Die ergänzenden Inhalte können KI-generiert sein. EN: The additional content may be AI-generated.