
Watch the video
This player shows only the Bitcoin chapter of the daily altii market briefing. Watch the full video on tube.altii.de.
Key Data Snapshot
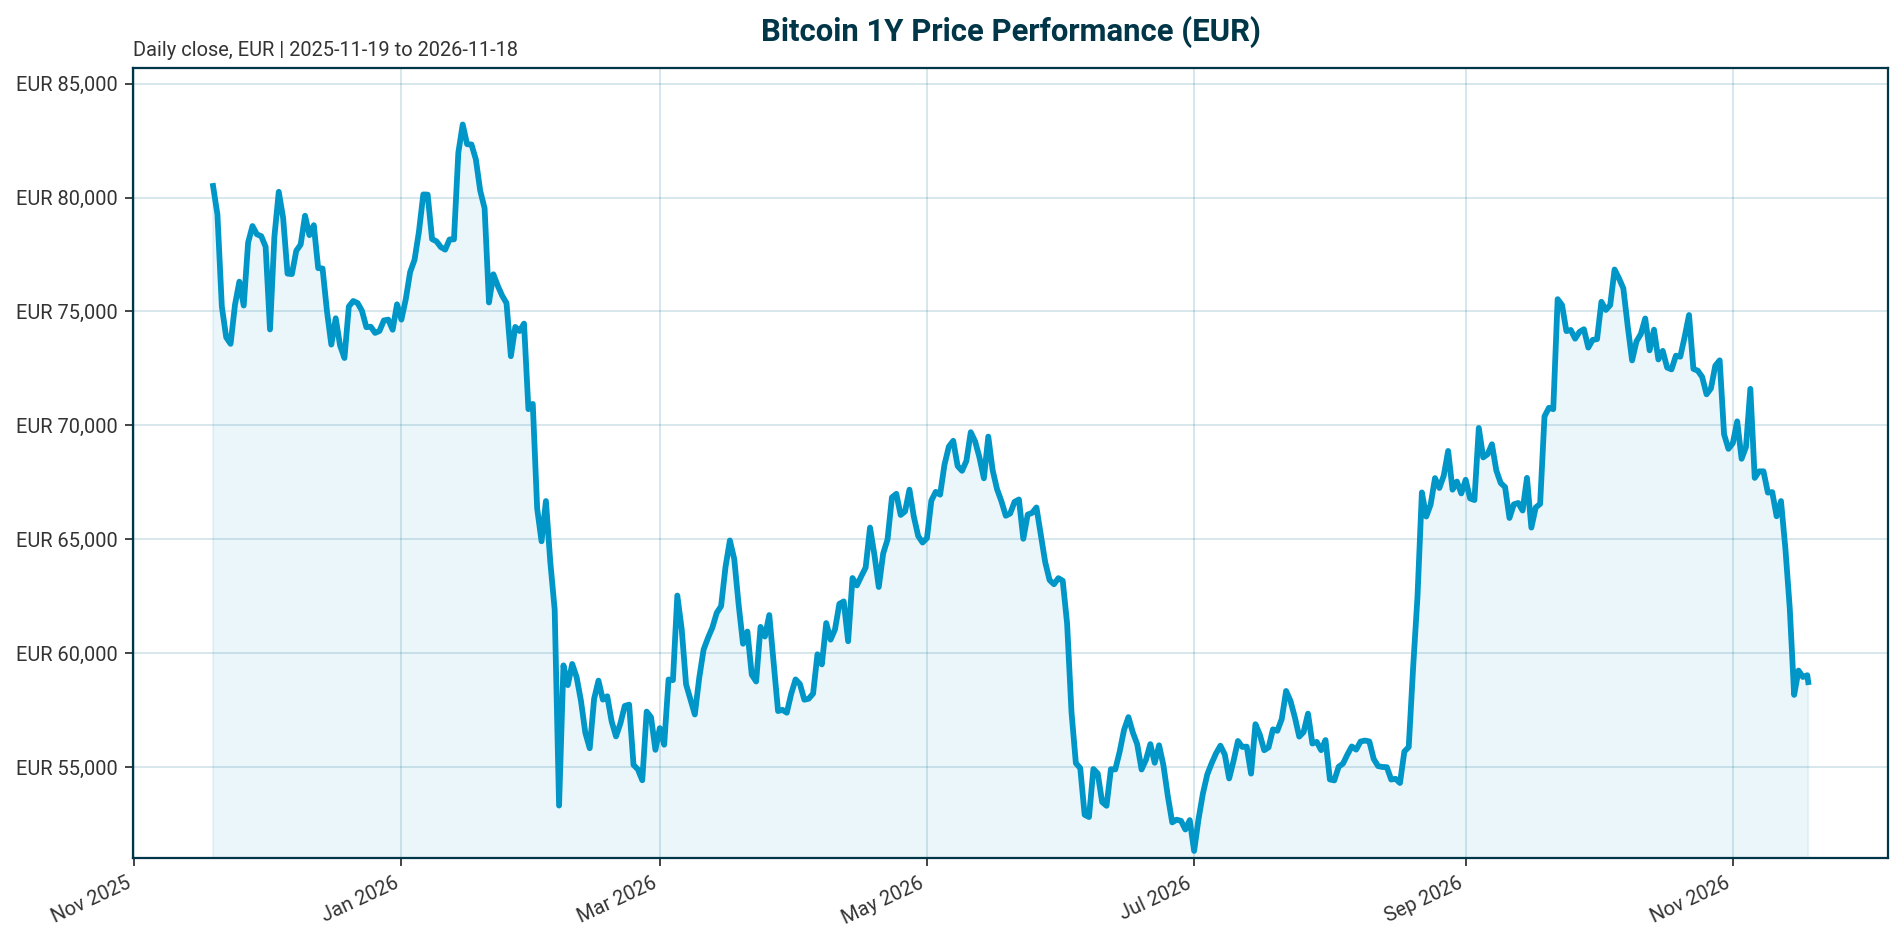
Bitcoin (BTC) trades at EUR 58,658 as of 18 November 2026, 05:15 UTC. The asset is in a deep drawdown: down 45.5% from its all-time high of EUR 107,662 set on 6 October 2025, and down 29.1% year-on-year. The 30-day decline of 21.9% against a 7-day decline of 12.7% shows an accelerating monthly downtrend rather than a single shock.
| Metric | Value |
|---|---|
| Price (EUR) | 58,658 |
| 24h range (EUR) | 57,661 to 59,396 |
| 24h change | -0.37% |
| 7d / 14d / 30d change | -12.66% / -15.76% / -21.94% |
| 200d / 1y change | -17.92% / -29.05% |
| Market cap (EUR) | 1.179 trillion (rank 1) |
| BTC dominance | 58.39% of a EUR 2.013 trillion total crypto market |
| 24h volume (EUR) | 30.0 billion (about 2.54% of market cap) |
| All-time high (EUR) | 107,662 on 2025-10-06; current drawdown -45.52% |
| Supply | 20,113,584 of 21,000,000 BTC issued (95.78%); FDV equals market cap |
Calculation check: (58,658 minus 107,662) / 107,662 = -45.52%, matching the bundle figure. Volume-to-market-cap: 30,018,382,248 / 1,179,477,417,801 = 2.54%, indicating subdued turnover typical of risk-off conditions. The price sits about 57.5% up the 24h range, so the modest daily move masks the larger weekly and monthly deterioration.
Market Setup
The cross-asset backdrop is firmly risk-off. Risk sentiment is negative and equity momentum is moderately negative, with DACH equities broadly in line with global peers. The DAX is down 2.32% over five days while the Nasdaq Composite is the weakest major index at -4.47%; the S&P 500 is down 3.66% over five days and 4.16% over a month. Euro area AAA 10Y yields stand at 3.42%, up 9.2 bp over five days, with the 2Y at 3.11% and up 100 bp year-to-date; the AAA 10Y-2Y spread sits at 31.3 bp. FX is mixed: EUR/USD trades at 1.1005, down 0.61% over five days and 6.34% year-to-date, a USD-strength move that also weighs on BTC in EUR terms through translation.
Policy is the dominant macro constraint. The Federal Funds target range is 3.75% to 4.00% as of 17 November 2026, following a 25 bp hike effective 17 September 2026. The ECB deposit facility rate is 2.50% as of 18 November 2026, following a 25 bp hike effective 16 September 2026. Both central banks tightened in September 2026, keeping the opportunity cost of a non-yielding asset elevated. The 150 bp differential between the Fed upper bound and the ECB deposit rate is a relevant input for EUR/USD and therefore for BTC-EUR pricing. No market-implied forward rate path is in the dataset; any easing expectation in this report is a scenario assumption, not a stated market expectation.
Against this backdrop, Bitcoin’s behaviour has changed in character. Its correlation with 10-year US real yields has climbed above 0.6 as US federal debt passes $40 trillion, according to a LinkedIn market commentary [T2]. This means Bitcoin now inherits rates volatility directly, and the September 2026 hikes by both the Fed and the ECB land on an asset already down 21.9% in 30 days.
Investment Thesis
The core tension is straightforward: structural institutional adoption is deepening, but the current macro regime dominates price action. On the structural side, US spot Bitcoin ETFs swung from roughly $4.7 billion in net outflows in Q2 2026 to $6.4 billion in inflows in Q3 2026, a quarterly swing of about $11.1 billion [T1]. Switzerland approved its first retail spot Bitcoin ETF and J.P. Morgan Asset Management incorporated Bitcoin into its long-term capital-market assumptions for the first time, per coverage citing The Wall Street Journal [T3]. ETFs, companies and governments have absorbed about 1.75 million BTC, roughly 3.4 times miner output, and Bitcoin’s average three-month volatility has fallen from 57% to 38% [T8].
On the cyclical side, the same institutional wrapper that brings capital in also takes it out. ETFs are no longer a permanent structural bid but a two-way portfolio-allocation channel that responds to yields, volatility and relative valuations [T1]. With the Fed at 3.75% to 4.00% and the ECB at 2.50% after September hikes, and with euro AAA 10Y yields rising, the rates backdrop currently overrides the adoption narrative. The thesis, stated plainly: Bitcoin is a structurally growing but macro-captive asset. Until real yields fall or risk appetite recovers, the high-beta leg of its dual character is in control. Both legs matter; neither is permanent.
Bullish Drivers
- Flow regime reversal. Q3 2026 ETF inflows of $6.4 billion reversed Q2 outflows of roughly $4.7 billion [T1]. Each dollar of net inflow buys BTC against a supply schedule that does not respond to price, creating direct upward pressure [T6].
- Cumulative institutional demand. Spot Bitcoin ETFs had generated $57.7 billion in cumulative net inflows since their January 2024 debut as of 15 December, a 59% increase versus $36.2 billion at the start of that year, according to Farside Investors via a dated news source [T3]. This is a historical figure, not a current flow reading.
- Supply-side absorption. About 1.75 million BTC absorbed by ETFs, companies and governments, roughly 3.4 times miner output, with 95.78% of the 21 million cap already issued [T8].
- Whale accumulation. New whale entities are selectively accumulating near current cost bases, even as corporate treasury buying slowed through Q3, per market commentary [T2]. This is an observation, not a forecast.
- Structural wrapper demand. 93% of US crypto mutual fund and ETF assets sit in passive strategies, indicating durable allocation-driven rather than momentum-driven demand [T8]. Grayscale’s 2026 outlook frames the industry as entering an “institutional era” in which allocation-driven flows replace retail boom-and-bust cycles [T7].
- Monetary-hedge narrative. Fixed supply and declining issuance position Bitcoin as a potential long-term hedge against fiscal expansion and currency depreciation [T7], a narrative reinforced by the correlation with real yields as US federal debt passes $40 trillion [T2].
Relative Positioning vs Gold and Ethereum
Gold and Ethereum price data are not in the dataset, so this section relies on qualitative framing and cited context rather than benchmark performance figures.
Versus gold: Bitcoin’s correlation above 0.6 with 10-year US real yields [T2] places it firmly in the high-beta risk camp in the short run, while gold traditionally carries a lower beta to real yields. In a rising-real-rate regime with the Fed at 3.75% to 4.00%, gold’s defensive profile would be expected to outperform Bitcoin’s; this is analytical framing, not a quoted performance comparison. The long-run counterargument is that Bitcoin’s fixed supply and the >0.6 real-yield correlation tied to $40 trillion of US federal debt support its case as a fiscal hedge, a role gold historically monopolises [T2, T7].
Versus Ethereum: Bitcoin holds 58.39% dominance of a EUR 2.013 trillion total crypto market, so its drawdown is a sector-wide de-rating rather than a loss of relative standing within digital assets. The spot Ethereum ETF channel, approved in May 2024, partially extended institutional access but only to ETH, not to DeFi tokens built on Ethereum [T4]. The largest US crypto funds are single-coin Bitcoin and Ethereum products, with passive strategies at 93% of US crypto fund assets [T8]. Combined Bitcoin and Ether ETF outflows of $390.9 million in one reported session showed that caution hits both assets together, per a dated news figure [T2]. If institutional risk appetite recovers, Bitcoin’s deeper ETF liquidity channel and dominance position would likely reassert leadership within crypto allocations.
Scenario Framework
Anchor point: BTC-EUR at 58,658, down 45.5% from the October 2025 ATH, with the Fed at 3.75% to 4.00% and the ECB at 2.50% after September 2026 hikes. The 10-year TIPS yield stood at 2.91% on 6 October 2026, per a dated source [T6]; no current US real-yield data is in the dataset.
- Bull scenario (assumption). Market expectations shift toward Fed easing, real yields fall from the 2.91% October level, and ETF inflows accelerate beyond the Q3 pace of $6.4 billion [T1]. Against inelastic supply, BTC-EUR retraces a meaningful share of the 45.5% drawdown over time. Trigger to watch: a dovish repricing in rate expectations, which is not present in the current dataset.
- Base scenario (assumption). Policy rates hold at current levels, ETF flows stay mixed as they have been year-to-date, roughly flat to modestly positive [T2], and risk sentiment stabilises from negative. BTC-EUR consolidates in a wide range around current levels with elevated volatility. The 24h decline of only 0.37% against a 21.9% 30-day decline is consistent with decelerating selling pressure, but one day does not make a base.
- Bear scenario (assumption). Sticky inflation or further tightening pushes real yields higher, ETF flows flip back to net supply as in Q2 2026, and BTC-EUR extends the downtrend. The ETF contagion channel amplifies the move: a hedge fund margin call forces IBIT selling, which cascades into physical BTC selling and on-chain liquidations [T6]. A repeat of the heavy June 2026 outflow episode [T6] under current negative risk sentiment is the concrete risk path.
Valuation Discussion
Bitcoin has no cash flows, so discounted-earnings frameworks do not apply. Valuation rests on three pillars: scarcity, flow, and narrative. On scarcity, 20,113,584 of 21,000,000 BTC are issued (95.78%), and because total supply equals circulating supply, the fully diluted valuation equals the market cap at EUR 1.179 trillion. On flow, the transmission mechanism is mechanical: each dollar of net ETF inflow purchases BTC against a fixed supply schedule, so sustained inflows translate into sustained price pressure, while outflows do the reverse [T6]. On narrative, J.P. Morgan Asset Management incorporating Bitcoin into its long-term capital-market assumptions for the first time [T3] signals integration into mainstream allocation frameworks, which supports a durable demand floor if the institutional-era thesis holds [T7].
Two valuation observations from the data. First, the volume-to-market-cap ratio of 2.54% over 24 hours indicates subdued turnover; price discovery is happening on relatively few coins, which cuts both ways for valuation confidence. Second, with dominance intact at 58.4% and the drawdown at 45.5%, the evidence supports a “sector de-rating, not asset rejection” interpretation as a working scenario rather than a conclusion. No fair value is asserted here; Bitcoin’s valuation remains regime-dependent, and the regime is currently set by rates, not by adoption metrics.
Risks
- Rates and opportunity cost. Higher-for-longer policy raises the opportunity cost of a non-yielding asset, and a strengthening USD acts as a headwind for the dollar-denominated crypto price [T7]. The Fed’s 25 bp hike effective 17 September 2026 and the ECB’s 25 bp hike effective 16 September 2026 are the latest expressions of this risk.
- ETF contagion channel. Institutionalisation created a transmission path from traditional finance stress into crypto: forced ETF selling cascades into physical selling and on-chain liquidations [T6]. ETFs are a two-way channel and became a source of supply in Q2 2026 with roughly $4.7 billion in outflows [T1].
- Real-yield sensitivity. A correlation above 0.6 with 10-year US real yields means Bitcoin inherits rates volatility directly [T2]. Hotter-than-expected producer-price inflation has already strengthened concerns about the Fed’s policy outlook, per a dated news figure [T2].
- Regulatory and legislative delay. US crypto legislation faces delays, and policy uncertainty from divided government could weigh on Bitcoin [T5]. The regulatory asymmetry persists: Bitcoin has an institutional channel while most altcoins remain in legal uncertainty, and US jurisdictional questions between the SEC and CFTC remain unresolved [T4].
- Flow concentration. ETF demand has been uneven even on positive days; on one reported session, Fidelity’s FBTC attracted $236.7 million while BlackRock’s IBIT recorded $201.2 million in withdrawals, per a dated news figure [T5]. Concentrated flows are less durable than broad-based allocation.
- FX translation. EUR/USD at 1.1005, down 6.34% year-to-date, means BTC-EUR performance embeds both USD crypto price moves and currency translation. A further USD rally would deepen EUR-terms losses even if USD-quoted Bitcoin stabilises.
Appendix
Data provenance. Market data retrieved 18 November 2026, 05:15 to 05:16 UTC, from a CoinGecko-derived bundle, quoted in EUR. Equity data as of the 17 November 2026 close. Euro area AAA yields as of 16 November 2026, sourced from the ECB yield curve. FX data as of 18 November 2026. Policy rates are from the authoritative policy rates block: Federal Funds target range 3.75% to 4.00% as of 17 November 2026, last change a 25 bp hike effective 17 September 2026; ECB deposit facility rate 2.50% as of 18 November 2026, last change a 25 bp hike effective 16 September 2026.
Dated news figures. All Tavily news items lack publication dates in the feed. Specific figures cited, including the $57.7 billion cumulative ETF inflows [T3], the $526.7 million daily inflow and $81,419 BTC price [T2], and the 2.91% 10-year TIPS yield from 6 October 2026 [T6], are historical snapshots and must not be read as current market state. The current BTC-EUR price in this report is 58,658 from the bundle.
Definitions. FDV: fully diluted valuation, price multiplied by maximum supply. BTC dominance: Bitcoin market cap as a share of total crypto market cap. ATH drawdown: percentage decline from the all-time high. Two-way ETF channel: the observation that regulated Bitcoin products add demand in inflow regimes and become supply in outflow regimes [T1]. Real-yield correlation: statistical co-movement of Bitcoin with inflation-indexed US Treasury yields.
Calculations shown. Supply issued: 20,113,584 / 21,000,000 = 95.78%. Volume-to-market-cap: 30.0 billion / 1,179.5 billion = 2.54%. ATH drawdown: (58,658 – 107,662) / 107,662 = -45.52%. Quarterly ETF flow swing: $6.4 billion Q3 inflows minus $4.7 billion Q2 outflows = about $11.1 billion [T1]. Policy differential: Fed upper bound 4.00% minus ECB deposit rate 2.50% = 150 bp.
Sources
- [T1] Crypto After the Midterms: Regulation, Liquidity and the Institutional Era – AMINA Bank
- [T2] Bitcoin Q3 Rally Makes Sense with Changing Macro Backdrop | Brett Munster, LinkedIn
- [T3] Bitcoin Torn Between Institutional Adoption and Macroeconomic Pressures | Golden Gate PR, LinkedIn
- [T4] Crypto Regulation Explained | MiCA, SEC Frameworks and Structural Risks
- [T5] Bitcoin ETF inflows return as US crypto legislation faces delays
- [T6] Bitcoin & Liquidity Cycles | Real Rates, ETFs and Macro Regime Signals
- [T7] Grayscale Bitcoin Trust ETF (GBTC): Key Factors Influencing Its Trajectory
- [T8] The institutionalization of crypto beta – 21Shares
Disclaimer. This report is AI-generated and provided for informational purposes only. It does not constitute investment advice, a recommendation, or an offer to buy or sell any financial instrument. Figures are drawn from the cited data sources as of the stated timestamps and may change. Readers should conduct their own research and consult a licensed financial adviser before making investment decisions.
Important Note / Wichtiger Hinweis:
EN: This report may have been generated using AI. It processes data from publicly available sources. The content is provided for informational purposes only.DE: Dieser Bericht kann mithilfe von KI erstellt worden sein. Dabei werden Daten aus öffentlich zugänglichen Quellen verarbeitet. Die Inhalte dienen ausschließlich Informationszwecken.
* DE: Die ergänzenden Inhalte können KI-generiert sein. EN: The additional content may be AI-generated.