
Watch the video
This player shows only the Bitcoin chapter of the daily altii market briefing. Watch the full video on tube.altii.de.
Key Data Snapshot
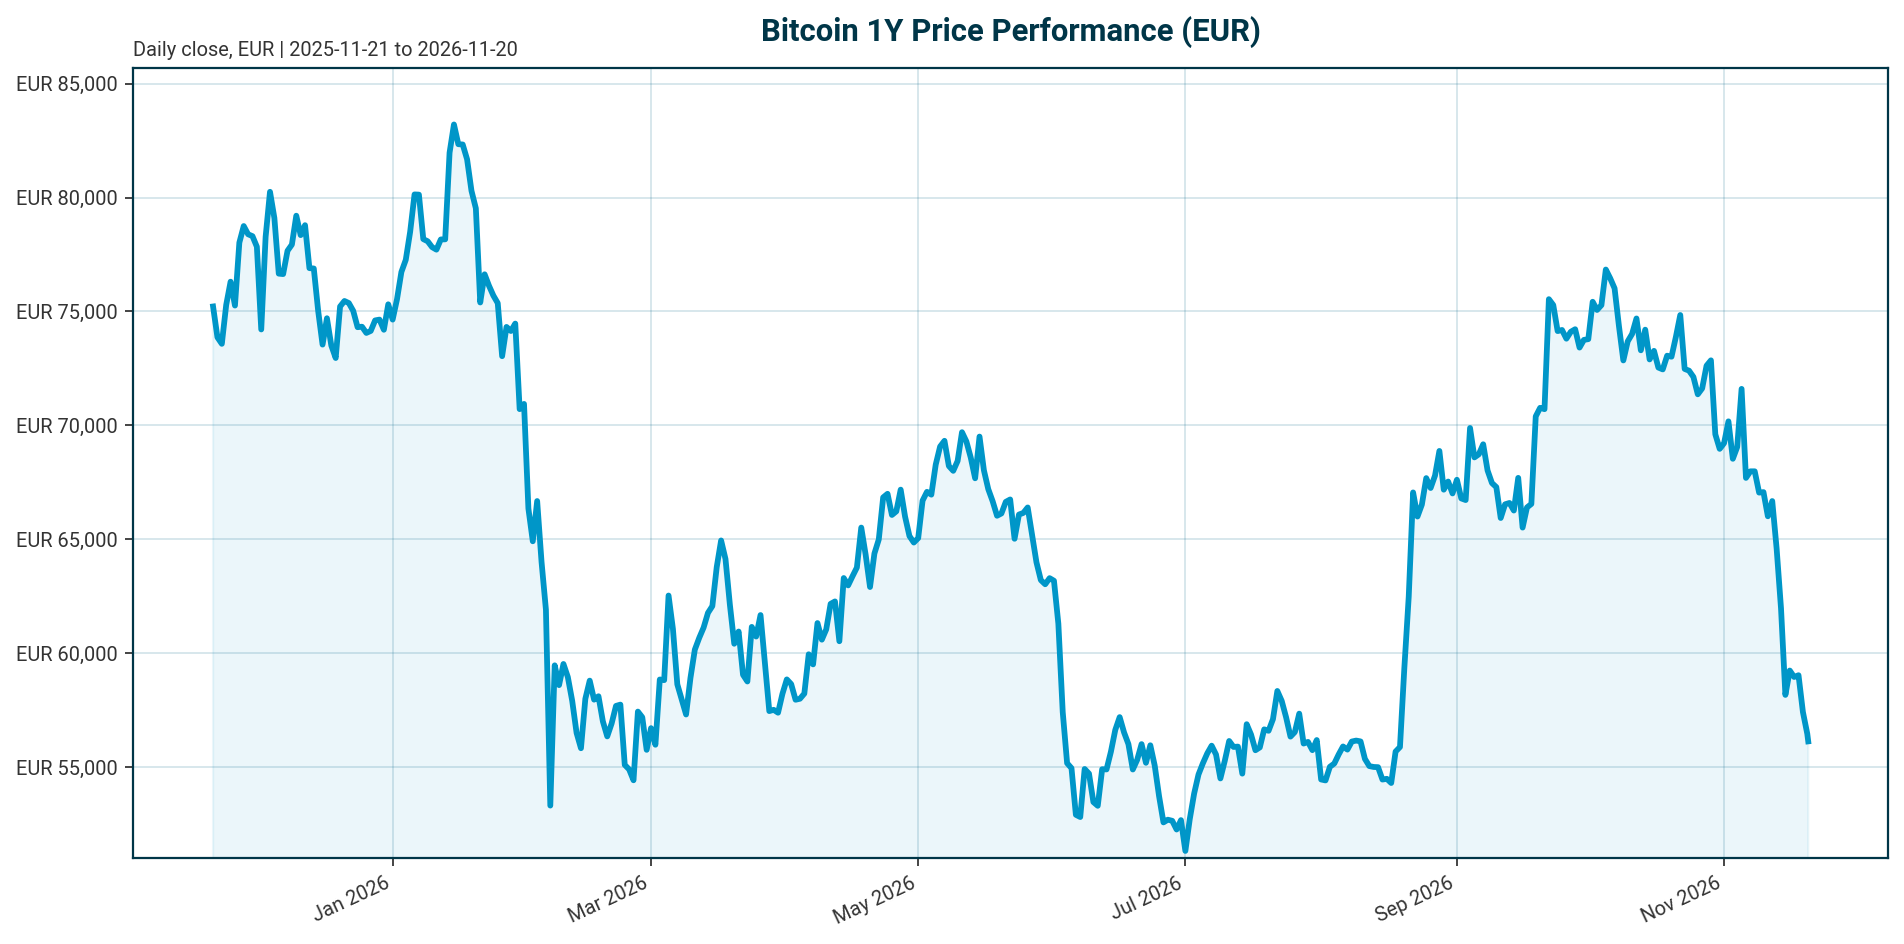
Bitcoin (BTC) in EUR, retrieved 2026-11-20 05:15 UTC via CoinGecko.
| Metric | Value |
|---|---|
| Price (EUR) | 56,057 |
| 24h range (EUR) | 55,802 to 58,291 |
| 24h volume (EUR) | 31.78 billion |
| Performance 24h / 7d / 14d | -3.15% / -10.80% / -18.95% |
| Performance 30d / 200d / 1y | -25.68% / -23.49% / -33.53% |
| Market cap (EUR) | 1.1275 trillion (rank 1) |
| Fully diluted valuation (EUR) | 1.1275 trillion (equals market cap) |
| Circulating supply | 20,114,434 of 21,000,000 max (95.8% mined) |
| All-time high (EUR) | 107,662 on 2025-10-06; current price -47.93% below |
| BTC dominance | 58.0% of a EUR 1.937 trillion total crypto market cap |
| Fed funds target range | 3.75% to 4.00% (as of 2026-11-19); last change: 25 bp hike effective 2026-09-17 |
| ECB deposit facility rate | 2.50% (as of 2026-11-20); last change: 25 bp hike effective 2026-09-16 |
| EUR/USD | 1.0983, -0.46% over 5 days, -2.21% over 1 month |
Turnover check: 24h volume of EUR 31.78 billion against a EUR 1,127.5 billion market cap implies a daily turnover ratio of roughly 2.8%, indicating a liquid but not overheated market.
Market Setup
The cross-asset backdrop is firmly risk-off. Risk sentiment is negative and equity momentum is broadly negative, with DACH indices broadly in line with global peers: DACH indicators average -4.48% over five days versus -5.32% for global equity benchmarks. The S&P 500 is down 5.10% and the Nasdaq Composite 5.00% over five days; the Hang Seng is the weakest at -5.94%, while the ATX shows the strongest DACH move at -4.14%. Rates are a headwind for a zero-yield asset: the Euro Area AAA 10Y yield sits at 3.41%, up 4.3 bp over five days, with the AAA 2Y at 3.09% and the 10Y-2Y spread at 32.4 bp (as of 2026-11-18). FX is mixed, with EUR/USD at 1.0983, down 0.46% over five days and 2.21% over a month, a mild translation tailwind for EUR-quoted BTC on a spot basis but a signal of dollar strength that historically accompanies tight dollar liquidity. Policy is the anchor: the Fed funds target range stands at 3.75% to 4.00% after a 25 bp hike effective 2026-09-17, and the ECB deposit facility rate is 2.50% after a 25 bp hike effective 2026-09-16. For context, the 10-year TIPS yield stood at 2.91% on October 6, 2026 according to [T4], a dated figure that illustrates the real carry disadvantage Bitcoin faces. Scenario assumption: if yields keep grinding higher, the opportunity cost of holding BTC intensifies; a shift in risk sentiment from negative to neutral has historically been the precondition for BTC-EUR to stabilise.
Investment Thesis
Bitcoin is now a macro-sensitive, institutionally intermediated asset whose price is set by the ETF allocation cycle against a fixed supply. The current picture is a deep drawdown: -47.93% from the October 2025 all-time high of EUR 107,662 and -25.68% over 30 days, despite record institutional ETP holdings. The core tension is that the same ETF wrapper that channels institutional demand also channels institutional exits. US spot Bitcoin ETFs moved from roughly $4.7 billion of net outflows in Q2 to $6.4 billion of inflows in Q3, and ETFs should no longer be treated as a permanent structural bid but as a two-way portfolio-allocation channel [T1]. On the demand side, 13F filers added a net 49,229 BTC in Q3 2026, the most since Q2 2025, after selling 47,054 BTC over the prior three quarters, taking reported holdings to a record 356,491 BTC-equivalent ($29.78 billion) as of September 30, 2026 [T8]. The wealth channel is the structural anchor: advisors and wealth platforms hold about 40% of institutional ETP ownership and have increased holdings every quarter since Q2 2024, behaviour that likely dampens volatility through systematic rebalancing [T8]. On the macro side, Bitcoin’s correlation with 10-year US real yields has reportedly climbed above 0.6 as federal debt passes $40 trillion, per [T2], an undated source claim that reinforces its dual role as high-beta risk asset and macro-sensitive holding. With 20,114,434 of 21,000,000 coins circulating, price formation is almost entirely demand-flow driven [T4]. Scenario assumption: continued wealth-channel allocation should make drawdowns shallower than prior cycles, supporting a maturing-asset thesis [T7]; conversely, renewed tightening with negative ETF flows would turn the intermediation chain into a contagion amplifier [T4].
Bullish Drivers
- Institutional accumulation resumed. 13F filers added a net 49,229 BTC in Q3 2026, the largest quarterly addition since Q2 2025, with advisors and wealth platforms contributing half of the net addition [T8].
- IBIT concentration. Filers hold 232,453 BTC-equivalent in BlackRock’s IBIT, 65.2% of reported holdings, and IBIT took 34,744 of the quarter’s net 49,229, evidence of sustained demand through the flagship vehicle [T8].
- Flow regime flipped positive. US spot Bitcoin ETFs moved from approximately $4.7 billion of net Q2 outflows to $6.4 billion of Q3 inflows [T1].
- Regulatory asymmetry favours Bitcoin. Bitcoin has had a mature spot ETF channel since January 2024, while most altcoins remain in legal uncertainty; spot Ethereum ETFs only partially extended access [T3].
- Geographic expansion. The 2024 ETF approval unleashed over $40 billion in cumulative AUM inflows, and jurisdictions including the UAE, Brazil and Nigeria are operationalising adoption, widening the demand pipeline [T5].
- Sovereign and public-fund adoption. New Hampshire approved a crypto reserve law allowing up to 5% of public funds in digital assets with at least $500 billion market capitalisation, a threshold only Bitcoin currently meets among major assets [T5].
Scenario assumptions: sustained wealth-channel inflows combined with any pause or reversal in the hiking cycle form the bullish path toward new highs, consistent with the bullish scenario sketched in [T6]. A recovery in corporate treasury buying, which slowed through Q3 per [T2], would add a second demand pillar.
Relative Positioning vs Gold and Ethereum
Benchmarks for this report are gold and Ethereum. Current gold and ETH prices are not in the dataset, so positioning is framed structurally rather than on live cross-asset returns. Against gold, Bitcoin’s fixed 21 million supply contrasts with elastic precious-metal supply, but gold retains the safe-haven bid that Bitcoin lacks in risk-off regimes. With a reported correlation above 0.6 to 10-year US real yields per [T2], an undated source claim, Bitcoin currently trades as a high-beta macro asset rather than a digital gold, which argues for gold as the defensive complement in rate-driven drawdowns. Against Ethereum, Bitcoin holds the clear institutional-access advantage: BTC dominance of 58.0% underscores its primacy, and the regulatory asymmetry documented since the January 2024 spot ETF approval has channelled the bulk of institutional capital into Bitcoin products [T3]. Flow interplay matters too: combined Bitcoin and Ether ETF outflows of $390.9 million in one reported session per [T2], a dated source figure, show that caution hits both assets, but Bitcoin’s deeper ETF penetration gives it a larger institutional base to absorb outflows. Scenario assumptions: in a continued risk-off regime, gold should outperform BTC; in a risk-on reversal with falling real yields, BTC’s beta should outpace gold. If US legislative clarity via FIT21 and stablecoin frameworks advances, Ethereum could close part of the institutional-access gap [T3].
Scenario Framework
Scenarios are assumptions, not forecasts. Anchors: BTC-EUR at 56,057, -47.93% from ATH. In USD terms, per [T8], the bear-market low was $57,717 on July 1, 2026 and the recent high $87,397 on September 21, 2026; the current EUR price of 56,057 at EUR/USD 1.0983 implies roughly $61,566, placing spot near the lower end of the 2026 range. Policy rates are 3.75% to 4.00% at the Fed and 2.50% at the ECB after September 2026 hikes; any future moves below are market expectations or scenario assumptions, not decisions.
- Bullish (assumption): Real yields fall, the Fed shifts to cuts, and ETF inflows resume at Q3-2026 pace or better. Wealth-channel systematic allocation compounds the recovery. BTC-EUR reclaims the September 2026 high zone and challenges the EUR 107,662 ATH. Consistent with the bullish end-2027 scenario in [T6].
- Base (assumption): Policy rates on hold, ETF flows oscillate around flat, matching the roughly flat-to-modestly-positive YTD flow pattern described in [T2]. BTC-EUR ranges between the July 2026 low and September 2026 high in USD terms, roughly the current zone. The four-year cycle becomes less predictive as institutional ownership grows [T7].
- Bearish (assumption): Further tightening or sticky real yields, with the 10-year TIPS yield holding above the 2.91% level of October 6, 2026 per [T4], plus renewed ETF outflows of the kind seen in June 2026 [T4]. BTC-EUR breaks below the July 2026 bear-market low and the drawdown extends beyond 50% from ATH.
Valuation Discussion
Bitcoin has no cashflows, so valuation rests on scarcity, adoption and flow dynamics rather than discounted-earnings frameworks [T4, T6]. Three lenses apply. First, supply scarcity: 20,114,434 of 21,000,000 coins circulate, about 95.8% of maximum supply, and fully diluted valuation equals market cap at EUR 1.1275 trillion, so new issuance adds negligible supply and demand flows dominate price formation. Second, drawdown positioning: at -47.93% from ATH, the drawdown is deep by equity standards but not unprecedented for Bitcoin, and the implied USD price of roughly $61,566 sits modestly above the $57,717 bear-market low of July 1, 2026 per [T8], a dated USD figure; a like-for-like EUR comparison would require historical FX data not in the dataset. Third, flow-to-market-cap: the record 356,491 BTC-equivalent of 13F-reported holdings ($29.78 billion as of September 30, 2026) against a EUR 1.13 trillion market cap shows institutional ownership is meaningful but not dominant, leaving ample two-way flow risk. Composition improves the quality of the bid: hedge funds hold only 19.0% of 13F-reported holdings, down from 50.6% at end-2024, and basis and relative-value funds are down to 34,053 BTC-equivalent from a peak of 101,826, reducing speculative leverage in the holder base [T8]. Scenario assumptions: with basis-trade froth reduced, risk-adjusted valuation at current prices arguably improves; but valuation support here is behavioural, not fundamental, and a break of the bear-market low would invalidate mean-reversion anchoring.
Risks
- Rates risk. The Fed funds target range of 3.75% to 4.00% and the ECB deposit rate of 2.50%, both raised in September 2026, impose real carry costs on a zero-yield asset. Further tightening is a direct headwind.
- Contagion risk. The ETF intermediation chain transmits traditional-finance stress into crypto: a hedge fund margin call can force IBIT selling, which becomes physical BTC selling and can trigger on-chain liquidation cascades [T4].
- Flow-reversal risk. ETFs are a two-way channel. Q2 2026 saw roughly $4.7 billion of outflows and June 2026 saw heavy outflows before the Q3 recovery [T1, T4].
- Correlation risk. A reported correlation above 0.6 to 10-year US real yields per [T2], an undated source claim, means Bitcoin offers limited diversification precisely in rate-driven equity drawdowns.
- Regulatory risk. US legislative outcomes on FIT21 and stablecoin frameworks remain unresolved; regulatory clarity stabilises channels, not prices [T3].
- Cycle-uncertainty risk. The traditional four-year cycle may no longer reliably time entries and exits as institutional ownership grows [T7], removing a familiar tactical map for allocators.
- Data-quality risk. Several news figures are undated or USD-denominated, and EUR/USD translation introduces FX noise into EUR-quoted analysis.
Scenario assumptions: a hedge-fund margin call forcing ETF selling is the primary tail-risk transmission mechanism [T4]; a hawkish surprise from either the Fed or the ECB would likely deepen the current negative risk-sentiment regime.
Appendix
Methodology and Data Notes
Market data was retrieved 2026-11-20T05:15:08Z via CoinGecko. Market overview data is as of 2026-11-19/20; euro yield curve data is as of 2026-11-18 from the ECB yield curve source; FX data is as of 2026-11-20 from the Frankfurter source. Policy rates come from the authoritative policy rates block: Fed funds target range 3.75% to 4.00% as of 2026-11-19 with the last change a 25 bp hike effective 2026-09-17, and ECB deposit facility rate 2.50% as of 2026-11-20 with the last change a 25 bp hike effective 2026-09-16. No other central bank rates are in the dataset. Calculations shown: supply mined 20,114,434 / 21,000,000 = 95.8%; drawdown (56,057 – 107,662) / 107,662 = -47.93%; implied USD price 56,057 x 1.0983 = ~$61,566; dominance cross-check 1,127.5bn / 1,936.9bn = 58.2% versus reported 58.0%; turnover 31.78bn / 1,127.5bn = ~2.8%. Caveat: Tavily news items lack verified publication dates; USD-denominated figures were not converted to EUR, and undated figures are labelled as source claims rather than current state.
Sources
- [T1] Crypto After the Midterms: Regulation, Liquidity and the Institutional Era, AMINA Bank. Link
- [T2] Bitcoin Q3 Rally Makes Sense with Changing Macro Backdrop, Brett Munster, LinkedIn. Link
- [T3] Crypto Regulation Explained: MiCA, SEC Frameworks and Structural Risks, eco3min. Link
- [T4] Bitcoin & Liquidity Cycles: Real Rates, ETFs and Macro Regime Signals, eco3min. Link
- [T5] 5 Countries Reshaping the Digital Asset Map, WisdomTree Onchain. Link
- [T6] Where Could Bitcoin Be By The End Of 2027? 3 Scenarios Investors Are Watching, Yahoo Finance. Link
- [T7] The End of Bitcoin’s Four-Year Cycle? How ETFs and Institutions Are Reshaping the Market, Wolf & Company via New Jersey Bankers Association. Link
- [T8] Wealth Channel Kept Stacking Bitcoin via ETPs in Q3, Filings Show, Galaxy Research. Link
Disclaimer
This report is AI-generated and provided for informational purposes only. It does not constitute investment advice, a recommendation, or an offer to buy or sell any financial instrument. Figures should be independently verified before use, and readers should consult a licensed financial advisor before making investment decisions.
Important Note / Wichtiger Hinweis:
EN: This report may have been generated using AI. It processes data from publicly available sources. The content is provided for informational purposes only.DE: Dieser Bericht kann mithilfe von KI erstellt worden sein. Dabei werden Daten aus öffentlich zugänglichen Quellen verarbeitet. Die Inhalte dienen ausschließlich Informationszwecken.
* DE: Die ergänzenden Inhalte können KI-generiert sein. EN: The additional content may be AI-generated.