
Listen to the summary
Key Data Snapshot
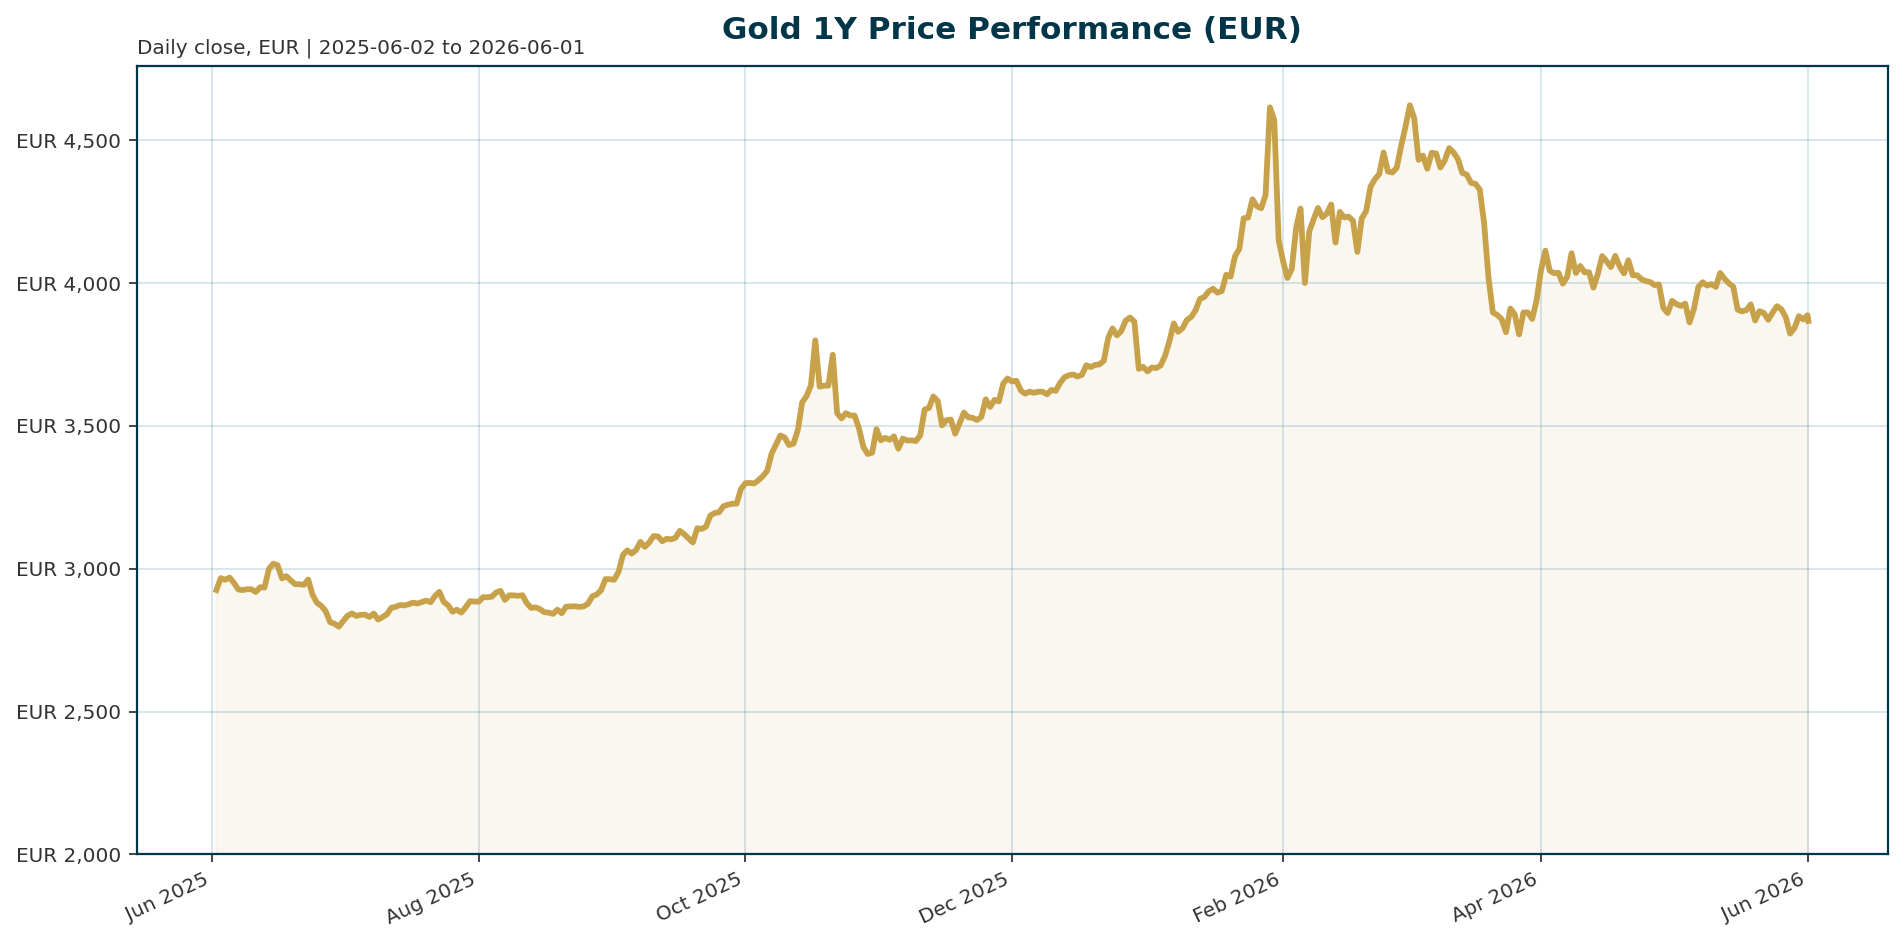
| Asset | Price (EUR) | 24h Change | 1Y Change | ATH (Date) | ATH Change |
|---|---|---|---|---|---|
| Gold (XAU) | 3,867.35 | -0.11% | +33.03% | 4,688.32 (Jan 29, 2026) | -17.51% |
Macro Backdrop
Risk sentiment is positive with broadly positive equity momentum, though the DACH region is lagging at -0.55% over 5 days versus 1.41% for global equity indicators [market_overview]. The rates backdrop is mixed, with the Euro Area AAA 10Y yield at 3.03% and moving -4.8 bp over 5 days [market_overview], while the FX backdrop shows EUR/USD at 1.1655 [market_overview]. Key observations include the Nikkei 225 leading on a 5-day basis at 2.65% while the DAX is the weakest performer at -1.12% [market_overview].Investment Thesis
The thesis has evolved from a simple inflation hedge to serving as “monetary insurance” in a structurally fragmented, resource-constrained world [T1]. Investors are pricing in a shift from the first inflation panic to the second phase of growth damage, anticipating a third phase where central banks pivot to accommodation as the economic engine falters [T1]. This structural foundation is underpinned by sovereign reserve diversification and persistent underinvestment in the physical economy [T1]. While short-term liquidity events may interrupt the accumulation cycle, central banks understand this dynamic, creating a durable demand floor even as gold faces headwinds from higher real yields [T1].Bullish Drivers
The primary bullish catalyst remains central bank accumulation. China extended its buying streak in April, while Goldman Sachs has raised its forecast to 60 tons per month for 2026 [T3]. Ghana has also mandated large-scale miners to sell 30% of output to the central bank [T4]. Net gold ETF inflows turned positive for the first time since early April, signaling institutional capitulation to the long-term case [T4]. A bullish pivot depends on the Fed acknowledging growth deterioration, which would force a reversal of the current rate-hike consensus [T1].Relative Positioning vs Bitcoin and Ethereum
Gold faces stiff competition from digital assets. BTC dominance stands at 57.24% [market_data], indicating crypto is absorbing significant speculative capital. Silver has shown relative strength through the recent selloff, holding its 50-day moving average and potentially outperforming gold if the macro regime tips toward stagflation [T4]. This suggests that while gold remains a safe haven, its relative appeal is being tested by high-beta assets, particularly as equities like the Nikkei 225 continue to outperform [market_overview].Scenario Framework
We model three distinct paths. Scenario A assumes the Fed hikes before year-end and oil prices remain elevated, keeping gold suppressed below 4,000 EUR. Scenario B envisions a soft landing where growth slows, prompting the Fed to cut rates and allowing gold to reclaim the 4,000 EUR level. Scenario C represents a hard landing or stagflation, where aggressive Fed easing and inflation fears drive gold to new all-time highs.Valuation Discussion
Valuation is currently stretched relative to real yields. UBS recently lowered its year-end target to $5,500 due to persistent risks from higher yields and a stronger dollar [T5]. The current price of 3,867.35 EUR is down 17.5% from the January ATH of 4,688.32 EUR [market_data], reflecting the premium investors currently demand for holding a non-yielding asset in a high-rate environment.Risks
The primary risks are short-term liquidity and demand destruction. Forced sovereign liquidations are currently weighing on the metal [T1]. India’s decision to hike import taxes from 6% to 15% [T3] threatens to significantly reduce physical demand. Furthermore, the Fed’s balance sheet is unlikely to contract significantly, limiting the scope for monetary easing that would otherwise support gold prices [T7]. Strain on central bank independence could also complicate the policy pivot narrative [T6].Appendix
Sources
- T1 – Gold’s forced sovereign liquidations could pave the way for the metal’s next great bull run – SPI’s Stephen Innes – KITCO
- T2 – China’s Gold Holdings Rise Again as Central Bank Extends Buying Streak – The Jerusalem Post
- T3 – Gold prices face double pressure from inflation, interest rates and new moves by India – Laodong.vn
- T4 – Gold SWOT: Net gold ETF inflows turned positive for the first time since early April – KITCO
- T5 – Gold falls as renewed US-Iran tensions dampen peace hopes, clouds interest rate outlook – KITCO
- T6 – Inflation fight again putting central bank independence under strain, policymakers say – Reuters
- T7 – Rule changes may only yield modest Fed balance sheet contraction – KITCO
This report is AI-generated, for informational purposes only, and does not constitute investment advice. The views expressed herein are those of the AI assistant and do not reflect the opinions of Venice.ai or any other entity.
Important Note / Wichtiger Hinweis:
EN: This report may have been generated using AI. It processes data from publicly available sources. The content is provided for informational purposes only.DE: Dieser Bericht kann mithilfe von KI erstellt worden sein. Dabei werden Daten aus öffentlich zugänglichen Quellen verarbeitet. Die Inhalte dienen ausschließlich Informationszwecken.
* DE: Die ergänzenden Inhalte können KI-generiert sein. EN: The additional content may be AI-generated.