
Watch the video
This player shows only the Gold chapter of the daily altii market briefing. Watch the full video on tube.altii.de.
Key Data Snapshot
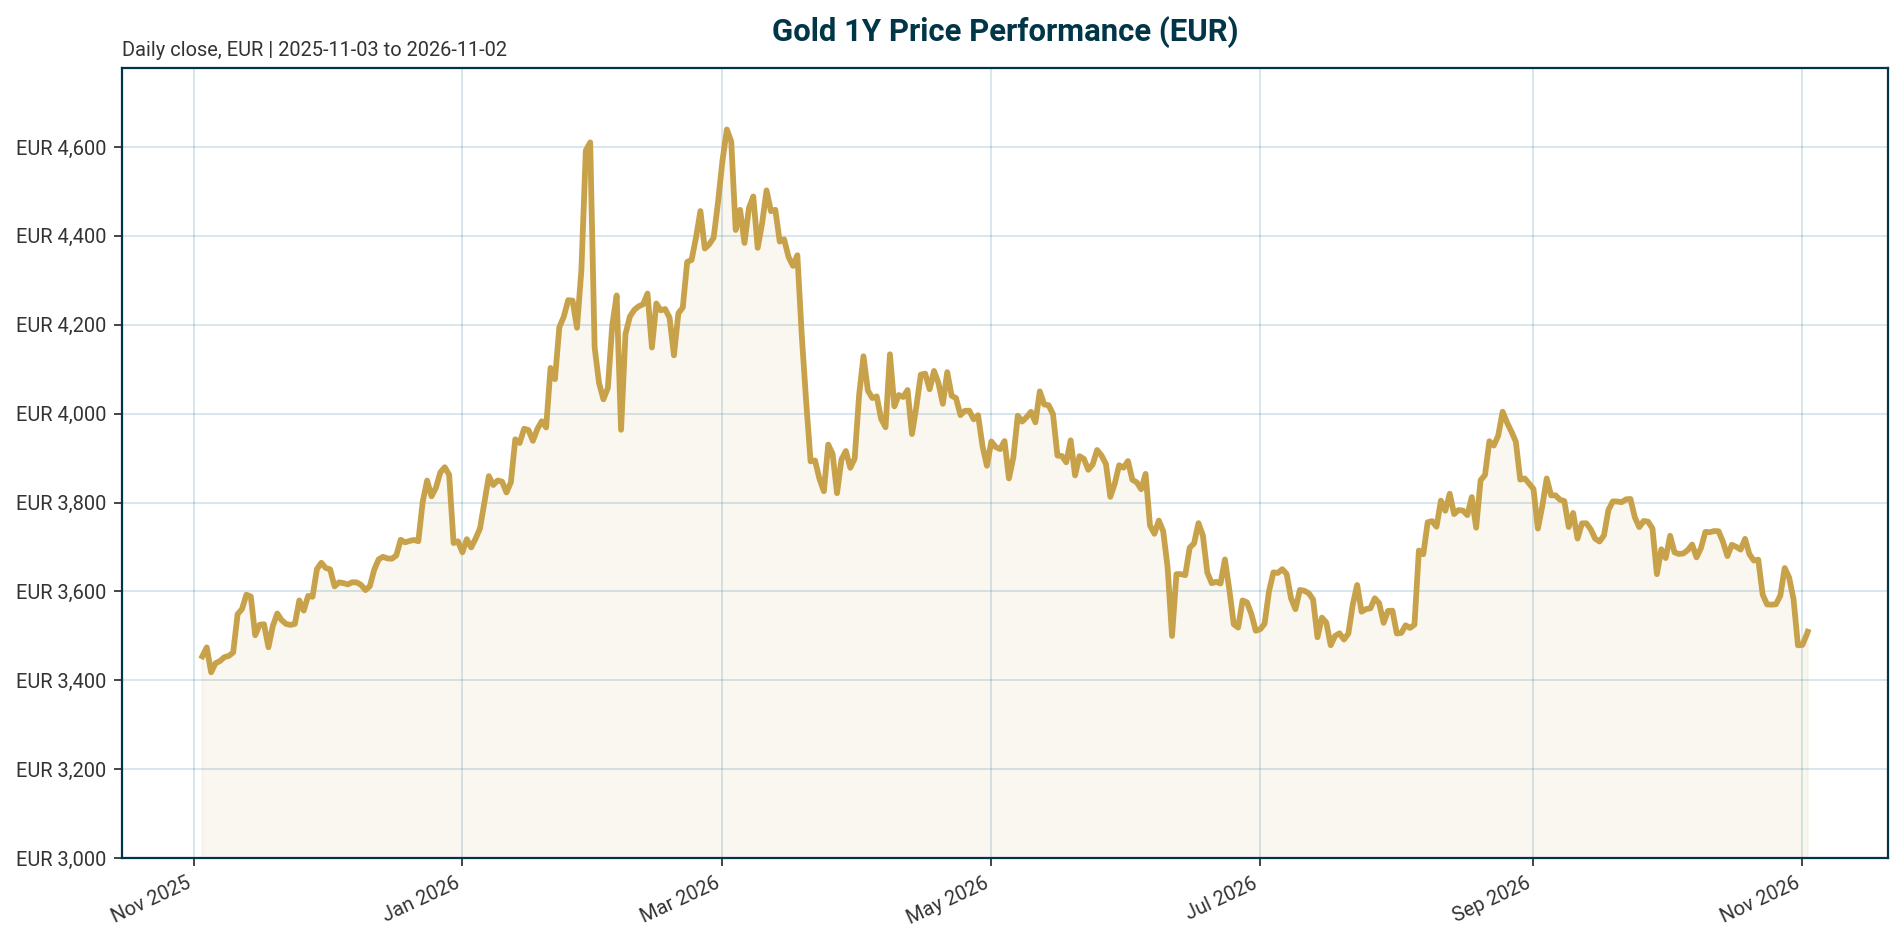
All price data retrieved 2026-11-02 05:20 UTC unless stated otherwise. The tracked instrument is PAX Gold (XAU/EUR proxy); its market capitalisation reflects the tokenised instrument, not the total gold market.
| Metric | Value | Change / Context |
|---|---|---|
| XAU/EUR price | 3,501.56 | +0.63% 24h; 24h range 3,479.35 to 3,507.50 (~0.81% intraday width) |
| 7d / 30d change | -2.70% / -5.86% | Short-term correction ongoing |
| 200d / 1y change | -18.80% / -2.38% | Deep 200-day drawdown, flat 1-year: correction, not trend break |
| All-time high (EUR) | 4,688.32 (2026-01-28) | Current drawdown -25.31% (3,501.56 / 4,688.32 – 1) |
| All-time low (EUR) | 1,265.28 (2019-11-17) | +176.74% above |
| Fed funds target | 3.75% to 4.00% (as of 2026-11-01) | Last change: +25 bp hike, effective 2026-09-17 |
| ECB deposit facility rate | 2.50% (as of 2026-10-31) | Last change: +25 bp hike, effective 2026-09-16 |
| Euro AAA 10Y yield | 3.37% (as of 2026-10-29) | -23.4 bp over 1 month; +42.5 bp YTD |
| Euro AAA 2Y / 5Y / 30Y | 3.01% / 3.11% / 3.61% | 1-month changes: -20.3 bp / -23.9 bp / -21.9 bp; 10Y-2Y spread 36.5 bp |
| EUR/USD | 1.1176 (as of 2026-11-02) | -4.89% YTD (stronger euro, a headwind for EUR-quoted gold) |
| EUR/CHF / EUR/JPY / EUR/GBP | 0.9214 / 176.18 / 0.8356 | All slightly lower on the day |
| Central bank gold buying | 1,000t average over past four years | vs 500t average over the prior decade; 89% of surveyed banks expect global reserves to rise [T4][T7] |
Macro Backdrop
Market overview: Risk sentiment is neutral to negative, with moderately negative equity momentum globally. DACH indices are outperforming: the DACH 5-day average sits at +2.00% versus -0.58% for global equity indicators, with the ATX strongest at +2.39% over 5 days and the Nasdaq Composite weakest at -2.80%. The rates backdrop is mixed: euro area AAA 10Y yields at 3.37% moved just 0.4 bp over 5 days, while the 10Y-2Y spread stands at 36.5 bp. FX is similarly mixed, with EUR/USD at 1.1176, up 0.12% over 5 days. This backdrop of softening risk appetite with resilient European equities is broadly neutral for gold, offering some safe-haven support while a stronger euro caps EUR-quoted upside.
Policy: The policy regime turned hawkish in September 2026. The Federal Reserve raised its target range by 25 bp to 3.75% to 4.00%, effective 2026-09-17, and the ECB raised its deposit facility rate by 25 bp to 2.50%, effective 2026-09-16. This contradicts the easing path markets expected earlier in the year: according to ING [T3], the Fed had left rates unchanged with Chair Powell requiring clearer inflation progress before easing, and ING’s US economist expected two 25 bp cuts in September and December. Lombard Odier, writing in May 2026 [T6], expected the Fed to hold for much of 2026 with a cut toward year-end. Those expectations were overtaken by actual hikes; any further rate moves discussed below are scenario assumptions or dated market expectations, not decisions.
Inflation and energy: According to BigGo Finance [T2] (undated in the dataset), Bundesbank President Nagel defended the ECB’s June and September 25 bp hikes and flagged supply-side price risks including low energy inventories, damaged refining capacity, droughts and fertiliser shortages. The same source reports oil rising from roughly $70 before the summer break to above $100 following the US-Iran conflict, a claim from a single undated source and treated with caution here. A stagflationary mix of slower growth with persistent inflation would, per ING [T3], remain supportive for gold over the longer term.
Investment Thesis
Gold in EUR is in a cyclical correction within a structurally re-anchored pricing regime. The asset trades 25.31% below its January 2026 high of 4,688.32 and 18.80% lower over 200 days, yet only 2.38% lower over one year. The correction coincides with two forces: a hawkish policy repricing (Fed and ECB both hiked in September 2026) and a stronger euro (EUR/USD down 4.89% YTD), which mechanically depresses EUR-quoted gold.
The structural argument rests on official-sector demand. SocGen, per Kitco News on 2026-09-03 [T1], remains “strategically bullish,” arguing a post-2022 regime shift means gold trades near record highs despite positive real yields, with central bank purchases, dedollarisation, geopolitical uncertainty and sovereign debt concerns providing a higher price floor. At the LBMA conference, participants noted gold’s negative correlation with bond yields is systematically weakening: gold held above $4,000/oz even as US Treasury yields topped 5%, and gold’s share of global central bank reserves has risen from roughly 14% in 2023 to nearly 25%, per Bundesbank’s Nagel [T2]. The World Gold Council’s 2026 survey [T4][T7] confirms the flow backdrop: 1,000t average annual purchases over four years versus 500t over the prior decade, a fivefold step-up in pace.
Base case: consolidation as central bank accumulation absorbs ETF softness and hawkish policy caps upside. Bull case: a stagflationary turn re-ignites the debasement trade toward the ATH region. Bear case: higher-for-longer real yields plus sustained ETF outflows extend the correction.
Bullish Drivers
- Official-sector flows: Central banks accumulated an average of 1,000t over the past four years versus a 500t average over the preceding decade [T4][T7]. Historical context: record purchases of 1,082t in 2022 and 1,037t in 2023 [T8].
- Reserve re-anchoring: Gold’s share of global central bank reserves rose from roughly 14% in 2023 to nearly 25%, and Nagel said the case for further diversification remains strong [T2].
- Forward intent: 89% of surveyed central banks expect global gold reserves to increase over the next 12 months; a record 45% expect their own reserves to rise [T7].
- EMDE leadership: 95% of emerging market and developing economy institutions cite geopolitical instability as a key allocation driver versus 67% in advanced economies; 90% cited gold’s crisis performance [T4].
- Systemic hedging signals: The Dutch central bank moved roughly 86 tonnes from New York and Ottawa to London between March and August 2026 for crisis preparedness, cutting the US share of Dutch gold from 31.3% to 18.5% [T2]. OMFIF notes gold’s growing role as a hedge against volatility, geopolitical risk and offshore-asset concerns [T5].
- Inflation narrative: Oil above $100 following the US-Iran conflict and ECB-flagged supply-side risks sustain the hedging case [T2], though this rests on a single undated source.
- ETF flows still positive: Inflows moderated sharply in 2026 but remained positive as of 2026-09-03, with lower volatility attracting longer-term reserve managers [T1]. This may be stale after the subsequent 200-day drawdown.
Relative Positioning vs Bitcoin and Ethereum
The bundle contains crypto aggregates but no Ethereum-specific price data, so the comparison stays at asset-class level and the ETH gap is disclosed explicitly. Total crypto market capitalisation stands at $2,342.1bn with $96.45bn in 24h volume and Bitcoin dominance at 60.05% (retrieved 2026-11-02). The tracked XAU/EUR instrument (PAX Gold) shows a market cap of 1.56bn EUR across 446,112 ounces, a proxy figure only.
With risk sentiment neutral to negative and the Nasdaq down 2.80% over 5 days, risk-off conditions historically favour gold over high-beta crypto. Gold’s differentiation is its official-sector legitimacy: SocGen notes lower volatility is improving gold’s appeal to reserve managers rather than momentum traders [T1], a demand channel crypto lacks entirely. In risk-off phases, capital rotates toward gold rather than crypto, supportive of relative gold positioning. If risk appetite recovers, crypto may outperform cyclically; gold’s case rests on the structural central bank channel rather than momentum.
Scenario Framework
All forward rate paths below are scenario assumptions or dated market expectations [T3][T6], not decisions. The confirmed policy anchor is Fed 3.75% to 4.00% and ECB 2.50%.
- Base case (assumption): Fed and ECB hold at current levels through the horizon; euro AAA 10Y drifts sideways to lower from 3.37% after its 23.4 bp one-month decline. Central bank buying absorbs ETF softness and gold ranges between the recent low near 3,479 and the mid-3,000s EUR. Probability-weighted outcome: consolidation.
- Bull case (assumption): Energy and supply shocks keep oil above $100 [T2], inflation expectations re-accelerate, and real yields fall despite nominal hawkishness. The debasement trade resumes and gold re-tests the 4,688.32 EUR ATH region. A stagflationary backdrop is explicitly supportive over the longer term per ING [T3].
- Bear case (assumption): Further tightening with falling inflation expectations lifts real yields; ETF outflows turn sustained and physical demand softens, per Lombard Odier’s risk list [T6]. Central bank buying slows per ING [T3], the structural floor gives way, and historical real-yield models, which SocGen says imply significantly lower prices [T1], reassert.
Valuation Discussion
Two valuation lenses point in opposite directions. On the historical real-yield model, gold looks expensive: SocGen states models keyed to real yields would imply significantly lower prices than current levels [T1]. On the reserve-share re-anchoring framework, gold looks closer to fair value after a 25.31% correction from the ATH, given the reserve share has roughly doubled from ~14% to ~25% [T2] and official buying runs at 250t per year versus 50t in the prior decade.
Currency attribution matters for the EUR investor. EUR/USD is down 4.89% YTD, meaning a stronger euro accounts for a meaningful share of the EUR-quoted drawdown. This is an approximation, as the FX figure is YTD while the gold drawdowns are 200-day and 1-year, but the direction is clear: part of the correction is currency, not gold-specific. The 1-year change of only -2.38% supports this reading.
Opportunity cost in EUR terms remains elevated: the euro AAA 10Y at 3.37% is up 42.5 bp YTD even after the recent 23.4 bp relief. A euro-area real yield cannot be computed because no HICP inflation print is in the dataset; the nominal yield is the best available proxy. ING’s claim that gold was up roughly 6% YTD [T3] is undated and likely predates the current correction; it should not be treated as current state. Net view: fairly valued on the structural framework, rich on the historical one, with the correction having improved the entry point for strategic EUR-based buyers.
Risks
- Higher-for-longer real yields: The primary headwind per ING and Lombard Odier [T3][T6]. Both central banks just hiked; further tightening is a live scenario given Nagel’s inflation warnings [T2].
- ETF and physical demand: A prolonged decline in ETF demand or weaker jewellery demand would remove private-sector support even if central bank buying continues [T6]. ETF flow data in the dataset is dated 2026-09-03 and may be stale.
- Slowing official-sector buying: ING warns central bank buying may slow [T3]. An abrupt stop in EMDE accumulation, the marginal price-setting channel, would remove the structural floor and let historical models reassert at materially lower levels [T1].
- EUR strength: A stronger euro (EUR/USD -4.89% YTD) mechanically depresses XAU/EUR regardless of USD-gold dynamics.
- Correlation regime risk: Analysts caution the debasement trade does not imply a one-way rally [T2]. If the weakened yield correlation reverses in a disinflationary tightening, the inflation-hedge premium compresses quickly.
- Mitigant: Deeper pullbacks likely attract central bank and longer-term buyers, limiting tail outcomes [T3].
- Data caveats: Several news items are undated; no US TIPS real-yield series, euro-area inflation print, current ETF flow data or 52-week low is available in the dataset.
Appendix
Methodology and data notes: Price data comes from the bundle market_data block, retrieved 2026-11-02T05:20:24Z. The instrument is PAX Gold (coingecko_id pax-gold), used as an XAU/EUR proxy; its 1.56bn EUR market cap reflects the tokenised instrument, not the gold market. Policy rates are taken exclusively from the authoritative Policy Rates block: US Federal Funds Target Range 3.75% to 4.00% (as of 2026-11-01; last change +25 bp hike, effective 2026-09-17) and ECB Deposit Facility Rate 2.50% (as of 2026-10-31; last change +25 bp hike, effective 2026-09-16). Yield curve data is from the ECB AAA yield curve as of 2026-10-29; FX from Frankfurter as of 2026-11-02; equities as of 2026-10-30 or 2026-11-02 as indicated.
Missing data disclosures: No US TIPS real-yield series, no euro-area HICP inflation print, no Ethereum price or performance series despite ETH being a configured benchmark, no dated ETF flow figures, no 52-week low and no realised volatility series are present in the dataset. Several Tavily news items (T2, T3, T4) are undated; claims from them are labelled accordingly and never presented as current state where they conflict with the Policy Rates block.
Sources:
- [T1] It’s time to get bullish on gold again, says SocGen | Kitco News (2026-09-03 by URL)
- [T2] Gold Holds Above $4,000 Even as US Treasury Yields Top 5% | BigGo Finance (undated)
- [T3] Geopolitics alone isn’t enough to lift gold | ING THINK (undated)
- [T4] Central Bank Gold Purchases Hit 1,000t Average: WGC Survey | Mexico Business News (survey window Feb 5 to May 19, 2026)
- [T5] Central banks are turning back to gold | OMFIF (2025-09-02)
- [T6] Gold’s slowdown doesn’t signal a reversal | Lombard Odier (2026-05 by URL)
- [T7] Central Bank Gold Reserves Survey 2026 | World Gold Council
- [T8] Central Bank Gold Reserves Survey | World Gold Council
Disclaimer: This report is AI-generated and provided for informational purposes only. It does not constitute investment advice, a recommendation, or an offer to buy or sell any financial instrument. Readers should conduct their own research and consult a licensed financial advisor before making investment decisions.
Important Note / Wichtiger Hinweis:
EN: This report may have been generated using AI. It processes data from publicly available sources. The content is provided for informational purposes only.DE: Dieser Bericht kann mithilfe von KI erstellt worden sein. Dabei werden Daten aus öffentlich zugänglichen Quellen verarbeitet. Die Inhalte dienen ausschließlich Informationszwecken.
* DE: Die ergänzenden Inhalte können KI-generiert sein. EN: The additional content may be AI-generated.