
The altii-Gold-Report: Gold (XAU) in EUR
Report date: 2026-11-03. All price data retrieved 2026-11-03T05:20 UTC. Gold quoted in EUR via the PAX Gold (PAXG) tokenized proxy.
Watch the video
This player shows only the Gold chapter of the daily altii market briefing. Watch the full video on tube.altii.de.
Key Data Snapshot
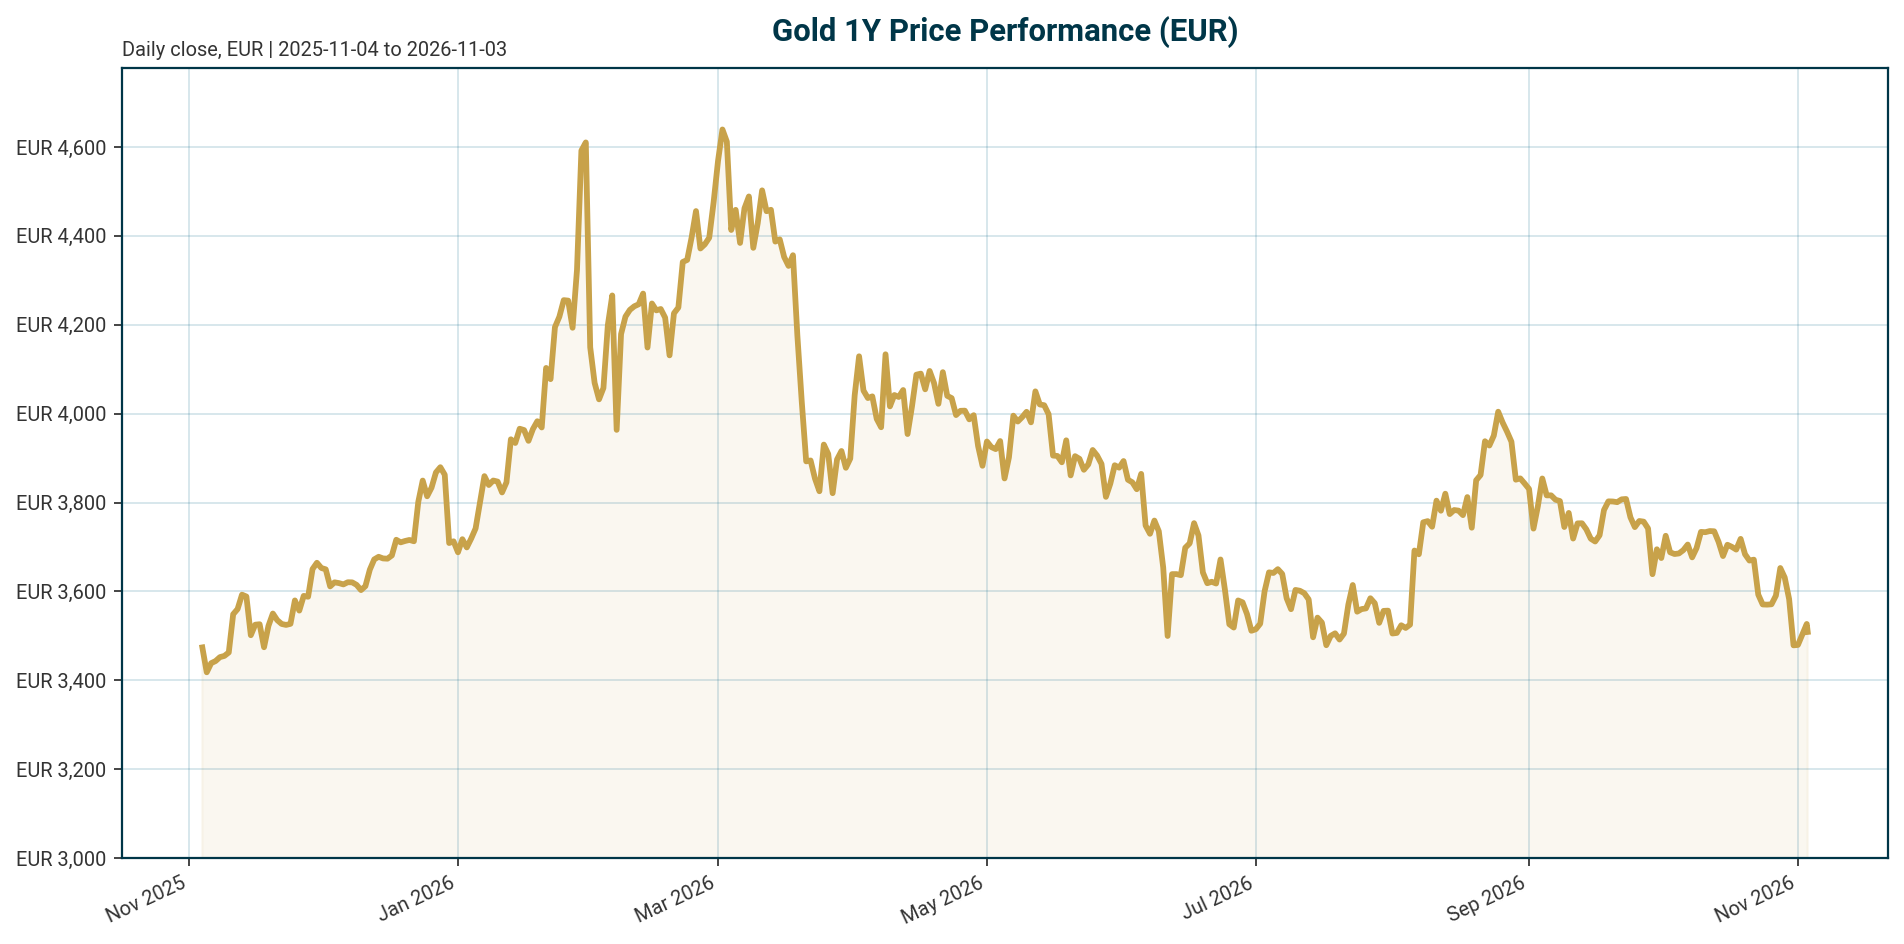
| Metric | Value | Comment |
|---|---|---|
| XAU price (EUR) | EUR 3,509.49 | 24h +0.24%, 1h -0.04% |
| 7d / 14d / 30d change | -2.41% / -5.26% / -5.38% | Corrective phase |
| 200d / 1y change | -17.79% / -2.04% | Correction concentrated in the last six months |
| All-time high | EUR 4,688.32 (2026-01-28) | Current drawdown -25.14%; implied recovery to ATH +33.59% |
| All-time low | EUR 1,265.28 (2019-11-17) | +177.37% above ATL |
| 24h range | EUR 3,486.47 to 3,546.60 | Volume 24h: EUR 77.4m (tracked instrument) |
| Fed funds target range | 3.75% to 4.00% (as of 2026-11-02) | Last change: hike of 25 bp, effective 2026-09-17 |
| ECB deposit facility rate | 2.50% (as of 2026-11-03) | Last change: hike of 25 bp, effective 2026-09-16 |
| Euro area AAA 10Y yield | 3.37% | -21.7 bp over 1 month; +41.7 bp YTD |
| AAA 10Y-2Y spread | 36.0 bp | 2Y at 3.01%, 30Y at 3.61% |
| EUR/USD | 1.1192 | +0.15% over 5 days, -4.75% YTD (EUR appreciation) |
Calculation check: drawdown from ATH = (3,509.49 / 4,688.32) – 1 = -25.14%. Upside to ATH = (4,688.32 / 3,509.49) – 1 = +33.59%. Policy stance: the Fed target range of 3.75% to 4.00% sits above the ECB deposit facility rate of 2.50%, a relevant differential for EUR/USD and thus for EUR-quoted gold.
Macro Backdrop
Market overview: Risk sentiment is negative and equity momentum is moderately negative, with the Nasdaq Composite the weakest 5-day performer at -4.96% and the S&P 500 down 2.35% over 5 days. DACH indicators are outperforming, averaging +0.77% over 5 days versus -1.48% for global equity indicators, and the DAX leads on a 1-month basis at +2.97%. The rates backdrop is mixed: euro-area AAA 10Y yields stand at 3.37% after a -0.9 bp 5-day move, with the 10Y-2Y spread at 36.0 bp. The FX backdrop is similarly mixed, with EUR/USD at 1.1192 (+0.15% over 5 days) and EUR/JPY the strongest 5-day mover at +0.20%. This combination of defensive equities, elevated but easing euro yields, and range-bound FX creates a cautiously supportive, though not decisive, setting for gold allocation.
Policy: Both major central banks are in restrictive territory. The Federal Reserve’s target range is 3.75% to 4.00% following a 25 bp hike effective 2026-09-17, and the ECB’s deposit facility rate is 2.50% following a 25 bp hike effective 2026-09-16. This is the principal cyclical headwind for a non-yielding asset: the opportunity cost of holding gold remains high on both sides of the Atlantic. Bundesbank President Nagel defended the ECB’s June and September 25 bp hikes and flagged supply-side inflation risks including low energy inventories and damaged refining capacity, according to [T1] (undated source). The same source reports oil rising from roughly USD 70 to above USD 100 after the US-Iran conflict; this figure is undated and should be treated with caution.
Yields: According to [T1] and [T2], both undated sources, the US 10-year Treasury yield has traded above 5%, near levels last seen in 2002. The dataset contains no current US Treasury yield, US CPI, or TIPS real-yield level, so the USD real-yield narrative rests entirely on these undated news claims. Euro-area AAA yields, by contrast, are firm in the dataset: the 10Y at 3.37% is down 21.7 bp over one month but up 41.7 bp year to date.
Investment Thesis
The core tension in gold today is between a structural re-anchoring of demand and a cyclical opportunity-cost headwind. On the structural side, gold’s share of global central bank reserves has risen from roughly 14% in 2023 to nearly 25%, according to Bundesbank President Nagel [T1]. Central banks now hold more gold than US Treasuries for the first time in roughly three decades [T4]. Projected official-sector buying stands at about 850 tonnes this year, nearly double the pace of the prior decade [T2], and a record 43% of 73 surveyed monetary authorities expect to increase their own gold reserves over the next year [T3]. The Dutch central bank’s relocation of 86 tonnes from the US and Canada to London between March and August 2026, framed as crisis preparedness, underscores that the official sector treats gold as operational reserve infrastructure, not a trade [T1].
On the cyclical side, restrictive policy rates (Fed target range 3.75% to 4.00%, ECB deposit facility rate 2.50%) and elevated yields keep the carry against gold punishing. The result in EUR terms is a -25.14% drawdown from the January 2026 ATH despite the structural bid remaining intact. Our base case, as a scenario assumption, is that official-sector demand and debasement hedging offset elevated real yields, keeping EUR gold in a consolidation below the ATH while the correction matures. A policy pivot from either central bank would be the trigger for a retest of EUR 4,688.32; further tightening would extend the drawdown.
Bullish Drivers
- Reserve re-anchoring: Gold at roughly 25% of global central bank reserves [T1] and exceeding US Treasury holdings for the first time in about 30 years [T4] represents a durable, price-insensitive demand floor.
- Official-sector volume: Projected central bank buying of about 850 tonnes this year, nearly double the prior decade’s pace [T2].
- Forward official intent: A record 43% of 73 surveyed monetary authorities expect to raise their own gold reserves over the next year [T3].
- Weakening yield correlation: LBMA conference participants noted gold’s traditional negative correlation with bond yields is systematically weakening; gold held above USD 4,000/oz even as US 10-year yields topped 5% [T1]. This decoupling reduces the sensitivity of gold to further yield shocks.
- Fiscal debasement trade: The US closed fiscal 2026 with a deficit near USD 2 trillion, record interest costs of USD 1.1 trillion, and gross debt above USD 40 trillion, according to [T2] (undated). This sustains the long-term purchasing-power argument.
- Sanctions and counterparty-risk hedging: Nations not allied with the United States are reducing dollar reserve vulnerability, and gold carries no counterparty risk [T3][T4]. Geopolitically exposed states near the Russia-Ukraine border are increasing reserves [T3].
- Defensive regime fit: Negative risk sentiment and equity drawdowns (Nasdaq -4.96% over 5 days) historically favor safe-haven allocation; gold’s +0.24% 24-hour move against falling equities is consistent with this.
- House view support: UBS expects a higher gold price in the medium term despite current pressure from rapidly rising real yields [T5].
Relative Positioning vs Bitcoin and Ethereum
The bundle provides only aggregate crypto data: Bitcoin dominance at 59.27%, total crypto market capitalization of USD 2.32 trillion, and total 24-hour crypto volume of USD 60.5 billion. Current Bitcoin and Ethereum prices are not in the dataset and are therefore not stated. The tracked gold instrument shows a market capitalization of EUR 1.57 billion on a circulating supply of 447,307 tokens; this reflects the tokenized PAXG proxy, not total above-ground gold, and should not be read as gold’s aggregate market value.
Structurally, the two asset classes sit at opposite ends of the risk spectrum. Gold is a non-yielding reserve asset with no counterparty risk, held by central banks as crisis infrastructure [T4]. Crypto assets behave as high-beta risk assets that historically track equities lower during drawdowns. The current regime illustrates the distinction: with risk sentiment negative and the Nasdaq down 4.96% over 5 days, gold’s 7-day decline of 2.41% is comparatively contained, and its 24-hour move is positive. As a scenario assumption, in a negative risk-sentiment regime gold behaves defensively while crypto amplifies equity beta; investors seeking a debasement hedge with lower drawdown risk will weight gold over crypto, while those accepting equity-like volatility for asymmetric upside will not. The 59.27% Bitcoin dominance figure indicates the crypto market remains concentrated in its largest asset rather than broadly risk-on.
Scenario Framework
All scenarios are assumptions, not forecasts. Current anchors: Fed funds target range 3.75% to 4.00%, ECB deposit facility rate 2.50%, euro-area AAA 10Y at 3.37%, EUR/USD at 1.1192.
| Scenario | Key assumptions | Implication for EUR gold |
|---|---|---|
| Bull | Inflation cools; Fed and ECB pivot from current restrictive levels; real yields fall; official buying holds near 850t/yr [T2] | Re-test of the EUR 4,688.32 ATH (+33.59% from spot), amplified if EUR/USD weakens from 1.1192 |
| Base | Rates on hold at current levels; euro yields consolidate; central bank buying continues; EUR/USD range-bound | Range-bound consolidation, roughly EUR 3,300 to 3,700; gold remains 15% to 25% below ATH while the correction matures |
| Bear | Renewed inflation shocks (the oil-above-USD-100 narrative in [T1], undated) trigger further hikes beyond the September 2026 moves; real yields rise | Break below recent lows; the -17.79% 200-day decline extends; drawdown beyond -25.14% from ATH deepens |
Context on expectations: according to [T2], an undated source, markets at the time priced roughly a 78% probability of the Fed leaving rates unchanged at that then-upcoming meeting. This is historical context from an undated source, not current pricing, which is not in the dataset. Note also that the euro-area AAA curve has eased 15 to 22 bp across 2Y to 30Y over the past month, a modest cyclical tailwind if it persists.
Valuation Discussion
Gold generates no income, so valuation rests on relative scarcity, flows, and opportunity cost rather than discounted cash flows. Two frameworks give conflicting answers. Under a real-yield framework, gold looks expensive: the historical inverse relationship between gold and real yields broke down over the past two years, with gold resilient in 2022 and returning +13% in 2023 despite real yields at post-2008 highs [T3]. If that correlation re-normalizes at today’s elevated yield levels, gold carries valuation risk. Under a flow and reserve-re-anchoring framework, the current level is a consolidation within a structural re-rating: gold at roughly 25% of global reserves [T1], central bank holdings exceeding Treasury holdings [T4], and projected buying near 850 tonnes [T2] imply demand that is largely price-insensitive.
Position within the range supports the consolidation reading. Gold sits -25.14% below its January 2026 ATH of EUR 4,688.32 but +177.37% above its 2019 ATL of EUR 1,265.28. The 200-day decline of -17.79% against a 1-year decline of only -2.04% shows the correction is concentrated in the last six months rather than a prolonged bear market. UBS expects higher medium-term prices despite current real-yield pressure [T5]. For EUR investors, currency is a mechanical valuation lever: EUR/USD at 1.1192 is -4.75% year to date, meaning EUR appreciation has depressed EUR-quoted gold returns; a reversal would lift EUR gold prices with no move in USD gold. A full EUR real-yield calculation is not possible: the euro-area inflation rate is not in the dataset and is not substituted here.
Risks
- Further policy tightening: With the Fed target range at 3.75% to 4.00% and the ECB deposit facility rate at 2.50% after September 2026 hikes, an extended hiking sequence would raise gold’s opportunity cost and pressure EUR-quoted prices.
- Elevated yields: The US 10-year yield above 5% cited in [T1] and [T2] (undated) remains an ongoing headwind. Supply-driven inflation shocks historically hurt gold early, as rising inflation expectations push bond yields higher [T7].
- Correlation regime risk: The weakening gold-yield correlation [T1] is a benefit only while it lasts. If it re-normalizes, gold becomes re-exposed to real-yield shocks it has recently ignored.
- No one-way trade: LBMA participants explicitly cautioned that the debasement trade does not imply a one-way rally [T1].
- Transitory hedge function: Gold’s inflation-hedge usefulness can be transitory rather than persistent [T3].
- Currency drag: EUR appreciation (EUR/USD -4.75% YTD) mechanically depresses EUR-quoted gold regardless of USD-gold dynamics.
- Data-quality risk: Key news figures, including the 5% US 10Y yield, 850-tonne buying projection, oil above USD 100, and the 78% Fed hold probability, come from undated Tavily sources and may be stale relative to the 2026-11-03 report date. Current US yields, US CPI, and euro-area inflation are not in the dataset.
Appendix
Methodology and Data Provenance
- Price data: XAU quoted in EUR via coingecko_id pax-gold (PAX Gold tokenized gold proxy, circulating supply 447,307), retrieved 2026-11-03T05:20 UTC. The EUR 1.57 billion market capitalization refers to the tracked tokenized instrument, not total above-ground gold.
- Policy rates: taken exclusively from the authoritative Policy Rates block. Fed funds target range 3.75% to 4.00% (as of 2026-11-02, FRED source); ECB deposit facility rate 2.50% (as of 2026-11-03, ECB key rate source). Effective dates can follow announcements by one or two days. The Fed target is stated only as the full range; no single-number Fed rate is used anywhere in this report.
- Market overview: ECB AAA euro-area yield curve (as of 2026-10-30), Frankfurter FX rates, and FMP/Stoxx equity indices (as of 2026-11-02/03). Timing mismatches between the yield curve and equity/FX as-of dates are noted.
- Missing data: current US 10-year Treasury yield, US CPI, euro-area inflation, TIPS real yields, Bitcoin and Ethereum spot prices, and Bank of Japan, Bank of England, and other central bank policy rates are not in the dataset and are not stated. [T8] references foreign central bank easing but is a June 2025 Federal Reserve report and must not be conflated with the current 2026 policy state.
- Source dating: all Tavily sources (T1 to T8) lack published_at dates. Figures attributed to them are undated claims and may be stale.
Sources
- [T1] Gold Holds Above $4,000 Even as US Treasury Yields Top 5% – Institutions Say Gold’s Pricing Logic Is “Re-Anchoring” – BigGo Finance
- [T2] Gold vs Silver: Macro Backdrop and Central Bank Buying – David Glassman, LinkedIn
- [T3] Is it a golden era for gold? – J.P. Morgan Private Bank U.S.
- [T4] A Historic Shift Is Happening in Global Reserves – YouTube
- [T5] Gold: Between inflation fears and diversification of reserves – UBS
- [T6] Gold Correction: Separating Short-Term Drivers from Long-Term – LinkedIn
- [T7] Gold gains ground as central banks retreat from dollar assets – Kitco News, Facebook
- [T8] The Fed – Monetary Policy: Monetary Policy Report (June 2025, Part 1) – Federal Reserve
Glossary
- ATH / ATL: All-time high / all-time low in EUR terms for the tracked instrument.
- Debasement trade: Allocation to hard assets such as gold driven by concerns over fiscal deficits and fiat currency purchasing power.
- Opportunity cost: The yield forgone by holding non-yielding gold instead of interest-bearing assets; elevated when policy rates are restrictive.
- PAXG proxy: A tokenized instrument fully backed by physical gold, used here as the EUR-quoted price series.
Compliance Disclaimer
This report is AI-generated, is provided for informational purposes only, and does not constitute investment advice, a recommendation, or an offer to buy or sell any financial instrument. Data may be incomplete, delayed, or stale, and several news-derived figures are undated. Readers should independently verify all information and consult a licensed financial advisor before making investment decisions.
Important Note / Wichtiger Hinweis:
EN: This report may have been generated using AI. It processes data from publicly available sources. The content is provided for informational purposes only.DE: Dieser Bericht kann mithilfe von KI erstellt worden sein. Dabei werden Daten aus öffentlich zugänglichen Quellen verarbeitet. Die Inhalte dienen ausschließlich Informationszwecken.
* DE: Die ergänzenden Inhalte können KI-generiert sein. EN: The additional content may be AI-generated.