
Watch the video
This player shows only the Gold chapter of the daily altii market briefing. Watch the full video on tube.altii.de.
Key Data Snapshot
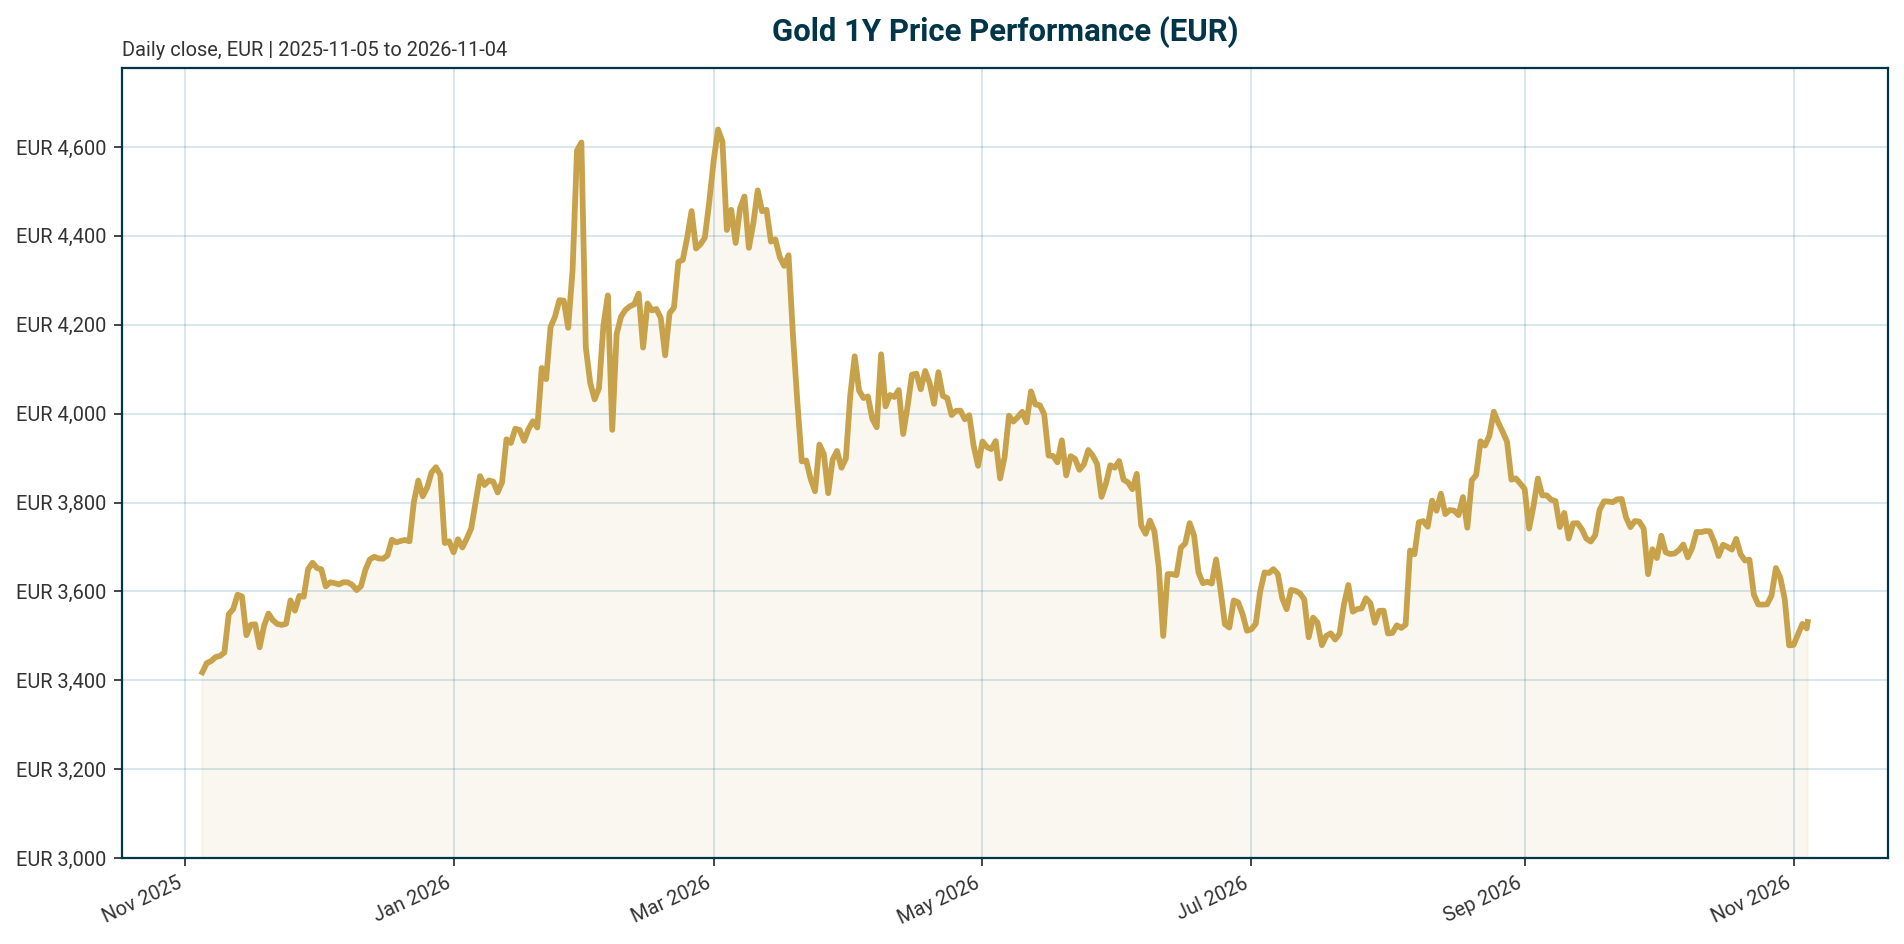
| Metric | Value | As of / Note |
|---|---|---|
| XAU price (EUR) | 3,523.82 EUR | 2026-11-04 05:21 UTC |
| 24h range | 3,473.73 to 3,534.27 EUR | +0.37% over 24h |
| 24h volume | 87.38m EUR | Tracked instrument |
| 7d / 30d change | -2.13% / -4.70% | Corrective phase |
| 200d / 1y change | -17.84% / -0.81% | Deep drawdown inside a flat year |
| All-time high (EUR) | 4,688.32 EUR on 2026-01-28 | Current price -24.84% below |
| All-time low (EUR) | 1,265.28 EUR on 2019-11-17 | Current price +178.50% above |
| Fed funds target | 3.75% to 4.00% | As of 2026-11-03; last change 25 bp hike effective 2026-09-17 |
| ECB deposit facility rate | 2.50% | As of 2026-11-04; last change 25 bp hike effective 2026-09-16 |
| Euro area AAA 10Y yield | 3.33% | As of 2026-11-02; -4.5 bp over 5 days, +37.8 bp YTD |
| Euro AAA 10Y-2Y spread | 33.3 bp | As of 2026-11-02 |
| EUR/USD | 1.1196 | As of 2026-11-04; -4.71% YTD |
| Market cap (tracked instrument) | 1.576bn EUR | Tokenised gold proxy, rank 53 |
Macro Backdrop
Risk sentiment is negative. Equity momentum is moderately negative globally, with the Nikkei 225 the weakest 5-day performer at -4.61% and the S&P 500 down 2.26% and the Nasdaq Composite down 4.44% over the same window. DACH indicators are outperforming, averaging -0.03% over 5 days versus -2.11% for global equity indicators, and the DAX leads on a 1-month basis at +2.51%. The rates backdrop is mixed: the euro area AAA 10Y yield sits at 3.33%, down 4.5 bp over 5 days but up 37.8 bp year to date, with the 2Y at 2.99% (+88.5 bp YTD) and a 10Y-2Y spread of 33.3 bp. FX is likewise mixed, with EUR/USD at 1.1196 (+0.15% over 5 days, -4.71% YTD) and EUR/JPY the strongest 5-day mover at +0.45%.
Policy is restrictive on both sides of the Atlantic. The Federal Reserve’s target range stands at 3.75% to 4.00% following a 25 bp hike effective 2026-09-17, and the ECB’s deposit facility rate is 2.50% after a 25 bp hike effective 2026-09-16. This hawkish turn is consistent with the inflation narrative in the source set: according to [T2] (undated source), Bundesbank President Nagel defended the ECB’s 25 bp hikes in June and September and cited oil rising from roughly $70 to above $100 after the US-Iran conflict. According to [T1] from September 2026, markets moved from pricing Fed easing to debating further hikes, pushing two-year Treasury yields back above 4%. For EUR-based investors, the 3.33% euro AAA 10Y yield keeps the opportunity cost of holding a non-yielding asset elevated, though the recent 5-day decline in yields is mildly supportive.
Investment Thesis
The core thesis is a structurally re-anchored gold price floor set against a restrictive-rate headwind, with EUR/USD as the performance overlay for euro-based holders. According to [T1] from September 2026, a clear post-2022 regime shift has emerged: gold has traded near record highs despite persistently positive real yields, breaking from historical models, because sustained central bank purchases, dedollarisation, geopolitical uncertainty and sovereign debt concerns provide a higher floor. The demand evidence is substantial. Central banks have accumulated an average of 1,000t of gold per year over the past four years, double the 500t average of the preceding decade, and 89% of surveyed central banks expect global gold reserves to rise over the next 12 months, with a record 45% expecting their own reserves to increase [T8]. According to [T2] (undated), gold’s share of global central bank reserves has risen from roughly 14% in 2023 to nearly 25%. According to [T4] from June 2026, central banks now hold more gold than Treasuries, and advanced-economy public debt-to-GDP ratios at or near post-war highs favour gold in historical resolutions of debt burdens through financial repression, inflation and currency depreciation.
The bearish counterweight is the rate regime. With the Fed at 3.75% to 4.00% and the ECB at 2.50% after September hikes, and euro AAA 10Y yields at 3.33%, the carry disadvantage of gold is material. The -17.84% 200-day drawdown in EUR terms shows this headwind is not theoretical. However, the 1-year return of -0.81% versus the 200-day figure of -17.84% implies the correction has been concentrated within the year, and the structural bid has so far prevented a deeper reset. SocGen remains strategically bullish, arguing that much of the hawkish adjustment is already priced and that downside risk for gold is increasingly limited [T1].
Bullish Drivers
- Official-sector demand. The 1,000t four-year average annual accumulation versus the prior 500t decade average is a 2x demand shift [T8]. A record 45% of surveyed central banks expect to raise their own reserves over the next 12 months, and 89% expect global reserves to rise [T8]. According to [T5] (undated), 43% of 73 monetary authorities expected their own reserves to increase, with geopolitically exposed countries leading accumulation.
- Reserve logistics signal conviction. The Dutch central bank moved approximately 86 tonnes from the US and Canada to London between March and August 2026, cutting the US share of Dutch gold from 31.3% to 18.5% and making London the largest storage location at 32.1%, explicitly framed as crisis preparedness [T2].
- Inflation persistence. Oil above $100 after the US-Iran conflict, per Nagel as reported in [T2] (undated), and energy prices complicating the path to monetary easing [T3] support the inflation-hedge narrative. A stagflationary mix of slower growth with persistent inflation would remain supportive for gold longer term [T3].
- Fiscal and debasement dynamics. Post-war-high debt ratios in advanced economies historically resolve through inflation, repression or currency depreciation, all gold-favourable [T4].
- Safe-haven flows. Negative risk sentiment in the current bundle reading, with global equities under pressure, supports defensive demand. Lower volatility is improving gold’s appeal to longer-term reserve managers, and ETF inflows, while moderated, remain positive [T1].
Relative Positioning vs Bitcoin and Ethereum
The tracked XAU instrument shows a market cap of 1.576bn EUR and rank 53, but this reflects a tokenised gold proxy (circulating supply 447,304.82 oz), not the physical gold market, so cross-asset market cap comparisons with Bitcoin or Ethereum are not meaningful and direct crypto benchmark pricing for this bundle is unavailable. What the data does support is a beta comparison. Over the past 5 days, gold fell 2.13% while the Nasdaq Composite fell 4.44% and the S&P 500 fell 2.26%, consistent with gold’s lower-beta profile in a negative risk-sentiment regime. Gold’s -24.84% drawdown from its EUR-term ATH against a -0.81% 1-year return also illustrates a shallower structural volatility profile than high-beta digital assets typically exhibit. The decisive differentiation is the demand channel: central bank reserve accumulation and vaulting behaviour [T8] [T2] have no analogue in Bitcoin or Ethereum. In an easing-pivot regime, crypto assets would likely outperform gold on liquidity beta; in the current restrictive, risk-off regime, gold’s case rests on official-sector demand and crisis hedging rather than momentum.
Scenario Framework
All forward paths below are scenario assumptions, not decisions. The current policy anchor is the Fed at 3.75% to 4.00% (hike of 25 bp effective 2026-09-17) and the ECB at 2.50% (hike of 25 bp effective 2026-09-16).
- Hawkish continuation. Further hikes or extended holds keep euro real yields elevated. Gold grinds lower or ranges in EUR terms, with central bank buying the key offset. SocGen judges that it would take a materially larger inflation shock and a much more aggressive Fed response to generate another significant rates repricing [T1].
- Status quo restrictive. Rates unchanged into year-end. Lombard Odier expected in May 2026 that the Fed would keep rates on hold for much of 2026 with any cut more likely towards year-end [T7]; that expectation was partially overtaken by the September hike, but the hold-into-year-end variant remains a plausible market expectation. Gold consolidates below the 4,688.32 EUR ATH with a firm structural floor.
- Easing pivot. According to [T3] (undated, and inconsistent with the September hike), ING’s US economist expected two 25 bp cuts in September and December; this should be read only as a dated market expectation. Cuts would reduce real yields and the opportunity cost of gold, historically the strongest regime for gold upside [T5] [T7].
- Stagflation path. Slower growth with persistent inflation, per [T3], is explicitly supportive for gold over the longer term and could combine with either rate path.
Valuation Discussion
At 3,523.82 EUR, gold sits 24.84% below its January 2026 peak but 178.50% above its 2019 low, a wide historical band that resists a simple cheap-or-expensive verdict. The calculation matters: (3,523.82 – 4,688.32) / 4,688.32 = -24.84%, confirming the bundle figure. The valuation debate hinges on which pricing model applies. Under the historical real-yield model, elevated euro AAA 10Y yields of 3.33% would imply materially lower fair value; Lombard Odier noted in May 2026 that the inverse real-yield relationship has re-asserted itself in recent months [T7]. Under the re-anchoring thesis, the post-2022 decoupling means gold held above $4,000/oz in USD terms even with US Treasury yields above 5%, and the negative yield correlation is systematically weakening [T2] (undated). If the re-anchoring holds, the current drawdown is a correction within a structurally higher range, not a valuation reset. Two further points for EUR investors. First, EUR/USD at 1.1196 is down 4.71% YTD, so EUR-quoted gold embeds a currency tailwind relative to USD gold; metal performance and FX translation must be separated. Second, gold has no earnings or cash-flow anchor. Valuation rests on relative scarcity, official demand and monetary credibility, which argues for a floor-based approach built on central bank bids at drawdowns, per [T3]’s observation that deeper pullbacks attract official and long-term buyers, rather than a discount-model approach.
Risks
- Higher-for-longer real yields. Explicitly flagged as the primary negative factor, alongside prolonged ETF demand decline and weaker physical or jewellery demand [T7].
- ETF momentum decay. Inflows have moderated sharply this year, though they remain positive [T1]. A turn to outflows would remove a marginal demand pillar.
- Central bank buying slowdown. Official buying may slow [T3], and the debasement trade does not imply a one-way rally [T2]. A material slowdown from the ~1,000t pace would re-expose gold to real-yield models.
- Rates repricing tail risk. A larger inflation shock forcing a much more aggressive Fed response is the main threat to the floor thesis [T1].
- FX reversal. A stronger euro would mechanically depress EUR-quoted gold even with stable USD gold. EUR/USD at 1.1196 after a -4.71% YTD move leaves room for mean reversion.
- Policy direction uncertainty. Both central banks hiked in September 2026, yet source expectations conflict: [T3] (undated) anticipated cuts while [T1] from September 2026 noted a live hike debate. Positioning for either direction carries two-sided risk.
- Attribution risk. The bundle’s -17.84% 200-day drawdown is not directly explained by any source in the dataset; causal narratives about the correction should be held loosely.
Appendix
Data provenance. All price and market data come from the bundle as of 2026-11-04T05:21 UTC. Equity and FX data are as of 2026-11-03 or 2026-11-04; the euro area AAA yield curve is as of 2026-11-02. Policy rates are sourced exclusively from the bundle’s policy_rates block: Fed funds target 3.75% to 4.00% (as of 2026-11-03) and ECB deposit facility rate 2.50% (as of 2026-11-04). US real yields (TIPS) and euro breakeven inflation data are not in the dataset, so the real-yield discussion relies on dated source statements and labelled assumptions.
Measurement caveat. XAU market data reflect the tracked tokenised instrument (PAX Gold proxy, circulating supply 447,304.82 oz, market cap 1.576bn EUR), not the full physical gold market. Market cap rankings and volume figures therefore understate gold’s true scale and should not be compared directly with crypto assets or equities.
Source dating caveats. T1 is dated September 2026 via URL, T7 May 2026 via URL, T4 June 2026 via URL, and T6 September 2025. T2, T3 and T5 are undated; figures from these sources, such as oil above $100, US 10Y yields above 5% and gold above $4,000/oz, are flagged as undated and must not be read as current state. T3’s URL is malformed in the source feed; the citation is retained by title and ID.
Definitions. Real yield: the inflation-adjusted interest rate, representing the opportunity cost of holding non-yielding gold [T5]. Debasement trade: allocation to hard assets such as gold as a hedge against fiscal dominance, monetary expansion and erosion of fiat purchasing power [T2]. Policy rate range: the Fed’s target is expressed as a range (3.75% to 4.00%), while the ECB deposit facility rate is a single rate (2.50%).
Sources
- [T1] It’s time to get bullish on gold again, says SocGen | Kitco News
- [T2] Gold Holds Above $4,000 Even as US Treasury Yields Top 5% | BigGo Finance
- [T3] Geopolitics alone isn’t enough to lift gold | ING THINK
- [T4] Report: Central Banks Now Hold More Gold Than Treasuries | CEOWORLD Magazine
- [T5] Is it a golden era for gold? | J.P. Morgan Private Bank U.S.
- [T6] Central banks are turning back to gold | OMFIF
- [T7] Gold’s slowdown doesn’t signal a reversal | Lombard Odier
- [T8] Central Bank Gold Reserves Survey 2026 | World Gold Council
Disclaimer. This report is AI-generated, is provided for informational purposes only, and does not constitute investment advice. Figures should be independently verified before any investment decision.
Important Note / Wichtiger Hinweis:
EN: This report may have been generated using AI. It processes data from publicly available sources. The content is provided for informational purposes only.DE: Dieser Bericht kann mithilfe von KI erstellt worden sein. Dabei werden Daten aus öffentlich zugänglichen Quellen verarbeitet. Die Inhalte dienen ausschließlich Informationszwecken.
* DE: Die ergänzenden Inhalte können KI-generiert sein. EN: The additional content may be AI-generated.