
Watch the video
This player shows only the Gold chapter of the daily altii market briefing. Watch the full video on tube.altii.de.
Key Data Snapshot
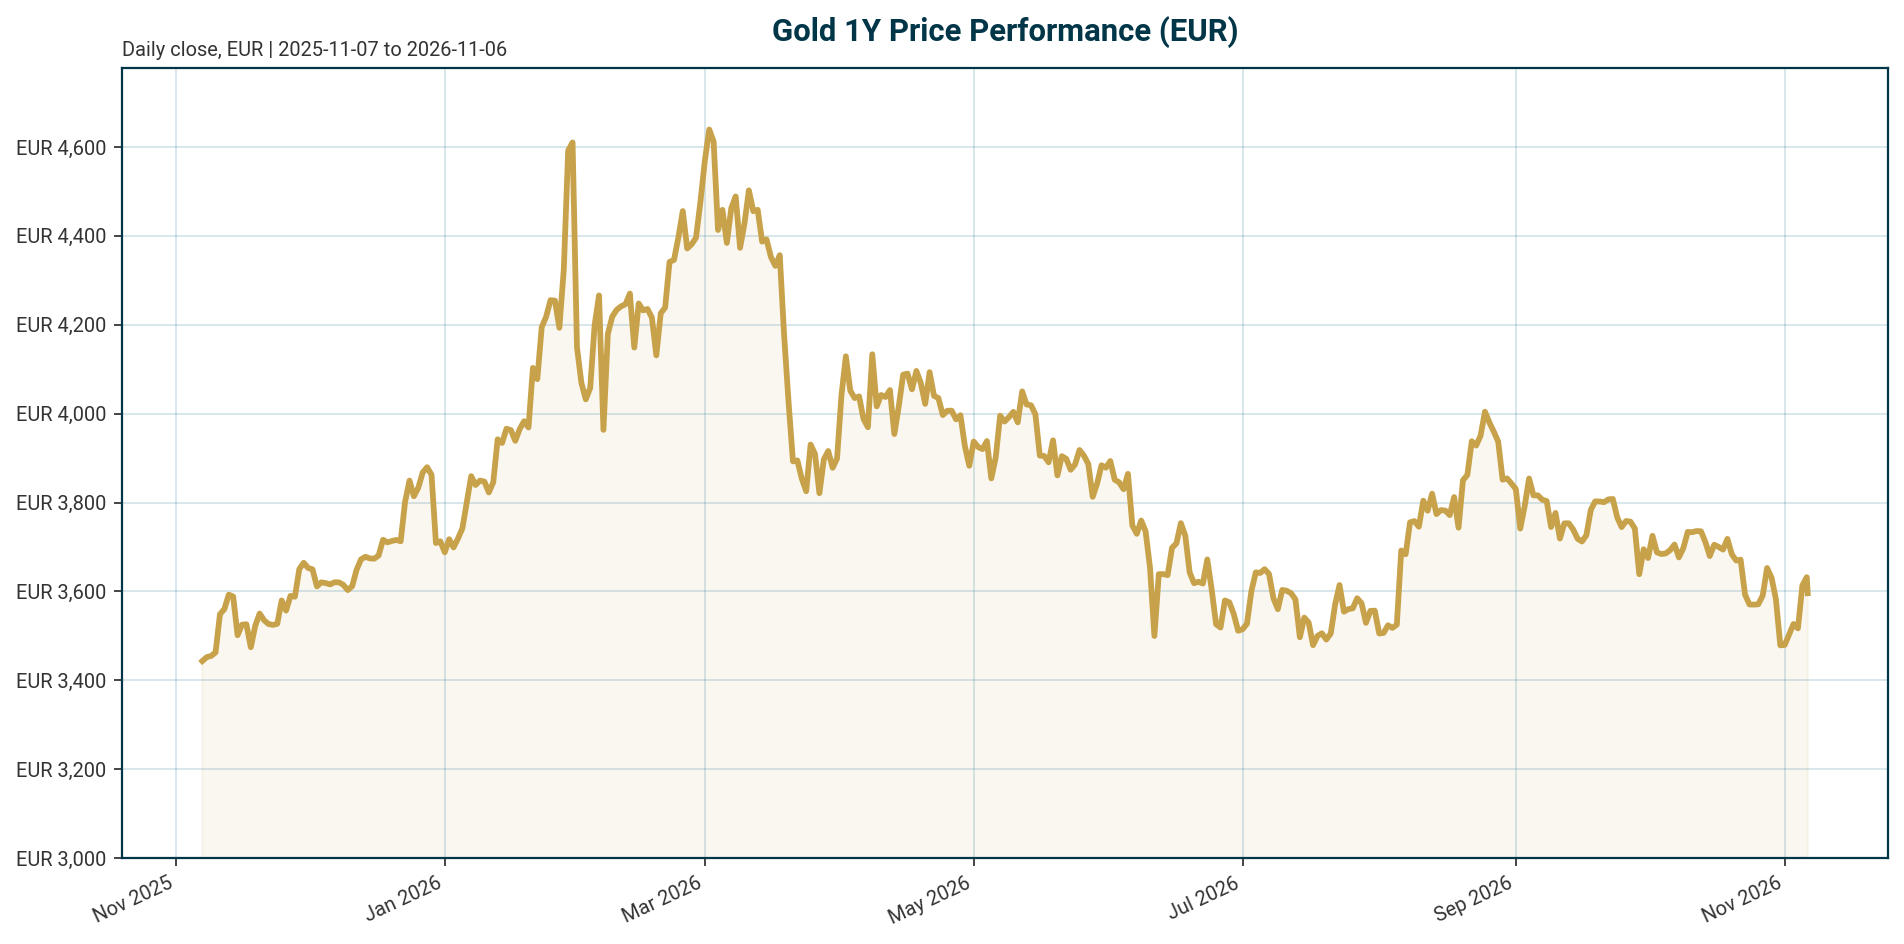
Gold (XAU, EUR-quoted via the tokenized instrument PAXG) trades at EUR 3,606.50, down 1.49% over 24 hours and 23.07% below its all-time high of EUR 4,688.32 set on 2026-01-28. The 12-month return is marginally positive at +1.41%, but the 200-day return of -15.47% confirms a corrective regime.
| Metric | Value |
|---|---|
| Price (EUR) | 3,606.50 |
| 24h range | 3,599.38 to 3,686.60 (range width ~2.42% of spot) |
| 24h / 7d / 30d change | -1.49% / +1.03% / -2.72% |
| 200d / 1y change | -15.47% / +1.41% |
| All-time high | EUR 4,688.32 (2026-01-28); current drawdown -23.07% |
| All-time low | EUR 1,265.28 (2019-11-17); +185.04% above |
| Tokenized market cap / 24h volume | EUR 1.61bn / EUR 165.0m |
| Circulating supply | 447,724.83 oz-equivalent |
| Fed funds target | 3.75% to 4.00% (last change: +25 bp hike, effective 2026-09-17) |
| ECB deposit facility rate | 2.50% (last change: +25 bp hike, effective 2026-09-16) |
Scenario framing: if spot holds above the 24h low of EUR 3,599.38, the 7-day recovery (+1.03%) can extend; a break below reopens the 30-day downtrend.
Macro Backdrop
Market overview: Risk sentiment is neutral to negative, with equity momentum broadly negative. DACH equities are outperforming: DACH indicators average +1.69% over five days versus -3.01% for global equity indicators, with the DAX up 3.44% over one month while the Nikkei 225 is the weakest five-day performer at -9.09% and the Hang Seng the strongest at +4.45%. The rates backdrop is mixed in the euro area: the AAA 10Y yield sits at 3.34% after a -3.3 bp five-day move, with a 10Y-2Y spread of 34.2 bp. FX is mixed: EUR/USD at 1.1251 (+0.54% over five days, -4.25% YTD) and EUR/JPY the strongest five-day mover at +0.89%. This backdrop is modestly supportive for EUR-quoted gold through falling euro long-end yields, but the euro’s recent strength is a mild drag on the local-currency quote.
The policy backdrop is restrictive on both sides of the Atlantic. The Fed funds target stands at 3.75% to 4.00% after a 25 bp hike effective 2026-09-17, and the ECB deposit facility rate is 2.50% after a 25 bp hike effective 2026-09-16. US yields remain elevated: the 10-year Treasury paid 4.9% and the 10-year TIPS real yield stood at 2.64% on November 4 according to [T3]. Post-midterm, the 10-year yield declined roughly 2.1 bp to 4.9291% and the two-year slipped to 4.6017% per [T7] from November 2026, providing a temporary yield tailwind.
Three scenarios frame the backdrop. Base case: mixed-to-negative risk sentiment with falling euro long-end yields is neutral to mildly supportive for EUR-gold. Risk-off acceleration: if the Nikkei-style equity drawdown propagates to US markets, defensive gold demand could offset the liquidity-driven selling seen in prior risk-off episodes per [T5]. Reflation shock: a renewed energy-driven inflation surprise would keep both the Fed and ECB restrictive, pressuring gold via higher real yields per [T5].
Investment Thesis
The core thesis is that gold’s historical real-yield sensitivity has weakened because the marginal buyer has changed. Textbook logic says gold should struggle when bonds pay a solid real return: the 10-year TIPS yield of 2.64% on November 4 is historically a headwind [T3]. Yet official-sector buying continued regardless. Central banks now price sanctions risk and government debt loads rather than Treasury carry, which weakens gold’s old link to interest rates [T3].
The demand evidence is substantial. A record 43% of 73 surveyed monetary authorities expect their own gold reserves to rise over the next year [T1]. Gold-backed ETFs added 211.2 metric tons after second-quarter outflows, lifting global holdings to a record 4,256 tons, with inflows tied to fiscal-sustainability and inflation concerns according to [T3] from November 2026. The dollar’s share of central bank reserves has fallen to 59%, a 25-year low per IMF data cited by [T8], and emerging market central banks led by Russia and China doubled their gold demand over 2021 to 2023 [T8]. China’s central bank added 8.1 tonnes in April, extending a 15-month buying streak to roughly 2,305 tonnes of holdings per [T5].
Supply is inelastic. Mine output rose 3% to a third-quarter record of 1,071 tons, yet total supply slipped about 1% as recycling weakened and producers reduced hedging [T3]. Against this, the restrictive policy backdrop is the main offset: with the Fed at 3.75% to 4.00% and the ECB at 2.50% after September 2026 hikes, the carry cost of holding a zero-yield asset is elevated.
Base case: structural official-sector and ETF demand absorbs elevated real yields and EUR-gold consolidates. Bullish scenario: a growth slowdown forces policy easing beyond consensus; the World Gold Council’s slowdown scenario sees gold 5% to 15% higher in 2026 from current levels [T4]. This is a scenario assumption, not a decision. Bearish scenario: persistent inflation keeps the Fed hiking from 3.75% to 4.00%, real yields rise further, and the decoupling thesis is tested.
Bullish Drivers
- Price-insensitive official bid: central bank buying has exceeded jewelry demand per [T3] from November 2026, a structural shift in the marginal buyer.
- Record ETF holdings: 4,256 tons globally after +211.2 tonnes of quarterly inflows [T3]. At that pace, roughly 70 tonnes per month of Western investment demand compounds the official bid.
- Reserve diversification: worries over inflation, deteriorating US fiscal health, Federal Reserve independence, and geopolitical instability are driving reserves away from dollars [T2]. Fed independence concerns could accelerate official-sector diversification further.
- Geoeconomic supercycle: a supercharged geopolitical environment plus generalized dollar weakness drove one of gold’s strongest annual returns since 1971 [T4].
- Post-midterm tape improvement: lower Treasury yields and a softer dollar improved the near-term backdrop per [T7] from November 2026. Gold prices rose an average of 14% in the 12 months following the last 13 midterm elections per the same source.
- Portfolio diversification: lacklustre bond returns and concerns over equity froth support allocation demand across regions [T4].
- Falling EUR-based opportunity cost: the euro-area AAA 10Y yield fell 16.2 bp over one month to 3.34%, lowering the local carry disadvantage for euro investors.
Relative Positioning vs Bitcoin and Ethereum
The bundle names gold and ethereum as benchmark assets but contains no Bitcoin or Ethereum price or performance data; a quantitative relative-performance comparison is therefore unavailable. What the data does show: total crypto market capitalization stands at USD 2.29 trillion with USD 93.8 billion of 24h volume, and Bitcoin dominance is 59.16%. Gold’s tokenized vehicle ranks 52 by market cap at EUR 1.61bn, a proxy vehicle rather than the physical gold market.
Qualitatively, the positioning case is clear. In a risk-off equity regime (S&P 500 -5.95% and Nasdaq -11.90% over one month), gold’s demand drivers, central banks and ETF allocations, are orthogonal to crypto’s flow-driven beta. Gold’s profile, +1.41% over one year against a -23.07% drawdown from its January peak, illustrates a lower-beta corrective profile suited to portfolio insurance rather than return maximization. If risk appetite stabilizes, crypto’s higher beta could reassert; gold’s role in a gold-versus-crypto allocation is diversification, not upside capture.
Scenario Framework
Base case (assumption): the Fed holds 3.75% to 4.00% near term, 10-year TIPS real yields stay above roughly 2.5%, and central bank buying continues. EUR-gold ranges sideways with upward drift. Consensus inputs per the World Gold Council: global GDP growth of 2.7% to 2.8% y/y, around 75 bp of additional Fed cuts, core CPI/PCE falling 40 to 60 bp by year-end, and the dollar edging higher [T4]. These are market expectations, not decisions.
Bull case (assumption, per [T4]): a growth slowdown and softer labour market prompt the Fed to cut beyond the roughly 75 bp consensus, weakening the dollar and raising risk aversion. The WGC analysis sees gold 5% to 15% higher in 2026 from current levels depending on the severity of the slowdown. Applied to EUR 3,606.50, this implies scenario targets of roughly EUR 3,787 to EUR 4,147. These are scenario outputs, not forecasts of decided policy.
Bear case (assumption): resilient employment and persistent inflation keep the Fed on a restrictive path per [T7] from November 2026. For context, [T6] reports market expectations of a December Fed hike; this is a dated expectation, not a decision. Rising real yields and a stronger dollar would pressure EUR-gold toward retesting the 30-day lows and risk extending the -23% drawdown. Energy-shock dynamics, where higher oil pushes inflation up, keeps central banks on hold and strengthens the dollar, are the classic transmission per [T5].
Valuation Discussion
EUR-gold sits mid-regime: 23.07% below its January 2026 peak of EUR 4,688.32 but 185.04% above its 2019 low of EUR 1,265.28. Neither cheap nor extreme on a drawdown basis.
Calculation, implied USD cross-check: EUR 3,606.50 x 1.1251 (EUR/USD) implies roughly USD 4,058 per ounce. Spot gold near USD 4,125 was cited in [T6], suggesting the tokenized EUR quote trades at a discount of roughly 1.6% to that referenced USD spot level. This gap may reflect FX timing differences or a tokenized-vehicle discount, and it matters for execution.
Calculation, carry cost: for a EUR investor, the opportunity cost is the euro-area AAA 10Y yield of 3.34% minus gold’s zero yield. In USD terms, the 10-year TIPS real yield of 2.64% per [T3] is the benchmark opportunity cost. Both are historically high hurdles for a non-yielding asset.
Calculation, FX attribution: the 1-year EUR-gold return of +1.41% embeds a currency drag. With EUR/USD down 4.25% YTD, the euro’s strength against the dollar has absorbed a meaningful share of USD-gold’s advance for euro-based holders.
Model regime: the historical inverse real-yield relationship has broken down for roughly two years per [T1]. The Banque de France attributes gold’s rise despite rising real rates, disinflation and a strong dollar to emerging market central bank and investor demand [T8]. The WGC Gold Valuation Framework shows rangebound value under consensus macro inputs [T4]. Two readings follow. If the decoupling regime holds, the -23% drawdown is a valuation reset within a structural bull, not a trend break. If the real-yield link reasserts at a 2.64% TIPS yield, carry-anchored fair-value models would imply material downside from current levels.
Risks
- Policy-path risk: both the Fed (3.75% to 4.00%) and the ECB (2.50%) hiked in September 2026. Further tightening would raise real yields and the carry cost of gold. A hawkish Fed surprise with sticky inflation is the primary bearish trigger.
- Expectations dispersion: [T6] reports market expectations of a December Fed hike, while [T4] consensus expects roughly 75 bp of cuts. This dispersion is itself a volatility source.
- Safe-haven failure risk: in supply-driven energy shocks, gold sells off with risk assets as yields and the dollar rise [T5].
- Liquidity risk: gold is used as a source of funds in drawdowns, amplifying selloffs [T5]. The 2.42% intraday range in the tokenized vehicle may reflect its own liquidity rather than physical spot.
- FX risk for EUR investors: a EUR/USD recovery from 1.1251 would mechanically depress the EUR quote even if USD-gold holds.
- Demand-concentration risk: the thesis leans heavily on price-insensitive central bank buying. A pause, for example from China, would remove the marginal bid. A central bank pause coinciding with ETF outflows would remove both demand pillars simultaneously and is the key tail risk.
- Data caveat: the EUR price and market cap reflect a tokenized gold instrument (PAXG, EUR 1.61bn market cap), which can trade at premiums or discounts to physical spot.
Appendix
Methodology and Data Provenance
Market data was retrieved 2026-11-06 at 05:19 UTC. Policy rates come exclusively from the bundle’s authoritative Policy Rates block: the US Federal Funds Target Range of 3.75% to 4.00% as of 2026-11-05 (source: FRED), last change a 25 bp hike effective 2026-09-17; and the ECB Deposit Facility Rate of 2.50% as of 2026-11-06 (source: ECB key rate), last change a 25 bp hike effective 2026-09-16. No other central bank policy rates, including the Bank of Japan or Bank of England, are in the dataset. Euro-area yields come from the ECB AAA yield curve as of 2026-11-04; FX from ECB reference rates as of 2026-11-06.
News-derived figures are quoted with source attribution and dates where available: [T3] and [T7] are from November 2026. Sources [T1], [T2], [T4], [T5], [T6] and [T8] lack publication dates and are treated as context, never as current market state. Any forward rate path cited in this report is labelled as a market expectation or scenario assumption, never as a decided policy action.
Definitions
- 10Y TIPS real yield: the inflation-adjusted US 10-year yield, used as the opportunity cost of holding zero-yield gold.
- EUR-quote mechanics: the EUR price approximates USD-gold divided by EUR/USD; currency moves affect the EUR quote independently of USD-gold.
- Tokenized gold (PAXG): a blockchain-based gold proxy, one token per troy ounce, used here as the EUR-quoted price source; it is not the physical gold market.
Sources
- [T1] Is it a golden era for gold? | J.P. Morgan Private Bank U.S.
- [T2] COMMENTARY: Gold’s rise in central bank reserves appears unstoppable (Reuters)
- [T3] Central Banks Just Bought More Gold Than the World’s Jewelry Buyers (24/7 Wall St., November 2026)
- [T4] Gold Outlook 2026: Push ahead or pull back (World Gold Council)
- [T5] Why gold isn’t acting like a safe haven right now (ING THINK)
- [T6] Gold Advances Above $4,125 as US Election Outcome Sends Dollar and Bond Yields Lower (Yahoo Finance UK)
- [T7] Gold and silver surge as Democratic midterm sweep drives dollar, yields lower (Kitco News, November 2026)
- [T8] How can we account for the increase in the price of gold? (Banque de France)
Disclaimer
This report is AI-generated and provided for informational purposes only. It does not constitute investment advice, a recommendation, or an offer to buy or sell any financial instrument. Past performance is not indicative of future results. Readers should conduct their own research and consult a licensed financial advisor before making investment decisions.
Important Note / Wichtiger Hinweis:
EN: This report may have been generated using AI. It processes data from publicly available sources. The content is provided for informational purposes only.DE: Dieser Bericht kann mithilfe von KI erstellt worden sein. Dabei werden Daten aus öffentlich zugänglichen Quellen verarbeitet. Die Inhalte dienen ausschließlich Informationszwecken.
* DE: Die ergänzenden Inhalte können KI-generiert sein. EN: The additional content may be AI-generated.