
The altii-Gold-Report: Gold (XAU) in EUR
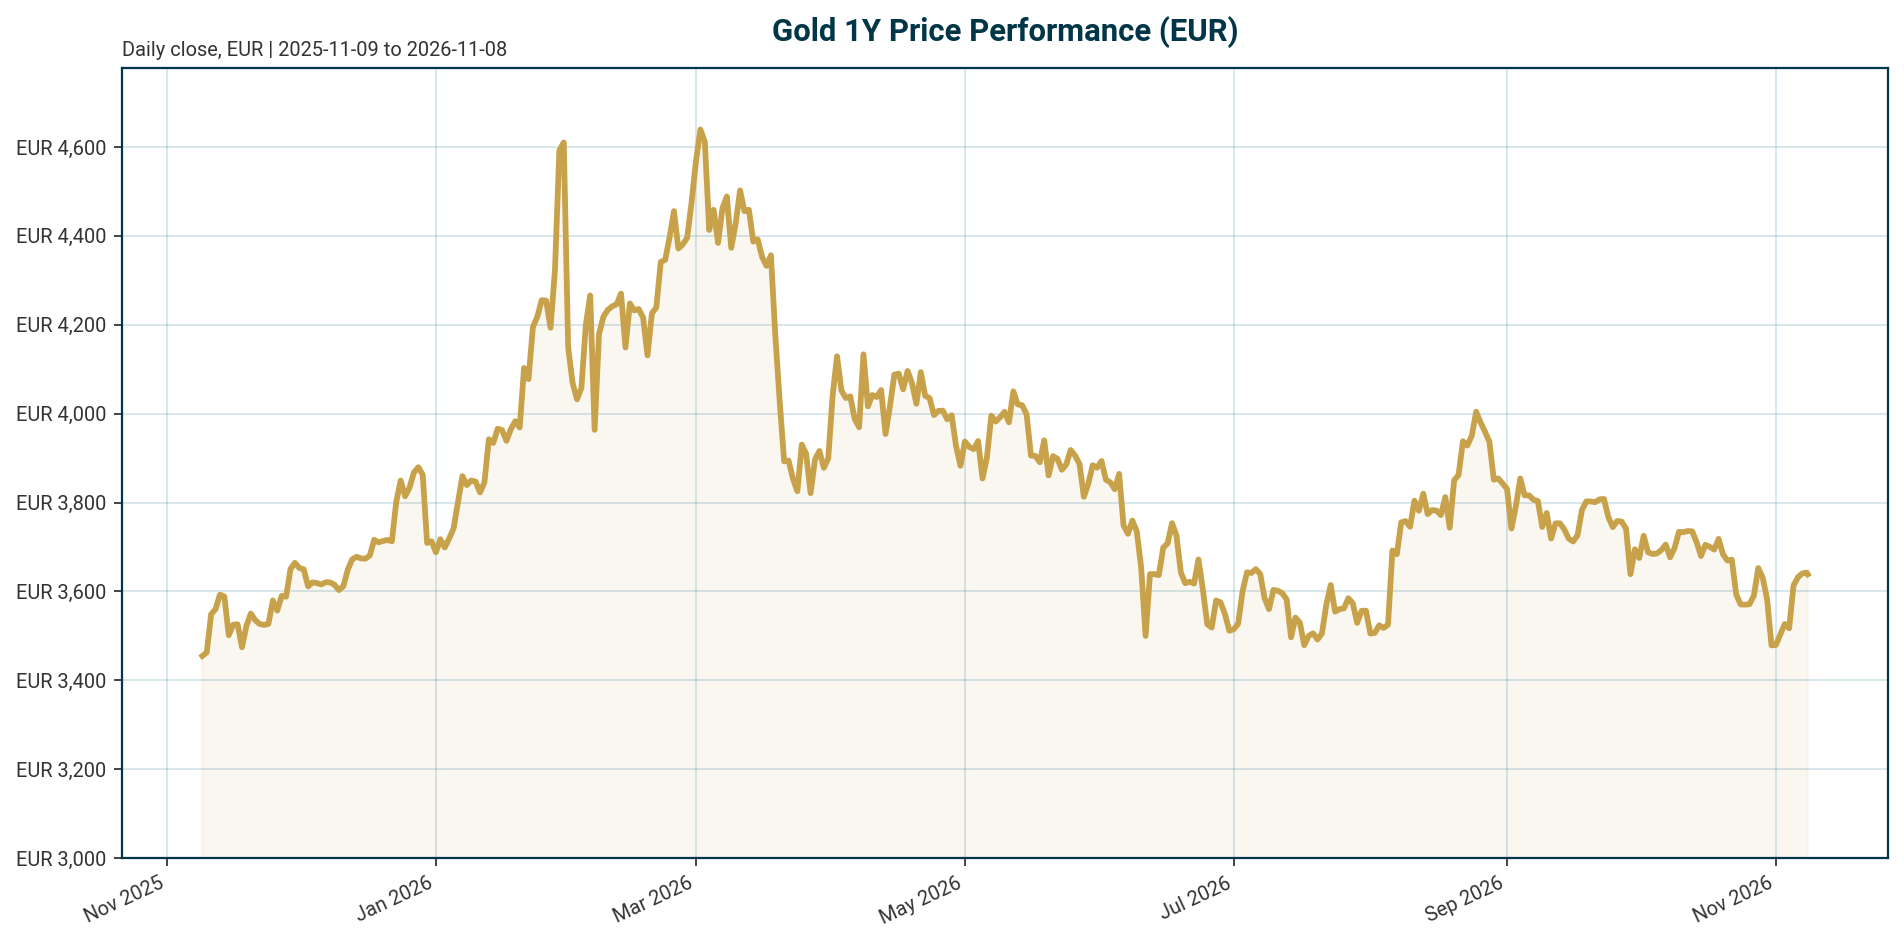
Report date: 8 November 2026 | Price: EUR 3,638.42 | Profile: gold_macro
Watch the video
This player shows only the Gold chapter of the daily altii market briefing. Watch the full video on tube.altii.de.
Key Data Snapshot
| Metric | Value | Reference |
|---|---|---|
| XAU price (EUR) | EUR 3,638.42 | as of 2026-11-08 |
| 24h / 7d / 14d change | -0.21% / +4.02% / +1.35% | market data |
| 30d / 200d / 1y change | -2.90% / -14.56% / +1.52% | market data |
| All-time high (EUR) | EUR 4,688.32 (2026-01-28); currently -22.39% | market data |
| All-time low (EUR) | EUR 1,265.28 (2019-11-17); currently +187.56% | market data |
| Fed funds target range | 3.75% to 4.00%; last change hike of 25 bp effective 2026-09-17 | as of 2026-11-07 |
| ECB deposit facility rate | 2.50%; last change hike of 25 bp effective 2026-09-16 | as of 2026-11-08 |
| US 10Y TIPS yield / nominal 10Y | 2.64% / 4.9% | as of 2026-11-04 [T3] |
| Euro Area AAA 10Y yield | 3.29% (-7.1 bp 5d, -22.5 bp 1m, +34.6 bp YTD) | as of 2026-11-05 |
| EUR/USD | 1.1214 (-4.56% YTD) | as of 2026-11-08 |
| Gold ETF holdings | Record 4,256 tonnes | [T3], [T8] |
| Circulating supply (PAX Gold proxy) | 447,723.21 oz; market cap ~EUR 1.63 billion | market data |
Recovery math: reclaiming the January 2026 peak requires a move of +29.5% from the current EUR 3,638.42 (4,688.32 / 3,638.42 – 1).
Macro Backdrop
Market overview: Risk sentiment is negative and equity momentum is broadly negative, with the Nikkei 225 the weakest 5-day performer at -9.25% and the S&P 500 down 5.45% over one month. DACH indicators are outperforming, averaging -0.27% over 5 days versus -2.28% for global equity indicators, and the DAX leads on a 1-month basis at +2.85%. The rates backdrop is mixed: the Euro Area AAA 10Y yield sits at 3.29%, down 7.1 bp over 5 days, with a 10Y-2Y spread of 33.5 bp. The FX backdrop is likewise mixed, with EUR/USD at 1.1214, down 0.11% over 5 days. For gold, this combination of defensive equity flows and easing euro yields is supportive, but the stronger EUR versus USD year-to-date is a mechanical headwind for the EUR-quoted price.
Policy is restrictive on both sides of the Atlantic. The Federal Reserve’s target range stands at 3.75% to 4.00% following a 25 bp hike effective 2026-09-17, and the ECB deposit facility rate is 2.50% following a 25 bp hike effective 2026-09-16. US real yields remain generous: the 10-year TIPS yield stood at 2.64% and the nominal 10-year at 4.9% on November 4, according to [T3]. Strong October US payrolls of 165,000, reported by [T6] from November 2026, reinforced the case for keeping policy restrictive, raising the opportunity cost of holding non-yielding gold.
The transmission into the EUR-quoted price is two-sided. Elevated real yields argue for lower gold, yet gold has decoupled from that framework as official-sector and ETF demand has surged. Meanwhile, the euro’s 4.56% YTD appreciation against the dollar means EUR-gold has materially underperformed USD-gold this year; the 200-day return of -14.56% partly reflects currency translation rather than dollar-price weakness alone.
Investment Thesis
The core thesis is that gold’s traditional valuation anchor, the inverse real-yield relationship, has weakened because the marginal buyer has changed. Central banks bought more gold than the world’s jewelry buyers, according to [T3] from November 2026, and they buy to diversify reserves away from the dollar and to hold an asset no foreign government can block. A record 43% of 73 surveyed monetary authorities expect their own gold reserves to increase over the next year, according to [T1], date not stated. Reuters commentary [T2] attributes this to worries over inflation, deteriorating US fiscal health, Federal Reserve independence, and geopolitical instability.
Private capital has joined the bid. Gold-backed ETFs added 211.2 tonnes after second-quarter outflows, lifting global holdings to a record 4,256 tonnes, with the World Gold Council tying inflows to fiscal-sustainability and inflation concerns [T3]. ETF holdings rose roughly 187 tonnes during August and September 2026 alone, with record third-quarter inflows of $31 billion, according to [T8] from November 2026.
The tension is explicit: with a 2.64% 10-year TIPS yield, textbook logic says gold should be struggling. It is not, because the price-insensitive bid now weighs sanctions risk and government debt loads over Treasury yields [T3]. The bearish counter is equally clear: if fiscal and inflation fears fade while real yields stay near 2.64%, the structural bid could slow, exposing gold to further mean reversion from the January peak. On balance, the structural demand case outweighs the cyclical yield headwind for strategic allocators, but timing risk is elevated.
Bullish Drivers
- Official-sector demand: Central banks continue to accumulate for reserve diversification and sanctions protection, with high prices rarely discouraging them [T3]. China’s central bank has run extended buying streaks, adding 8.1 tonnes in a single month at one point and lifting holdings to around 2,305 tonnes, according to [T5], date not stated, so treat as context rather than current state.
- ETF momentum: Record holdings of 4,256 tonnes and record Q3 inflows of $31 billion [T3], [T8] show private demand re-accelerating after mid-year outflows.
- Constrained supply: Mine output rose 3% to a third-quarter record of 1,071 tonnes, yet total supply slipped about 1% as recycling weakened and producers reduced hedging [T3]. Demand growth cannot be met elastically.
- Policy optionality: Gold does not need Fed cuts to regain momentum; removing the threat of additional hikes, a weaker dollar, and declining real yields could suffice, according to [T6] from November 2026.
- Slowdown scenario: The World Gold Council’s slowdown path, in which the Fed cuts beyond consensus amid a weaker dollar and heightened risk aversion, could lift gold 5% to 15% in 2026 from current levels [T4]. This is a scenario assumption, not a forecast.
Relative Positioning vs Bitcoin and Ethereum
The bundle provides limited crypto reference data. Bitcoin dominance stands at 59.33% and total crypto market capitalization at roughly $2.30 trillion with 24-hour volume of about $26.7 billion. No Bitcoin or Ethereum price data is present in the dataset, so a quantitative return comparison is unavailable; ethereum is a designated benchmark for this report but the comparison must remain qualitative.
Positioning logic still holds. In the current negative risk-sentiment regime, gold’s demand profile is defensive and reserve-grade, while crypto assets are typically high-beta and would likely underperform if the equity drawdown deepens. Gold’s 1-year EUR return of +1.52% understates its portfolio role: it is the asset central banks are actively accumulating at record pace [T1], [T3], a bid crypto does not have. In a risk-on reversal with Fed easing, crypto could outperform gold on beta, narrowing gold’s relative appeal for return-seeking allocators. For EUR-based institutional portfolios seeking tail protection against fiscal and sanctions risk, gold remains the more defensible allocation; for upside capture, crypto benchmarks retain the higher expected volatility and, potentially, higher return.
Scenario Framework
| Scenario | Key assumptions | Implication for EUR gold |
|---|---|---|
| Base | Policy stays restrictive near current levels (Fed 3.75% to 4.00%, ECB 2.50%); real yields hold around 2.6%; WGC consensus inputs of 2.7% to 2.8% global growth and broadly flat yields [T4] | Consolidation between recent range lows and the ATH region; rangebound in WGC’s valuation framework [T4] |
| Bullish | Growth slowdown forces Fed cuts beyond consensus; weaker dollar; heightened risk aversion (WGC slowdown scenario [T4]) | +5% to +15% in 2026 from current levels, implying roughly EUR 3,820 to EUR 4,184 (3,638.42 x 1.05 to 1.15); WGC-sourced scenario, not a forecast |
| Bearish | Strong labor data and sticky inflation keep the hike threat alive; 10Y TIPS yields rise further from 2.64% [T3], [T6] | Retest or break of recent support; the 200-day drawdown of -14.56% extends |
Note: the WGC consensus path of around 75 bp of additional Fed cuts [T4] conflicts directionally with the September 2026 hike in the policy block. Present it as a dated market-expectation scenario from the WGC outlook, not as the current stance.
Valuation Discussion
Gold in EUR terms is in a corrective phase within a structurally elevated market: 22.39% below its January 2026 peak of EUR 4,688.32 but 187.56% above its 2019 low of EUR 1,265.28. The WGC Gold Valuation Framework shows rangebound performance when fed macro-consensus inputs, meaning the current price largely reflects consensus on growth, inflation, and policy [T4].
The conventional valuation model is unreliable. The historical inverse relationship between gold and real yields has broken down over the past two years; gold was resilient in 2022 and posted a +13% return in 2023 despite real yields at post-2008 highs, according to [T1], date not stated. The marginal buyer now prices sanctions risk and government debt loads rather than Treasury yields, which weakens the old interest-rate link [T3]. Two valuation regimes follow: if the real-yield model re-asserts as yields fall, conventional frameworks would justify a re-rating toward prior highs; if the official-sector bid is the true marginal pricing force, real-yield screens systematically underestimate fair value.
Technical references from [T6] from November 2026 cite $4,000 support and a $4,170 breakout level. These are USD-quoted and not directly comparable to the EUR 3,638.42 bundle price; they indicate dollar-market structure only. A translation sensitivity: holding USD-gold constant, a 1% appreciation of EUR/USD mechanically reduces the EUR-quoted price by roughly 1%, so currency must be separated from the underlying metal when assessing value.
Risks
- Hawkish policy continuation: Both the Fed (hike effective 2026-09-17) and the ECB (hike effective 2026-09-16) tightened recently. A further hike from either is a live risk, not a tail, and would lift real yields and likely extend the drawdown.
- Elevated real yields and strong dollar: The 165,000 October payrolls print supports the dollar and Treasury yields, raising the opportunity cost of non-yielding gold [T6]. A USD rebound against the EUR would pressure EUR-quoted gold even if USD-gold holds steady.
- Safe-haven fragility in supply shocks: Gold underperforms during supply-driven energy shocks, which push inflation up, keep central banks on hold, and strengthen the dollar; gold is also sold as a liquidity source to cover losses elsewhere, according to [T5], date not stated, so treat as context.
- Transitory inflation hedge: Gold’s inflation-hedge property is often transitory [T1], limiting its reliability as a standalone inflation instrument.
- Euro-rate headwind: Euro Area AAA 2Y yields are up 85.0 bp YTD, a headwind specific to the EUR-quoted price even as short-dated yields have eased recently.
- Flow reversal: If fiscal and inflation fears fade, the ETF bid that added 211.2 tonnes [T3] could reverse as quickly as it returned, as the Q2 outflows showed.
Appendix
Methodology and Data Caveats
- Prices, returns, supply, and market-cap figures come from the bundle’s market data retrieved 2026-11-08. The market cap of roughly EUR 1.63 billion reflects the tokenized PAX Gold proxy (market cap rank 50), not the full gold market.
- Policy rates are taken exclusively from the bundle’s policy_rates block: Fed funds target range 3.75% to 4.00% as of 2026-11-07 (hike of 25 bp effective 2026-09-17); ECB deposit facility rate 2.50% as of 2026-11-08 (hike of 25 bp effective 2026-09-16).
- US real-yield figures (10Y TIPS 2.64%, nominal 10Y 4.9%) are dated November 4, 2026, per [T3]. The Kitco commentary [T6] is dated November 6, 2026. Sources [T1], [T2], [T4], [T5], and [T7] lack publication dates and are labeled accordingly where used.
- [T5] references April Fed inaction and Powell’s tenure ending, which conflict with the current policy block; it is used only as historical context, never as current state. [T1]’s $2,068 record is 2023 history, not a current reference.
- No euro-area real yield (HICP-linked) or euro-area inflation expectation data is in the dataset; EUR real-yield analysis is therefore omitted. No Bitcoin or Ethereum price data is in the dataset; the relative-positioning section is qualitative.
- Scenario price targets apply the WGC’s +5% to +15% range [T4] to the current EUR price; they are scenario assumptions, not forecasts.
Sources
- [T1] Is it a golden era for gold? | J.P. Morgan Private Bank U.S. (publication date not stated)
- [T2] COMMENTARY: Gold’s rise in central bank reserves appears unstoppable, Reuters (publication date not stated)
- [T3] Central Banks Just Bought More Gold Than the World’s Jewelry Buyers, 24/7 Wall St., November 2026
- [T4] Gold Outlook 2026: Push ahead or pull back, World Gold Council (publication date not stated)
- [T5] Why gold isn’t acting like a safe haven right now, ING THINK (publication date not stated; used as context only)
- [T6] Gold price holds critical $4,000 support, Kitco News, November 2026
- [T7] Historical Approaches to Monetary Policy, Federal Reserve Board (background reference)
- [T8] Gold price forecast, Rediff.com Business, November 2026
This report is AI-generated, is provided for informational purposes only, and does not constitute investment advice. Figures should be verified against primary sources before any investment decision.
Important Note / Wichtiger Hinweis:
EN: This report may have been generated using AI. It processes data from publicly available sources. The content is provided for informational purposes only.DE: Dieser Bericht kann mithilfe von KI erstellt worden sein. Dabei werden Daten aus öffentlich zugänglichen Quellen verarbeitet. Die Inhalte dienen ausschließlich Informationszwecken.
* DE: Die ergänzenden Inhalte können KI-generiert sein. EN: The additional content may be AI-generated.