
Watch the video
This player shows only the Gold chapter of the daily altii market briefing. Watch the full video on tube.altii.de.
Key Data Snapshot
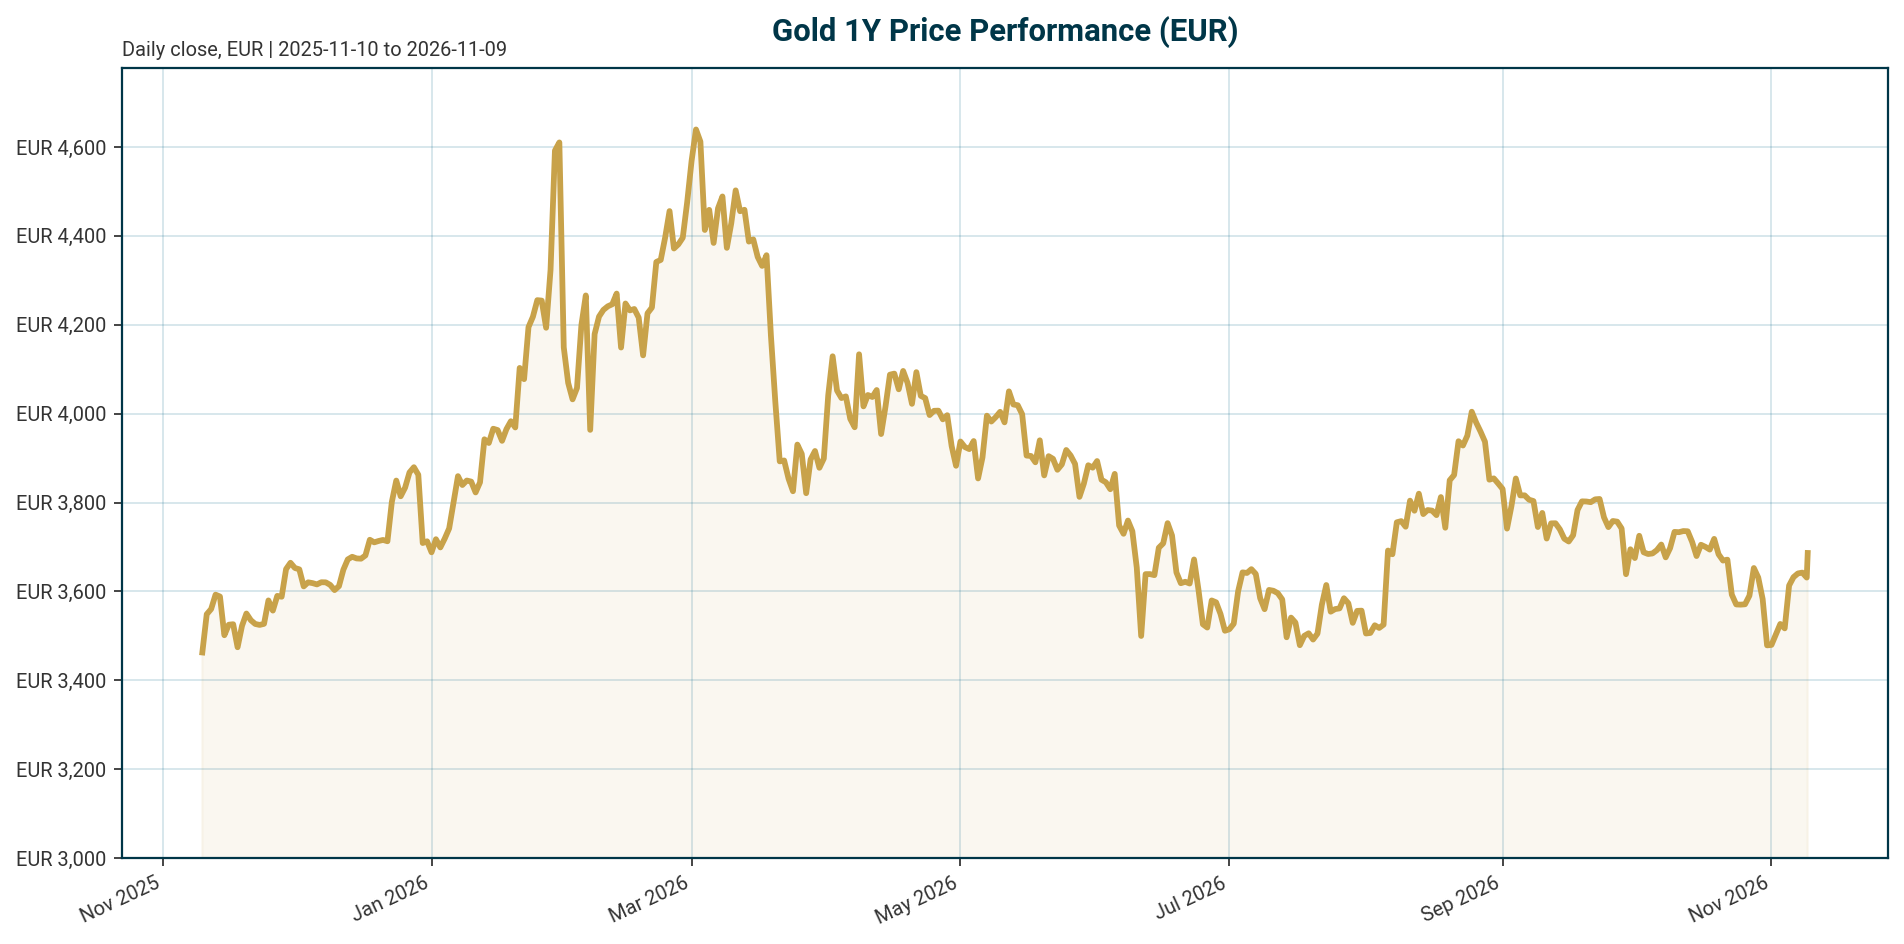
Gold (XAU), quoted in EUR, trades at 3,683.40 as of 2026-11-09 (retrieved 05:21 UTC). The metal is in a short-term recovery within a medium-term correction: the 7-day gain of +5.10% contrasts with a 30-day decline of -1.77% and a 200-day drawdown of -12.38%. The momentum spread between the 7-day and 30-day windows is +6.87 percentage points, which characterises a genuine rebound inside a larger pullback.
| Metric | Value | Note |
|---|---|---|
| XAU/EUR price | 3,683.40 | 24h range 3,612.50 to 3,690.08 |
| 24h / 7d / 14d change | +1.23% / +5.10% / +2.35% | Short-term recovery |
| 30d / 200d / 1y change | -1.77% / -12.38% / +3.09% | Correction within a longer uptrend |
| All-time high | 4,688.32 (2026-01-28) | Current price is -21.43% below |
| All-time low | 1,265.28 (2019-11-17) | Current price is +191.11% above |
| 24h volume | 65.64m EUR | Market cap 1.65bn EUR (tokenised proxy) |
| Fed funds target range | 3.75% to 4.00% | As of 2026-11-08; last change hike of 25 bp, effective 2026-09-17 |
| ECB deposit facility rate | 2.50% | As of 2026-11-09; last change hike of 25 bp, effective 2026-09-16 |
| US 10Y TIPS yield | 2.64% | Nominal 10Y at 4.9%, as of 2026-11-04 per [T4] |
| Euro area AAA 10Y yield | 3.29% | -7.1 bp over 5 days, as of 2026-11-05 |
| Euro area AAA 2Y / 10Y-2Y spread | 2.96% / 33.5 bp | Curve slope; gold pays zero carry against both |
| EUR/USD | 1.1198 | -0.45% over 5 days, -4.70% YTD |
Macro Backdrop
The macro regime is restrictive on both sides of the Atlantic. The Federal Reserve’s target range stands at 3.75% to 4.00% after a 25 bp hike effective 2026-09-17, and the ECB deposit facility rate stands at 2.50% after a 25 bp hike effective 2026-09-16. Real yields remain generous: the 10-year TIPS yield stood at 2.64% on 2026-11-04 with the nominal 10-year at 4.9%, implying around 2.26 percentage points of inflation expectations (4.9% minus 2.64%) per [T4]. Strong October US payrolls of 165,000, significantly above expectations, reinforced the Fed’s capacity to keep policy restrictive, according to [T8] from November 2026.
Risk sentiment is neutral to negative and equity momentum is broadly negative. The Nikkei 225 is the weakest 5-day performer at -6.26%, the S&P 500 fell 2.18% and the Nasdaq Composite 2.32% over 5 days, while the Hang Seng gained 4.14%. DACH indicators outperformed, averaging -0.27% over 5 days versus -1.66% for global equity indicators, a spread of +1.39 percentage points. The DAX leads on a 1-month basis at +2.85%.
Rates and FX backdrops are mixed. Euro area AAA 10Y yields fell 7.1 bp over 5 days and 22.5 bp over 1 month to 3.29%, with the 2Y at 2.96% and the 10Y-2Y spread at 33.5 bp. EUR/USD slipped 0.45% over 5 days to 1.1198 and is down 4.70% YTD, a modest tailwind for EUR-quoted gold. On inflation, the RBA’s August 2026 Statement on Monetary Policy expects headline inflation in many economies to remain above central bank targets into 2027, with risks skewed to the upside from Middle East conflict fuel costs [T2]. The Euro Area AAA 5Y yield is unavailable in this dataset due to a retrieval failure and is not estimated.
Investment Thesis
The core thesis is that gold is consolidating below its January 2026 all-time high in a restrictive-rate environment, while the traditional valuation anchor has partially broken down. Textbook logic says a 2.64% 10-year real yield should pressure a non-yielding asset. Yet central banks bought more gold than the world’s jewellery buyers in Q3, and gold-backed ETFs added 211.2 metric tons after second-quarter outflows, lifting global holdings to a record 4,256 tons, according to [T4] dated 2026-11-05. The marginal buyer now weighs sanctions risk and government debt loads rather than Treasury yields, which weakens gold’s old link to interest rates [T4].
Structural demand is broad. A record 43% of 73 surveyed monetary authorities expect their gold reserves to increase over the next year [T1]. Reserve diversification away from the dollar, concerns over US fiscal health and Fed independence, and geopolitical instability all underpin official buying [T3]. Supply cannot easily answer this demand: mine output rose 3% to a third-quarter record of 1,071 tons, yet total supply slipped about 1% as recycling weakened and producers reduced hedging [T4].
On the bearish side, the near-term price action is dominated by Fed policy. Stronger-than-expected employment data has reinforced expectations of a tightening bias, and higher rates raise the opportunity cost of holding gold, per [T7] dated 2026-11-06. At 3,683.40 EUR, 21.43% below the ATH, gold offers a better entry than at the peak, but the medium-term bullish case requires either a Fed pivot or simply the removal of further hike risk, which analysts argue could be enough if the dollar weakens and real yields decline [T8].
Bullish Drivers
- Price-insensitive official demand. Central banks buy for reserve diversification away from the dollar and sanctions immunity, so high prices rarely discourage them. Countries facing elevated geopolitical risks, including those near the Russia-Ukraine border, are increasing reserves [T1]. Worries over inflation, deteriorating US fiscal health, Fed independence, and geopolitical instability reinforce this [T3].
- ETF inflows at record holdings. Gold-backed ETFs added 211.2 metric tons after Q2 outflows, raising global holdings to a record 4,256 tons, tied by the World Gold Council to fiscal sustainability and inflation concerns [T4].
- Supply constraints. Despite record mine output of 1,071 tons in Q3, total supply slipped about 1% on weaker recycling and reduced producer hedging [T4].
- Portfolio diversification demand. Investment demand surged across all regions amid lacklustre bond returns and concerns of frothiness in equity markets [T5]. Current neutral-to-negative risk sentiment fits this pattern.
- EUR-specific tailwinds. Euro area AAA 10Y yields fell 22.5 bp over 1 month to 3.29%, lowering the EUR-quoted opportunity cost, and EUR/USD is down 4.70% YTD at 1.1198, mechanically supporting XAU/EUR through currency translation.
- Scenario upside. In the World Gold Council’s slowdown scenario, a Fed cutting beyond current expectations, combined with a weaker dollar and heightened risk aversion, could lift gold 5% to 15% in 2026 from then-current levels. This is a dated analytical scenario from [T5], not a forecast of Fed decisions.
Relative Positioning vs Bitcoin and Ethereum
No Bitcoin or Ethereum price series is provided in this dataset, so the comparison is qualitative on crypto performance. The aggregate context: total crypto market cap stands at 2.23 trillion EUR with 24h volume of 50.23bn EUR, and Bitcoin dominance is 60.14%. Gold’s 1-year EUR return of +3.09% sits within a 200-day drawdown of -12.38%, a correction within an uptrend rather than a trend break.
Gold’s role differs fundamentally from crypto benchmarks. It is a zero-yield, non-sovereign reserve asset with an official-sector bid that has no crypto analogue; central banks buy gold to hedge sanctions risk and dollar concentration, not Bitcoin. In the current neutral-to-negative risk-sentiment regime with broadly negative equity momentum, gold’s defensive profile tends to be favoured over higher-beta digital assets. In a risk-on reversal, relative flows could rotate back toward crypto, and gold’s correlation regime would likely shift. Equity froth concerns have been an explicit driver of diversification demand into gold [T5], so the cross-asset competition is real but currently favours gold.
Scenario Framework
Bullish scenario (growth slowdown, Fed easing). A softer US labour market prompts the Fed to cut beyond current expectations. Lower rates, a weaker dollar, and heightened risk aversion create a supportive environment; the World Gold Council scenario implies gold could rise 5% to 15% in 2026 from then-current levels [T5]. This is a scenario assumption, not a decision or a current market expectation.
Base scenario (restrictive hold). The Fed holds the 3.75% to 4.00% range with a restrictive bias amid sticky inflation, consistent with the October payrolls beat of 165,000 per [T8] dated November 2026. Analysts note another hike is not certain, and removing the threat of additional hikes could itself revive bullish momentum if the dollar weakens and real yields decline [T8]. Gold consolidates in EUR terms, supported by official-sector and ETF demand but capped by 2.64% 10-year real yields as of 2026-11-04 [T4]. In USD-quoted spot, $4,000/oz is cited as critical support and $4,170/oz as the key breakout level, per [T7] and [T8] dated 2026-11-06.
Bearish scenario (energy-shock inflation). A supply-driven energy shock pushes inflation up, keeps central banks on hold or tightening, and strengthens the dollar. Gold sold off in exactly this pattern in 2022 after Russia invaded Ukraine, and the same dynamic played out faster in the current conflict episode [T6]. The RBA flags inflation risks as skewed to the upside from conflict-related fuel costs [T2]. In this path, the 2022-style safe-haven failure repeats and the 200-day drawdown deepens.
Valuation Discussion
XAU/EUR at 3,683.40 is 21.43% below the 2026-01-28 ATH of 4,688.32 and +191.11% above the 2019 ATL of 1,265.28. After 2025 delivered gold’s fourth strongest annual return since 1971 [T5], the current correction is best read as a partial retracement of an exceptional move rather than a valuation reset.
On traditional metrics, gold looks rich. The World Gold Council’s Gold Valuation Framework shows rangebound performance under market-consensus macro inputs of stable 2.7% to 2.8% global growth, around 75 bp of additional expected Fed cuts, and a slightly higher dollar, meaning consensus implies limited upside, though the WGC notes the macroeconomy rarely follows consensus [T5]. With the 10-year TIPS yield at 2.64% as of 2026-11-04 [T4], textbook fair-value logic would flag gold as expensive. The counterargument is that the real-yield anchor has been displaced: the historical inverse relationship with real yields has broken down over the past two years [T1], because price-insensitive official buyers now set the marginal price [T4].
Currency matters for EUR investors. EUR/USD at 1.1198 is down 4.70% YTD, so EUR-quoted gold has benefited from translation. For illustration only, at the single snapshot rate of 1.1198, the USD-quoted technical levels of $4,000 and $4,170 per [T7]/[T8] correspond to roughly 3,572 and 3,724 EUR respectively; this is an approximation and the two quote currencies should not be directly reconciled. Verdict: fair to rich on old anchors, arguably fair if the official-sector demand regime persists, and rich if it normalises.
Risks
- Renewed Fed tightening. Stronger-than-expected US employment data has reinforced expectations that the Fed will maintain its tightening bias against persistent inflation, and higher rates with elevated bond yields raise gold’s opportunity cost, per [T7] dated 2026-11-06. The October payrolls beat of 165,000 could support the dollar and push Treasury yields higher [T8]. If inflation re-acceleration prompted another hike from the 3.75% to 4.00% range, real yields would rise further. This is a labelled tail-risk scenario, not an expected decision.
- Sticky inflation and energy shocks. Supply-driven energy shocks push inflation up, keep central banks on hold, and strengthen the dollar, the exact pattern in which gold failed as a safe haven in 2022 and in the current conflict episode [T6]. The RBA sees inflation risks skewed to the upside into 2027 [T2].
- Flow reversal. ETF inflows can reverse as they did in Q2 before the 211.2-tonne rebound [T4]. A de-escalation of geopolitical risk could slow official-sector purchases, removing the price-insensitive demand floor. Gold’s inflation-hedge property is often transitory [T1].
- Technical breakdown. A sustained break below $4,000/oz in USD-quoted spot is a flagged risk, with $4,170/oz the key level for restoring bullish dynamics, per [T7] and [T8] dated 2026-11-06. Volatility is likely to remain elevated until there is clarity on inflation and Fed policy [T8].
- Institutional uncertainty. Questions around Federal Reserve independence add a layer of uncertainty that cuts both ways: it supports safe-haven demand but also keeps rates elevated [T3] [T6].
Appendix
Methodology and data provenance. The bundle price of 3,683.40 is XAU quoted in EUR, retrieved 2026-11-09T05:21:26Z via a tokenised gold proxy (PAXG). Kitco references to $4,000, $4,145, and $4,170 are USD-quoted spot per ounce from articles dated 2026-11-06; the two quote currencies are not directly comparable and are kept separate throughout. Policy rates are sourced exclusively from the authoritative Policy Rates block: Fed funds target 3.75% to 4.00% as of 2026-11-08, last change a 25 bp hike effective 2026-09-17; ECB deposit facility rate 2.50% as of 2026-11-09, last change a 25 bp hike effective 2026-09-16. Euro area yield curve data is as of 2026-11-05 from the ECB yield curve source; the Euro Area AAA 5Y yield failed to retrieve (HTTP 504) and is omitted without estimation. Market overview data is as of 2026-11-06 to 2026-11-09 depending on the series.
Source dating caveats. T6 (ING THINK) is undated in the source list and contains internal month references that conflict with the November 2026 timeline; it is used here only for structural arguments on central bank demand and safe-haven mechanics, never for current-state claims. T5 (World Gold Council Outlook 2026) scenario ranges and consensus inputs, including around 75 bp of expected Fed cuts, are forward-looking analytical scenarios and market expectations, not decisions, and may predate the September 2026 hikes. Central bank tonnage figures come from secondary press summaries and are attributed with per-phrasing.
Calculations shown. Drawdown from ATH: 3,683.40 / 4,688.32 – 1 = -21.43%. Momentum spread: +5.10% (7d) minus -1.77% (30d) = +6.87 pp. Implied inflation expectations: 4.9% nominal minus 2.64% TIPS = 2.26 pp as of 2026-11-04 [T4]. DACH equity outperformance: -0.27% minus -1.66% = +1.39 pp over 5 days. USD-to-EUR technical conversion: $4,000 / 1.1198 = ~3,572 EUR; $4,170 / 1.1198 = ~3,724 EUR, illustration only.
Sources
- [T1] Is it a golden era for gold? | J.P. Morgan Private Bank U.S.
- [T2] Outlook | Statement on Monetary Policy, August 2026 | RBA
- [T3] COMMENTARY: Gold’s rise in central bank reserves appears unstoppable | Reuters
- [T4] Central Banks Just Bought More Gold Than the World’s Jewelry Buyers | 24/7 Wall St. (2026-11-05)
- [T5] Gold Outlook 2026: Push ahead or pull back | World Gold Council
- [T6] Why gold isn’t acting like a safe haven right now | ING THINK
- [T7] Democrats’ midterm sweep gives gold a boost, but the Federal Reserve still holds the cards | Kitco News (2026-11-06)
- [T8] Gold price holds critical $4,000 support | Kitco News (2026-11-06)
Disclaimer. This report is AI-generated, for informational purposes only, and does not constitute investment advice. Figures are drawn from the cited dataset and sources as of their stated dates and may change without notice. Readers should conduct their own research and consult a licensed advisor before making investment decisions.
Important Note / Wichtiger Hinweis:
EN: This report may have been generated using AI. It processes data from publicly available sources. The content is provided for informational purposes only.DE: Dieser Bericht kann mithilfe von KI erstellt worden sein. Dabei werden Daten aus öffentlich zugänglichen Quellen verarbeitet. Die Inhalte dienen ausschließlich Informationszwecken.
* DE: Die ergänzenden Inhalte können KI-generiert sein. EN: The additional content may be AI-generated.