
The altii-Gold-Report: Gold (XAU) in EUR
Publication date: 10 November 2026. Data as of 10 November 2026, 05:20 UTC unless stated otherwise.
Watch the video
This player shows only the Gold chapter of the daily altii market briefing. Watch the full video on tube.altii.de.
Key Data Snapshot
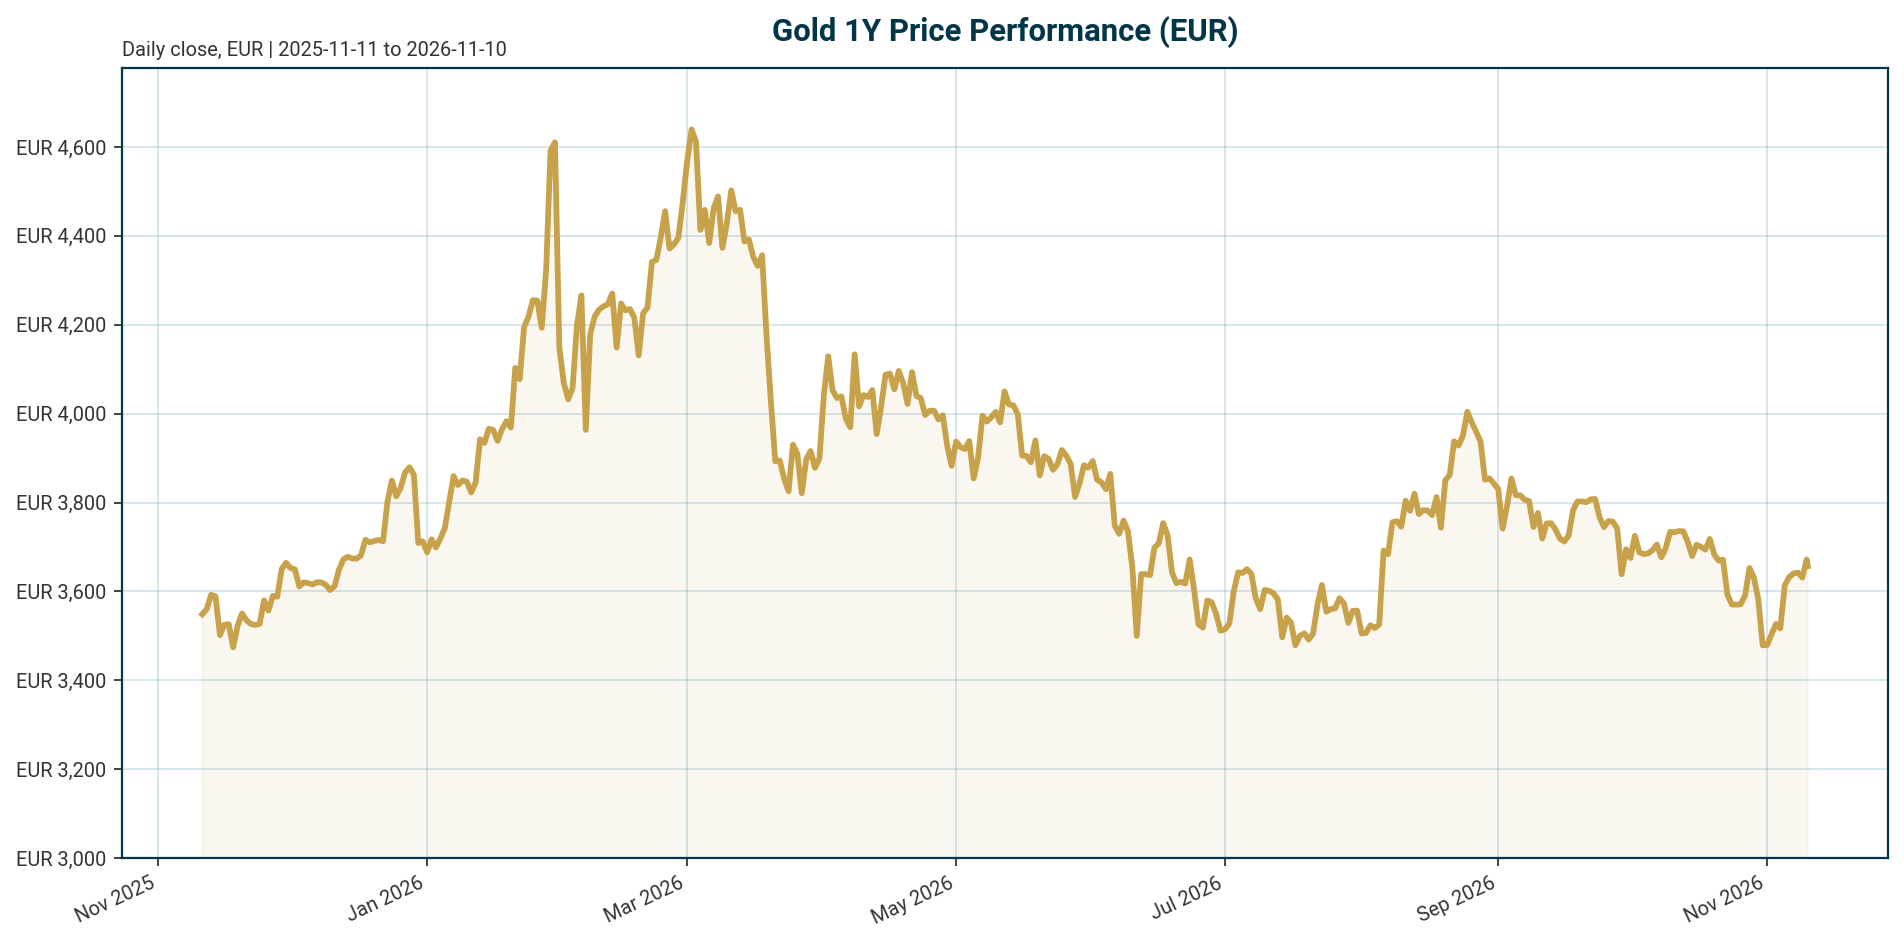
| Metric | Value | Note |
|---|---|---|
| XAU/EUR price | EUR 3,654.12 | Retrieved 2026-11-10 05:20 UTC |
| 24h change | -0.80% | 24h range EUR 3,628.06 to 3,678.22 |
| 7d change | +4.47% | Recovery attempt |
| 30d change | -1.97% | Consolidation |
| 200d change | -12.05% | Longer correction intact |
| 1y change | +1.37% | Flat over 12 months |
| All-time high (EUR) | EUR 4,688.32 (2026-01-28) | Current price 22.06% below; +28.3% upside to retest |
| All-time low (EUR) | EUR 1,265.28 (2019-11-17) | +188.80% above |
| Fed funds target | 3.75% to 4.00% | As of 2026-11-09; last change hike 25 bp effective 2026-09-17 |
| ECB deposit facility rate | 2.50% | As of 2026-11-10; last change hike 25 bp effective 2026-09-16 |
| US 5Y / 10Y real yield | 2.35% / 2.63% | As of 6 Nov 2026, per TIPS data [T3] |
| Euro area AAA 10Y yield | 3.29% | -4.1 bp over 5 days, as of 2026-11-06 |
| EUR/USD | 1.1189 | -0.21% over 5 days; -4.77% YTD |
| Tokenized market cap / 24h volume | EUR 1.64bn / EUR 84.4m | PAX Gold listing, rank 48; not the full gold market |
Calculation check: distance from ATH = 3,654.12 / 4,688.32 – 1 = -22.06%. Upside to ATH = 4,688.32 / 3,654.12 – 1 = +28.3%.
Macro Backdrop
Market overview: Risk sentiment is neutral while equity momentum is moderately negative, with DACH indices outperforming global peers: DACH indicators average +2.08% over five days versus -0.32% for global equity indicators. The ATX leads five-day moves at +2.60%, the DAX leads one-month performance at +4.70%, and the Nikkei 225 is the weakest at -3.10% over five days. The rates backdrop is mixed in the euro area: the AAA 10Y yield sits at 3.29% after a -4.1 bp five-day move, the AAA 2Y is at 2.93%, and the 10Y-2Y spread stands at 35.5 bp. FX is similarly mixed, with EUR/USD at 1.1189 (-0.21% over five days) and EUR/CHF showing the strongest five-day move at +0.03%. For a EUR-based gold investor, the 3.29% euro AAA 10Y yield is the local opportunity cost of holding a non-yielding asset.
Policy is restrictive on both sides of the Atlantic. The Fed funds target range is 3.75% to 4.00% after a 25 bp hike effective 17 September 2026, and the ECB deposit facility rate is 2.50% after a 25 bp hike effective 16 September 2026. US real yields remain elevated: the 5Y TIPS yield stood at 2.35% and the 10Y at 2.63% on 6 November [T3], while on 4 November the 10-year TIPS yield was 2.64% against a nominal 10Y of 4.9% [T4]. The near-term catalysts are today’s US CPI release and Friday’s PPI, ahead of the FOMC meeting on 8-9 December. According to a Reuters report from 10 November 2026, Fed funds futures price an 84% probability of a further hike at the December meeting per CME FedWatch, and Richmond Fed President Barkin said policy should move “with care” with inflation the Fed’s “greatest risk” [T6]. Consensus expects October headline CPI of +0.3% m/m and core of +0.2% m/m; the BLS will not publish annual inflation readings due to data disruption from last year’s government shutdown [T8].
Investment Thesis
The core tension in gold today is between a textbook bearish macro setup and a structural demand story that has broken the old playbook. Elevated real yields (10Y at 2.63% on 6 November [T3]) should, by conventional logic, cap a non-yielding asset. Yet gold has resisted because the marginal buyer has changed. Central banks bought more gold than the world’s jewelry buyers in the most recent accounting, and gold-backed ETFs added 211.2 metric tonnes after second-quarter outflows, lifting global holdings to a record 4,256 tonnes [T4]. A record 43% of 73 surveyed monetary authorities expect their own gold reserves to rise over the next year, driven by sanctions risk and diversification away from the dollar [T1]. These buyers weigh government debt loads and geopolitical exposure, not Treasury yields, which weakens gold’s historical link to interest rates [T4].
Supply cannot easily meet this demand. Mine output rose 3% to a third-quarter record of 1,071 tonnes, but total supply slipped about 1% as recycling weakened and producers reduced hedging [T4]. For EUR investors, the additional layer is the euro rate complex: with the euro area AAA 10Y at 3.29%, the local carry disadvantage is real, and EUR/USD at 1.1189 means USD-gold moves are partially dampened in euro terms. The base case is rangebound consolidation with upside optionality: if official-sector and ETF demand keeps absorbing supply even at restrictive real yields, gold can work toward retesting its January 2026 ATH of EUR 4,688.32. If central bank buying slows and real yields hold above 2.5%, the yield-less nature of bullion reasserts itself and the 200-day downtrend of -12.05% extends.
Bullish Drivers
- Structural official-sector demand. Reserve diversification away from the dollar, sanctions-risk hedging, and concerns over US fiscal health and Fed independence continue to drive central bank accumulation [T2]. A record 43% of 73 monetary authorities plan to increase gold reserves over the next year [T1].
- Record ETF holdings. Gold-backed ETFs added 211.2 tonnes after Q2 outflows, taking global holdings to a record 4,256 tonnes, tied to concerns over fiscal sustainability and inflation [T4].
- Supply constraints. Despite record mine output of 1,071 tonnes in Q3, total supply fell about 1% on weaker recycling and reduced producer hedging [T4].
- Geopolitical and geoeconomic environment. The World Gold Council identifies a supercharged geopolitical backdrop and generalised USD weakness as the two macro drivers of the 2025 rally, with investment demand surging across all regions [T5].
- Dovish scenario upside. In a growth-slowdown scenario where the Fed cuts beyond current expectations, the WGC analysis sees gold rising 5% to 15% in 2026 from current levels, depending on slowdown severity and cut magnitude [T5]. This is a scenario assumption, not a decision or current market pricing.
- Historical precedent for the broken link. Gold was little changed in 2022 and returned +13% in 2023 despite real yields at post-2008 highs, evidence that official and investment demand can override the yield channel [T1].
Relative Positioning vs Bitcoin and Ethereum
The bundle lists Ethereum as a configured benchmark, but no current Bitcoin or Ethereum price or performance data is available in the dataset. The comparison is therefore qualitative, with a flagged data gap. Context from the bundle: total crypto market capitalisation stands at USD 2,240.8bn with Bitcoin dominance at 59.62%, and the XAU listing (PAX Gold, rank 48) shows a tokenized market cap of EUR 1.64bn, which reflects the instrument, not the physical gold market.
Positioning logic: gold’s role in a portfolio is diversification amid equity froth concerns and lacklustre bond returns [T5], while crypto assets carry higher beta to risk appetite. In a risk-off growth shock with falling real yields, gold’s safe-haven properties should outperform crypto. However, in a liquidity-driven selloff, gold can fall alongside risk assets because its high liquidity makes it a source of funds to cover losses elsewhere [T7]. In a risk-on easing cycle, crypto beta would likely outperform and gold would lag in relative terms. Quantified BTC/ETH benchmarking is unavailable in this dataset.
Scenario Framework
| Scenario | Key inputs | Gold implication (EUR terms) |
|---|---|---|
| Base: consolidation | Fed funds target range stays at 3.75% to 4.00%, with Fed funds futures assigning an 84% probability to a further hike at the December meeting per CME FedWatch [T6]; 10Y real yield stays near 2.63% [T3]; EUR/USD near 1.1189 | Rangebound trade. In USD terms, the technical frame is a $4,000 to $4,200 range with $4,200 as key resistance [T3] and $4,150 a tough level to crack [T8]. EUR price oscillates around EUR 3,650. |
| Hawkish: correction extends | Hot CPI confirms the December hike path implied by the 84% futures-implied probability [T6]; 10Y real yields push decisively above the 2.60% to 2.65% early-November band [T3] | Opportunity cost rises further; gold retests yearly lows (COMEX yearly low $3,870 [T8]) and the 200-day -12.05% drawdown deepens. EUR/USD strength on hawkish Fed pricing would partially cushion EUR-denominated losses. |
| Dovish: policy pivot | Growth slowdown forces the Fed to cut beyond expectations; weaker dollar plus risk aversion [T5] | Per WGC scenario analysis, gold could rise 5% to 15% in 2026 from current levels [T5]. Applied to EUR 3,654.12, that implies roughly EUR 3,837 to EUR 4,202 before FX effects. A 3% EUR/USD depreciation would add roughly 3% to EUR returns; a 3% appreciation would subtract a similar amount. |
Note: the WGC consensus frame of around 75 bp of additional Fed cuts with core inflation falling 40 to 60 bp by year-end [T5] conflicts with the current tape, in which Fed funds futures imply an 84% probability of a December hike [T6]. Treat the WGC frame as a diverging scenario, not the current market expectation. All forward paths are market expectations or scenario assumptions, not decisions.
Valuation Discussion
On simple anchors, gold in EUR sits in the middle of its historical range: 22.06% below the January 2026 ATH of EUR 4,688.32 and 188.80% above the 2019 ATL of EUR 1,265.28. A retest of the ATH implies +28.3% upside; a return to yearly lows implies materially more downside. Cross-check: the December 2026 COMEX settlement of $4,074.90/oz from Friday [T3] divided by EUR/USD 1.1189 gives roughly EUR 3,642/oz, close to the bundle price of EUR 3,654.12; the small gap reflects timing and spread differences.
On framework valuation, the WGC Gold Valuation Framework shows rangebound value when consensus macro inputs are used: global GDP growth of 2.7% to 2.8% y/y, broadly flat yields, and a modestly higher dollar [T5]. Under consensus, gold offers limited re-rating potential. The counterargument is the de-anchoring case: the historical inverse real-yield relationship has broken down over the past two years [T1], and if official-sector demand persists, valuation on yield grounds alone understates fair value. For EUR investors specifically, the local opportunity cost is the euro area AAA 10Y at 3.29%, which is higher than the US 10Y real yield of 2.63% [T3], and EUR/USD at 1.1189 (-4.77% YTD) means USD-gold strength has been partially offset in euro terms this year. Net assessment: not cheap on carry, not stretched on flow-based demand; valuation depends on which buyer regime dominates.
Risks
- Further tightening. Fed funds futures price an 84% probability of a December hike per CME FedWatch, according to a Reuters report from 10 November 2026 [T6]. Higher rates raise the opportunity cost of non-yielding bullion [T6].
- Sticky real yields. The 10Y real yield held a 2.60% to 2.65% band in early November [T3]. Persistently high yields and resilient economic data weaken the constructive case [T3].
- Energy-shock dynamics. A supply-driven inflation shock keeps central banks restrictive and the dollar strong, pressuring gold as in 2022 [T7].
- Liquidity trap in selloffs. Gold’s high liquidity makes it a funding source when investors cover losses elsewhere, undermining safe-haven behaviour precisely when it is needed [T7].
- Fading structural support. Central bank demand is above average but below the records of the previous three years [T5]. If ETF holdings or official purchases stall, the price floor built on structural demand weakens.
- Data-quality risk. The BLS will not publish annual inflation readings due to shutdown-related data disruption [T8], impairing year-over-year inflation context and model inputs.
- Hawkish tail. A December hike plus sticky inflation pushing 10Y real yields decisively above 2.65% could break gold below its yearly low of $3,870 in COMEX terms [T8].
Appendix
Policy Rates (authoritative)
- US Federal Funds Target Range: 3.75% to 4.00%, as of 2026-11-09; last change: hike of 25 bp, effective 2026-09-17.
- ECB Deposit Facility Rate: 2.50%, as of 2026-11-10; last change: hike of 25 bp, effective 2026-09-16.
Data Provenance and Caveats
- Market data retrieved 2026-11-10 05:20 UTC. Euro area yields are ECB yield curve data as of 2026-11-06. Equity and FX data are as of 2026-11-09/10.
- The XAU listing uses coingecko_id pax-gold; the market cap of EUR 1.64bn and 24h volume of EUR 84.4m reflect the tokenized instrument, not the physical gold market or the 4,256-tonne ETF complex [T4].
- Source dating: T3 figures are as of 6 November 2026; T4 figures are as of 4 November 2026 per the article of 5 November 2026; T6 is a Reuters report from 10 November 2026; T2 is a September 2025 commentary used as background on the structural reserve-accumulation trend; T5 is the WGC 2026 outlook; T7 contains April-dated references (Fed hold, China’s April purchases of 8.1 tonnes) and is cited only as older background, never as current state.
- No current Bitcoin or Ethereum price data is in the dataset; the ECB forward guidance path is not in the dataset.
- All forward-looking statements (the 84% December hike probability, the WGC 5% to 15% range, technical levels in USD terms) are market expectations or scenario assumptions, not central bank decisions.
Sources
- [T1] Is it a golden era for gold? | J.P. Morgan Private Bank U.S.
- [T2] COMMENTARY: Gold’s rise in central bank reserves appears unstoppable (Reuters, September 2025)
- [T3] Gold Price Outlook: High Real Yields Pose a Risk Ahead of US CPI (FXEmpire)
- [T4] Central Banks Just Bought More Gold Than the World’s Jewelry Buyers (24/7 Wall St., 5 November 2026)
- [T5] Gold Outlook 2026: Push ahead or pull back (World Gold Council)
- [T6] Gold edges lower as focus shifts to US inflation data (Reuters, 10 November 2026)
- [T7] Why gold isn’t acting like a safe haven right now (ING THINK)
- [T8] $4,150 remains a tough nut to crack for Gold as US CPI report looms (FXStreet, 10 November 2026)
Disclaimer
This report is AI-generated, for informational purposes only, and does not constitute investment advice. Figures should be verified independently before any decision. Past performance is not indicative of future results.
Important Note / Wichtiger Hinweis:
EN: This report may have been generated using AI. It processes data from publicly available sources. The content is provided for informational purposes only.DE: Dieser Bericht kann mithilfe von KI erstellt worden sein. Dabei werden Daten aus öffentlich zugänglichen Quellen verarbeitet. Die Inhalte dienen ausschließlich Informationszwecken.
* DE: Die ergänzenden Inhalte können KI-generiert sein. EN: The additional content may be AI-generated.