
Watch the video
This player shows only the Gold chapter of the daily altii market briefing. Watch the full video on tube.altii.de.
Key Data Snapshot
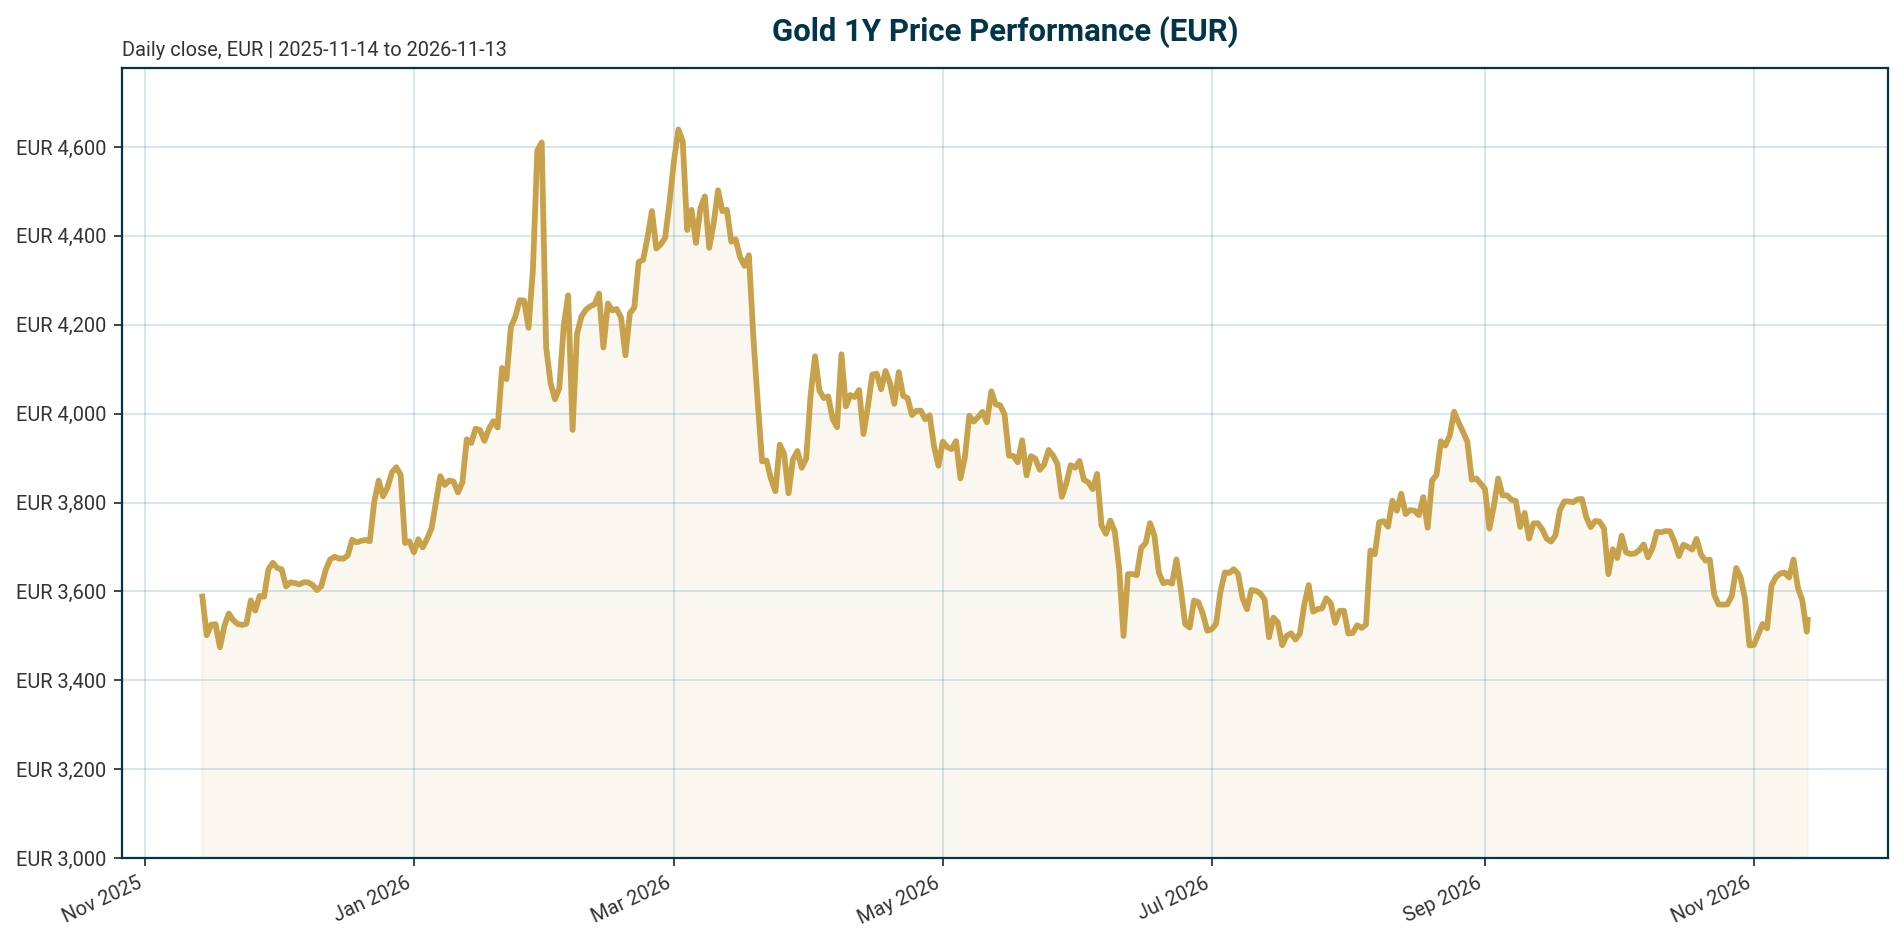
Gold (XAU, quoted in EUR) trades at EUR 3,532.46 as of 13 November 2026, 05:20 UTC. The metal is in a corrective phase, negative across every listed horizon, and sits roughly a quarter below its January 2026 all-time high.
| Metric | Value |
|---|---|
| Price (XAU/EUR) | EUR 3,532.46 |
| 24h range | EUR 3,482.22 to EUR 3,590.37 (~3.11% band) |
| Change 24h / 7d / 30d | -1.29% / -3.32% / -6.28% |
| Change 200d / 1y | -17.21% / -6.97% |
| All-time high | EUR 4,688.32 (28 Jan 2026), currently -24.65% |
| All-time low | EUR 1,265.28 (17 Nov 2019), currently +179.18% |
| Market cap (tokenized instrument) | EUR 1.58bn (447,684.21 units, rank 49) |
| 24h volume | EUR 131.6m |
| Fed funds target range | 3.75% to 4.00% (as of 2026-11-12); last change: hike of 25 bp, effective 2026-09-17 |
| ECB deposit facility rate | 2.50% (as of 2026-11-13); last change: hike of 25 bp, effective 2026-09-16 |
| Euro area AAA 10Y yield | 3.34% (+39.2 bp YTD); AAA 2Y at 3.05%; 10Y-2Y spread 29.5 bp |
| EUR/USD | 1.1106 (-5.48% YTD) |
Calculation check: distance from ATH = 3,532.46 / 4,688.32 – 1 = -24.65%; distance from ATL = 3,532.46 / 1,265.28 – 1 = +179.18%. Both match the bundle data. The 200d decline of -17.21% versus the 1y decline of -6.97% shows the correction accelerated in the last two to three quarters.
Macro Backdrop
Market overview: Risk sentiment is neutral to positive, with equity momentum moderately negative and DACH equities outperforming global peers: DACH indicators average +3.79% over five days versus +1.84% for global equity indicators. The Nikkei 225 posts the strongest five-day move at +4.22%, while the Hang Seng is weakest at -2.97%; the DAX leads on a one-month basis at +5.99%. The rates backdrop is mixed, with the euro area AAA 10Y yield at 3.34%, up 4.6 bp over five days, and the AAA 10Y-2Y spread at 29.5 bp. FX is mixed: EUR/USD trades at 1.1106, down 0.72% over five days, and EUR/CHF shows the strongest five-day FX move at +0.74%. These conditions are context; the gold-specific analysis below is the focus.
Policy is restrictive on both sides of the Atlantic. The Federal Reserve funds target stands at 3.75% to 4.00% after a 25 bp hike effective 17 September 2026, and the ECB deposit facility rate is 2.50% after a 25 bp hike effective 16 September 2026. For a non-yielding asset, this is a first-order headwind: higher real yields raise the opportunity cost of holding gold [T6], and real yields and the dollar remain the key constraints on the metal [T3]. Euro area AAA 2Y yields are up 93.7 bp YTD, outpacing the 10Y at +39.2 bp, so the front end has re-priced hawkishly this year.
For EUR-based investors, currency translation matters. EUR/USD at 1.1106 is down 5.48% YTD, which cushions USD-gold weakness in EUR terms. The bundle contains no XAU/USD spot, so the split of the -6.97% one-year EUR return into a USD-gold component and an FX component cannot be computed precisely; it can only be described qualitatively. Euro-area inflation expectations are also not in the dataset, so a euro real-yield proxy cannot be stated; only the nominal 3.34% AAA 10Y yield is available.
On expectations, not decisions: ING’s US economist expects the Fed to begin cutting rates in the second quarter, per [T4] as of its source date, and the World Gold Council’s consensus baseline assumes around 75 bp of additional Fed cuts with core CPI/PCE falling roughly 40 to 60 bp by year-end, per [T7]. These are market expectations and scenario inputs, not policy commitments.
Investment Thesis
The core tension in gold today is a structural bid against a cyclical headwind. The structural bid is official-sector and private demand for hard assets: central bank net purchases hit a record 1,082 tonnes in 2022, more than double the prior ten-year average, and that pace was sustained through 2023 and 2024, slowing only slightly through the first three quarters of 2025 despite the sharp price rally [T1]. A record 43% of 73 surveyed monetary authorities expect their own gold reserves to increase over the next year [T1]. Poland is targeting around 700 tonnes, up from roughly 550 tonnes, and China extended its buying streak to fifteen consecutive months, per [T4] as of its source date. Gold’s strength despite fluctuating rate expectations points to a structural rather than speculative bid [T2].
The cyclical headwind is restrictive policy. With the Fed at 3.75% to 4.00% and the ECB at 2.50%, both following September 2026 hikes, real yields are elevated and the opportunity cost of gold is high. The 200d decline of -17.21% versus the 1y decline of -6.97% quantifies how much of the de-rating is recent.
A caution on the bullish narrative: Fed economist Weiss argues, per [T8] dated 10 November 2026, that the 2025 price surge was driven primarily by private sector demand via ETF inflows, that official demand alone would not have sufficed, and that reserve repatriations do not signal de-dollarization. In 2025, world international reserves held in gold did surpass foreign official holdings of US Treasuries [T8], but the interpretation is contested. The thesis therefore rests on both legs of demand holding: central banks provide the floor, private and ETF flows provide the momentum. At EUR 3,532.46, 24.65% below the January high, the entry point already embeds a meaningful correction.
Bullish Drivers
- Price-insensitive official demand. Central bank buying since 2022 has been steady and largely price insensitive, driven by sanctions risk, geopolitical fragmentation and a desire to reduce dollar reliance [T4]. As long as fragmentation persists, a meaningful reversal looks unlikely [T4].
- Record survey intent. 43% of 73 global monetary authorities expect to raise gold reserves over the next year [T1].
- Policy easing potential. ING’s US economist expects Fed cuts beginning in Q2, per [T4] as of its source date; the WGC consensus embeds around 75 bp of additional cuts, per [T7]. Even a modest easing cycle would lower real yields and reduce the opportunity cost of gold [T4]. These are expectations, not decisions.
- Renewed ETF appetite. Private sector demand jumped in late 2024 through physical gold-backed ETF inflows [T8], and ETF appetite has been renewing per [T4] as of its source date.
- Reserve-asset concerns. Worries over inflation, deteriorating US fiscal health, Federal Reserve independence and geopolitical instability support reserve demand for gold [T5].
- Growth-shock hedging. Gold’s safe-haven edge is strongest in financial crises or growth shocks, when real yields fall and the dollar weakens [T3].
Scenario outputs from the WGC, labeled as assumptions and not forecasts: under a growth-slowdown scenario with Fed cuts beyond consensus, gold could rise 5% to 15% in 2026; under a confidence-driven downturn with aggressive cuts and flight-to-safety, 15% to 30% [T7]. Applied to EUR 3,532.46, +5% is roughly EUR 3,709, +15% is roughly EUR 4,062, and +30% is roughly EUR 4,592. These ranges are USD-based WGC outputs, so applying them to the EUR quote is an approximation.
Relative Positioning vs Bitcoin and Ethereum
The tracked gold instrument shows a market cap of EUR 1.58bn on tokenized supply of 447,684.21 units, with 24h volume of EUR 131.6m. This reflects the tokenized wrapper, not the physical gold market, so scale comparisons with crypto assets require care. The broader crypto market context from the bundle: total crypto market cap of EUR 2,115.6bn, 24h volume of EUR 77.5bn, and Bitcoin dominance at 59.10%.
Gold’s drawdown profile compares favorably with crypto’s typical behavior in the same macro regime. XAU/EUR is down 6.97% over one year and 24.65% from its high, with a 24h trading band of roughly 3.11%. Crypto assets historically draw down far deeper in restrictive-liquidity phases. Per [T2], the current macro contest is framed as resilient hard-asset demand across the complex, with gold and oil signaling persistent inflation risks while Bitcoin’s range is debated; hard-asset demand is the shared theme, but gold’s volatility profile makes it portfolio ballast rather than a return engine.
Scenario framing (assumptions): in a risk-off growth shock, falling real yields favor gold over crypto; in a liquidity-driven risk-on melt-up, crypto beta outpaces gold [T2]. If inflation stays sticky and central banks hold or hike further, both assets face valuation pressure, but gold’s drawdowns are historically shallower.
Data gap: the bundle contains no Ethereum price or performance data, so the ETH leg of this comparison cannot be quantified and is unavailable in this dataset.
Scenario Framework
All scenarios below are assumptions, not forecasts. Policy levels are the current authoritative state; forward paths are market expectations or scenario inputs.
| Scenario | Key assumptions | Indicative XAU/EUR implication |
|---|---|---|
| Base | Policy stays restrictive near term with the Fed at 3.75% to 4.00% and the ECB at 2.50%. WGC consensus baseline: global GDP growth of 2.7% to 2.8% y/y, around 75 bp of additional Fed cuts, core CPI/PCE down 40 to 60 bp by year-end, dollar edging higher, yields broadly flat [T7]. Central bank buying continues. | Rangebound around EUR 3,500. The WGC valuation framework shows rangebound performance under consensus inputs [T7]. |
| Bull | Fed cuts beyond consensus as growth cools, dollar softens, real yields fall [T6][T7]. Extreme path: a confidence-driven downturn prompts aggressive cuts, sharply lower long yields and flight-to-safety [T7]. | +5% to +15% in 2026, roughly EUR 3,709 to EUR 4,062; extreme path +15% to +30%, roughly EUR 4,062 to EUR 4,592 [T7]. USD-based outputs, approximate in EUR. |
| Bear | Energy-supply shock re-accelerates inflation, keeping central banks on hold or prompting further hikes; higher oil pushes inflation up, strengthens the dollar and weighs on gold [T3]. Real yields rise further [T6]. | Deeper correction from the EUR 4,688.32 ATH. Gold underperforms in supply-shock regimes because it is not a supply-shock hedge [T3]. |
Valuation Discussion
Under consensus macro inputs, EUR 3,532.46 looks broadly fair rather than cheap or rich. The WGC Gold Valuation Framework produces rangebound performance when fed market consensus variables, implying the current price largely reflects macro consensus on growth, inflation and monetary policy [T7]. Upside therefore requires macro inputs to deviate from consensus, not merely for consensus to play out.
The anchors frame the range. Gold is 24.65% below its January 2026 ATH of EUR 4,688.32 and 179.18% above its 2019 ATL of EUR 1,265.28. The asymmetry between the 200d change of -17.21% and the 1y change of -6.97% shows most of the de-rating happened recently, which cuts both ways: momentum is negative, but the valuation has already reset meaningfully from the peak.
Two cautions temper the valuation case. First, per [T8] dated 10 November 2026, the 2025 surge required strong demand from both private and official investors; official demand alone would not have caused it. If the private/ETF demand wave reverses, the valuation anchor shifts down even with central bank buying intact. Second, currency matters: with EUR/USD at 1.1106 and down 5.48% YTD, the EUR quote understates the USD-side correction. EUR-based valuation and USD-based valuation are not the same exercise, and the bundle lacks XAU/USD spot to reconcile them precisely.
Risks
- Policy risk. Both central banks last moved with 25 bp hikes in September 2026 (Fed effective 2026-09-17, ECB effective 2026-09-16). A further hike or a prolonged hold keeps real-yield headwinds in place and is the clearest downside trigger for XAU/EUR.
- Energy-shock risk. A supply-driven oil shock pushes inflation up, keeps central banks restrictive and strengthens the dollar, a combination historically negative for gold [T3].
- Demand-concentration risk. If private and ETF demand fades [T8], the structural central-bank floor may not prevent corrections, since official demand alone was insufficient to drive the 2025 surge [T8].
- Narrative risk. The de-dollarization story supporting reserve demand [T1][T5] is contested: Fed economist Weiss argues reserve repatriations and gold’s reserve share do not signal active de-dollarization, per [T8] dated 10 November 2026.
- Two-sided fiscal and independence risk. Concerns over US fiscal health and Fed independence support reserve gold demand [T5], but the same forces can lift yields and the dollar, weighing on price [T3].
- Data gaps. No current US CPI, payrolls or inflation-expectations data, no XAU/USD spot, and no Ethereum price data are in the bundle. Several news sources are undated; all news figures carry explicit source-date attribution. Euro-area inflation expectations are unavailable, so euro real yields cannot be computed here.
Upside trigger: a dovish surprise, meaning earlier or deeper cuts than the roughly 75 bp consensus in [T7], would be the clearest bullish catalyst. Downside trigger: additional hikes by either central bank.
Appendix
Methodology and data provenance. Market data retrieved 2026-11-13T05:20:24Z; market overview data as of 2026-11-12/13. Policy rates come from the authoritative Policy Rates block (Fed via FRED, ECB via ECB key rate) and are the only current policy levels used in this report. The tracked instrument is PAX Gold (pax-gold), a tokenized gold wrapper; its market cap of EUR 1.58bn reflects tokenized supply of 447,684.21 units, not the physical gold market. Scenario price levels apply WGC USD-based percentage ranges to the EUR quote and are approximations. Where a news source lacks a publication date, figures are cited “as of source date” and never presented as the current state.
Glossary. Real yield: a nominal yield minus expected inflation; it drives the opportunity cost of holding non-yielding gold. Opportunity cost: the return forgone by holding an asset that pays no interest. Deposit facility rate: the ECB rate that anchors euro money-market rates. BTC dominance: Bitcoin’s share of total crypto market capitalization. ATH/ATL: all-time high / all-time low in the quoted currency.
Sources
- [T1] Is it a golden era for gold? | J.P. Morgan Private Bank U.S. (undated)
- [T2] Does $80,000 Bitcoin remain more likely than $60,000 as Gold and Oil signal persistent inflation risks? (FXStreet, November 2026 per URL)
- [T3] Why gold isn’t acting like a safe haven right now | ING THINK (undated)
- [T4] Why the gold rally isn’t over yet | ING THINK (undated)
- [T5] COMMENTARY: Gold’s rise in central bank reserves appears unstoppable (Reuters, September 2025)
- [T6] US CPI and PPI Preview: How Inflation Could Move Gold Prices (VT Markets, undated)
- [T7] Gold Outlook 2026: Push ahead or pull back (World Gold Council, undated)
- [T8] Gold reserve repatriations don’t mean central banks are de-dollarizing – Fed’s Weiss (Kitco News, 10 November 2026)
Disclaimer. This report is AI-generated, for informational purposes only, and does not constitute investment advice. It should not be relied upon for making investment decisions; readers should conduct their own research and consult a licensed advisor where appropriate.
Important Note / Wichtiger Hinweis:
EN: This report may have been generated using AI. It processes data from publicly available sources. The content is provided for informational purposes only.DE: Dieser Bericht kann mithilfe von KI erstellt worden sein. Dabei werden Daten aus öffentlich zugänglichen Quellen verarbeitet. Die Inhalte dienen ausschließlich Informationszwecken.
* DE: Die ergänzenden Inhalte können KI-generiert sein. EN: The additional content may be AI-generated.