
Watch the video
This player shows only the Gold chapter of the daily altii market briefing. Watch the full video on tube.altii.de.
Key Data Snapshot
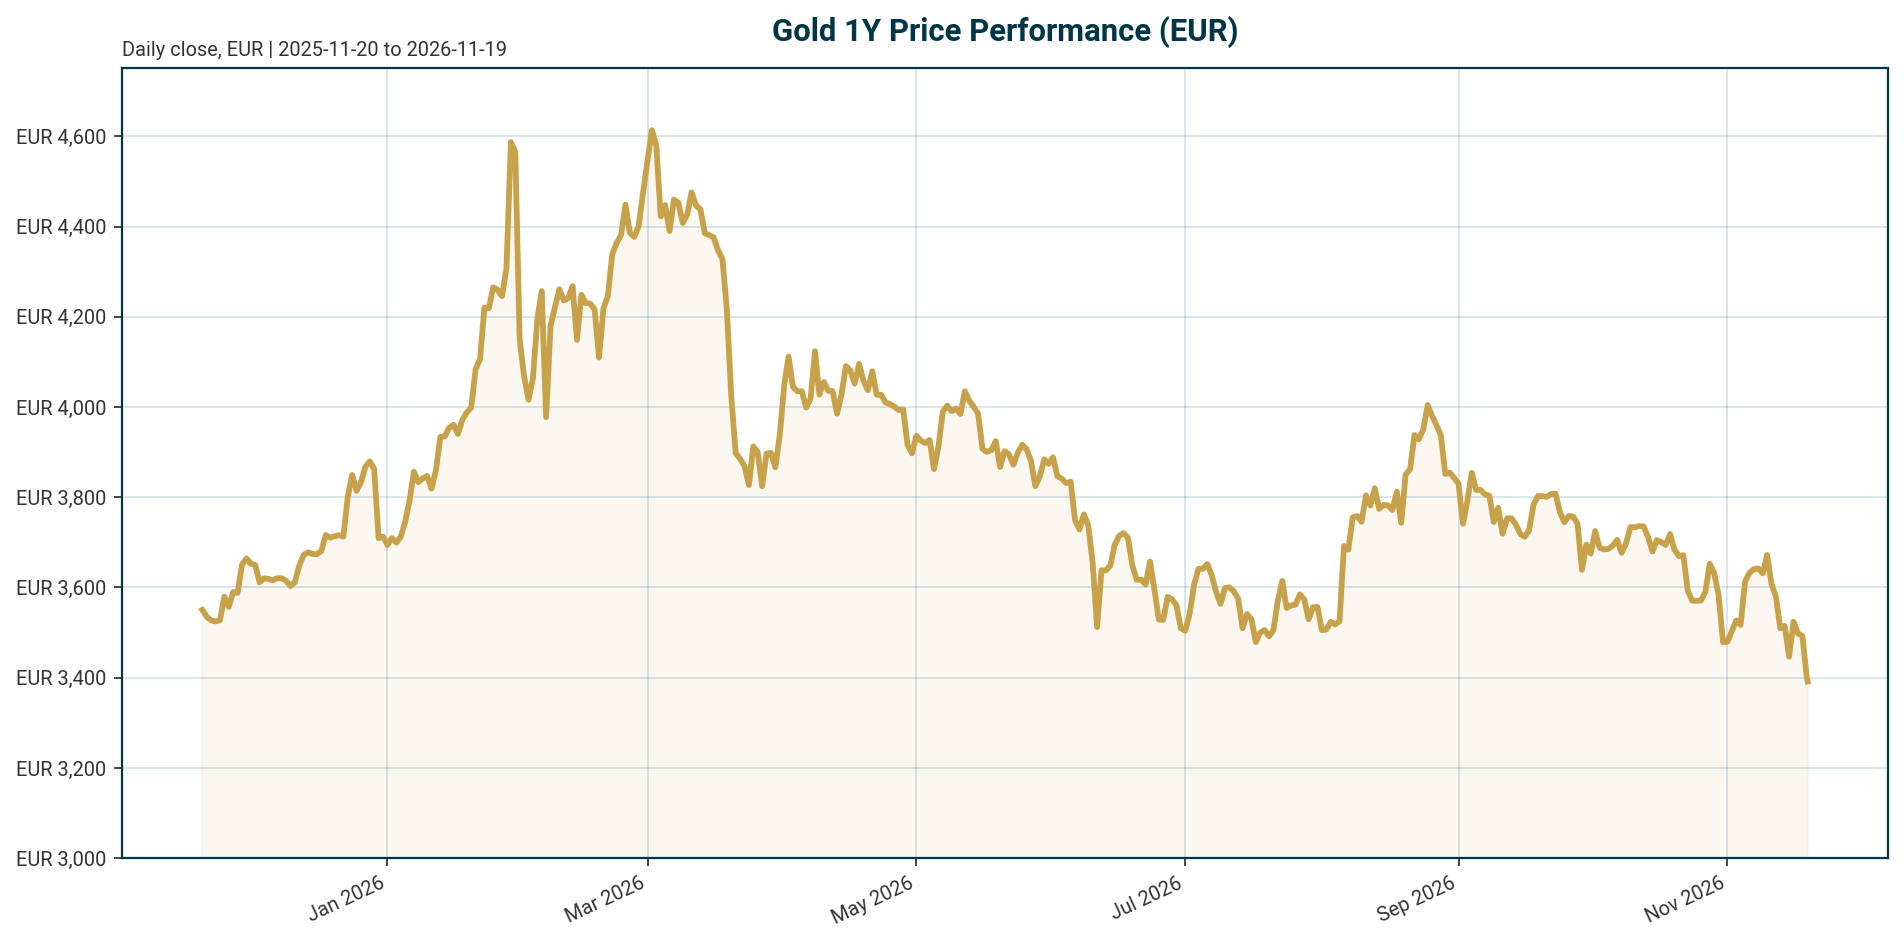
Gold (XAU), quoted in EUR, trades at 3,395.02 as of 19 November 2026. The metal is in a confirmed drawdown regime: it has lost 10.33% over 30 days and sits 27.59% below its all-time high of 4,688.32 set on 28 January 2026. The 24-hour range spans 3,363.87 to 3,448.08.
| Metric | Value |
|---|---|
| Price (XAU/EUR) | 3,395.02 |
| 24h change | -1.37% |
| 7d / 14d / 30d change | -6.50% / -10.02% / -10.33% |
| 200d / 1y change | -19.21% / -8.41% |
| All-time high | 4,688.32 (28 Jan 2026), currently -27.59% |
| All-time low | 1,265.28 (17 Nov 2019), currently +168.32% |
| 24h volume | EUR 126.9m |
| Fed funds target range | 3.75% to 4.00% (as of 2026-11-18); last change: hike of 25 bp, effective 2026-09-17 |
| ECB deposit facility rate | 2.50% (as of 2026-11-19); last change: hike of 25 bp, effective 2026-09-16 |
| EUR/USD | 1.0994 (-0.68% over 5 days, -6.43% YTD) |
| Euro area AAA 10Y yield | 3.42% (+8.4 bp over 5 days, +47.7 bp YTD) |
Verification of the drawdown: (3,395.02 – 4,688.32) / 4,688.32 = -27.59%, matching the bundle figure. Distance above the all-time low: (3,395.02 – 1,265.28) / 1,265.28 = +168.32%, also confirmed.
Scenario framing, not a forecast: if the September 2026 hikes mark the end of the tightening cycle, the 30-day drawdown of -10.33% may represent peak cyclical pressure. If further hikes follow, the drawdown extends.
Macro Backdrop
Market overview: Risk sentiment is negative and equity momentum is moderately negative, with DACH indicators averaging -4.11% over five days versus -3.42% for global equity indicators. The Nikkei 225 posted the strongest five-day move at -3.11%, while the ATX is the weakest at -4.35%. The rates backdrop shows mixed euro yields: the euro area AAA 10Y yield stands at 3.42%, up 8.4 bp over five days, with a 10Y-2Y spread of 33.2 bp. The euro is broadly weaker, with EUR/USD at 1.0994, down 0.68% over five days. These observations frame a risk-off environment in which gold’s safe-haven bid competes directly with rising opportunity cost from higher yields.
The policy backdrop has turned hostile on both sides of the Atlantic. The Federal Reserve’s target range stands at 3.75% to 4.00% following a 25 bp hike effective 17 September 2026. The ECB raised its deposit facility rate by 25 bp to 2.50%, effective 16 September 2026. No further policy decisions appear in the dataset.
The transmission channel to gold runs through real yields and the dollar. According to [T1], the 10-year Treasury real yield stood at 2.84% after peaking at 2.94%, the highest since November 2008, and the US dollar index traded at its highest level in roughly 19 months. The same source, which is undated in our dataset, reported October CPI rising 0.4% month-on-month against 0.3% expected, gasoline prices up more than 25% year-on-year on the Middle East conflict, and non-housing services inflation running near a 5% annual pace. Chicago Fed President Goolsbee called the report “borderline disturbing” [T1].
For EUR-based investors the picture is mixed. The weaker euro (EUR/USD -6.43% YTD) cushions EUR-denominated gold against USD-gold weakness, but rising euro area yields raise the EUR opportunity cost of holding a zero-yield asset. Euro area AAA 2Y yields are up 98.4 bp YTD to 3.09%. A euro area real yield cannot be computed from this dataset because no euro-area inflation figure is included; this is stated explicitly rather than substituted with a US figure.
Investment Thesis
The core tension is a cyclical headwind set against a structural floor. Cyclically, the hawkish turn at the Fed and ECB, elevated real yields near post-2008 highs, and dollar strength have driven gold down 10.33% in EUR terms over 30 days. Structurally, official-sector demand is running at record pace and absorbs supply at prices that are yield-insensitive.
The flow evidence is substantial. The World Gold Council reported net central bank purchases of 321 tonnes in Q3 (July to September), a 46% rise year-on-year and the fastest pace since late 2024, in a report published on 3 November [T5]. [T1] cites the same 321 tonnes as 42% above a year earlier, bringing the year-to-date total to 675 tonnes; we use the WGC November 3 report as primary and note the discrepancy in the growth rate. Goldman Sachs estimated 79 tonnes of central bank purchases in August alone, more than four times the pre-2022 average of 17 tonnes, with the three-month seasonally adjusted pace running at 85 tonnes per month and China accounting for roughly 25 tonnes in August, according to [T4] from October 2026.
The reserve diversification trend underpins this demand. Central banks held approximately 38,600 tonnes of gold, worth about US$5tn, at end-2025, and gold reached 29% of total global allocated reserves by Q1 2026 per IMF COFER data, second only to the US dollar [T7]. In the WGC’s 2026 survey, 74% of respondents expected moderate or significantly lower US dollar holdings in global reserves over the next five years [T7]. Conviction runs deep: 89% of surveyed central banks expect global central bank gold reserves to rise over the next 12 months, a record 45% expect their own holdings to increase, and only 1% expect a decline [T6].
Investor flows are two-sided. US investors pulled about $1.8bn from the largest gold fund in October, but global gold funds still took in roughly $2.7bn as European and Asian buyers stepped in [T1]. The WGC also finds that central banks tend to buy more when prices fall, which cushions declines [T1].
On the structural side, SSGA’s Monthly Gold Monitor identifies record global government debt loads, elevated stock/bond correlations driving demand for liquid diversifiers, central bank demand up 6% year-on-year in 2026, record Chinese retail buying up 67% year-on-year, and elevated macro policy uncertainty as the pillars of the structural case [T8].
Net view: the cyclical and structural forces currently point in opposite directions. Base scenario: central bank buying at an 85 tonnes/month pace absorbs investment-sector outflows and keeps EUR gold range-bound in the low-to-mid 3,000s while real yields stay high. Bull scenario: a policy pause or pivot restores the ETF-led demand channel that drove the 2024 to Q1 2026 rally. Bear scenario: continued hawkish delivery on both sides of the Atlantic pushes real yields to new highs and overwhelms the price-insensitive official bid, as the -10.33% 30-day move illustrates.
Bullish Drivers
- Reserve security and repatriation. The freezing of roughly $300bn of Russian foreign reserves in 2022 catalyzed structurally higher central bank buying, roughly twice the pre-2022 pace, because gold held in a domestic vault is no one else’s liability and cannot be frozen [T6]. Goldman’s August survey found 12% of central banks in 2026 declined to confirm their gold storage location (versus 10% the prior year), 10% diversified overseas storage in 2026 (versus 2%), and 9% increased domestic storage (versus 5%); 9% plan further diversification over the next 12 months [T4].
- Headroom in emerging market allocations. Developed market central banks hold on average 30% of reserves in gold versus 15% for emerging markets, which held only around 4% in 2010 [T7]. Goldman argues China remains underweight relative to plausible long-term allocations and that motivations for diversifying away from G7 reserve currencies are likely to remain in place [T4].
- Price-insensitive dip buying. The WGC observes that central banks tend to increase purchases when prices fall, providing a mechanical floor during drawdowns [T1].
- Negative risk sentiment. Global equities are under pressure: the S&P 500 fell 3.54% over five days, the Nasdaq Composite is down 7.57% over one month, and the Hang Seng is down 10.84% YTD. This supports defensive allocation to gold.
- FX cushion for EUR holders. With EUR/USD down 6.43% YTD, EUR-quoted gold has outperformed USD-quoted gold on the euro’s weakness alone.
- Fiscal and diversification demand. Record global government debt, exacerbated by energy price inflation and war spending, plus historically elevated stock/bond correlations, sustain demand for gold as a liquid diversifier [T8].
Scenario (reserve acceleration): if the 89% of central banks expecting higher global reserves [T6] materialize at the current 85 tonnes/month pace [T4], official demand alone could absorb the supply overhang in a falling-price environment. Scenario (safe-haven rotation): a deepening of the current negative equity momentum could revive Western ETF inflows, reversing the October US fund outflow of $1.8bn [T1].
Relative Positioning vs Bitcoin and Ethereum
Data limitation: this bundle contains no current Bitcoin or Ethereum price, return, or market cap data, so a like-for-like return or drawdown comparison cannot be made from the dataset. This gap is flagged explicitly. What the dataset does provide is aggregate crypto context: BTC dominance of 58.13%, total crypto market capitalization of approximately $2.00tn, and total crypto 24-hour volume of approximately $67.34bn.
Three analytical points remain valid. First, gold and crypto are both monetary-regime-sensitive assets. According to [T8], gold rallied from roughly $2,000/oz to a record above $5,000/oz as policy turned dovish from 2024 to Q1 2026, and has since fallen roughly 28.5% from its record on the hawkish turn. Assets in this category tend to correlate on liquidity conditions even when their drivers differ. Second, both compete for the diversifier niche: demand for liquid diversifiers is elevated because stock/bond correlations remain historically high [T8]. Third, gold’s structural bid has no crypto analogue. The central bank purchase flow of 321 tonnes in Q3 [T5] is price-insensitive, sovereign, and persistent; crypto has no equivalent buyer that accumulates mechanically on dips.
Note on market cap comparability: the bundle’s XAU market cap of EUR 1.52bn reflects the PAX Gold proxy, a tokenized gold product ranked 48, not the physical gold market. The WGC sizes official-sector holdings alone at roughly US$5tn [T7]. Any market-cap-based comparison between gold and crypto from this dataset would be misleading.
Scenario (risk-off divergence): with risk sentiment negative, the test is whether crypto underperforms gold as the higher-beta monetary alternative; this requires external BTC/ETH data and remains a flagged gap. Scenario (liquidity squeeze): the Fed’s 3.75% to 4.00% target range tightens global liquidity, pressuring both asset classes, but gold’s official-sector bid provides a cushion crypto lacks.
Scenario Framework
All scenarios below are labeled assumptions, not forecasts. Policy anchors come exclusively from the Policy Rates block: Fed funds target range of 3.75% to 4.00% (hike of 25 bp effective 2026-09-17) and ECB deposit rate of 2.50% (hike of 25 bp effective 2026-09-16). No further central bank decisions are in the dataset.
- Base scenario (assumption): the Fed and ECB hold at current levels after the September 2026 hikes. Real yields stay near the 2.8% to 2.9% area reported by [T1]. Central bank buying continues near 85 tonnes/month [T4]. EUR gold consolidates in the low-to-mid 3,000s with a downward bias while equity risk sentiment stays negative.
- Bull scenario (assumption): inflation persistence, with services inflation near a 5% annual pace per [T1], erodes real rates from the supply side even without nominal cuts. The euro’s weakness persists, and EUR gold retests the 4,000+ region. This is directionally consistent with SSGA’s 12-month base case range of $4,500 to 5,250/oz, a dated source expectation from [T8], not this report’s forecast. Converted at spot EUR/USD of 1.0994, that range implies roughly EUR 4,092 to 4,774, a scenario conversion at current FX, not SSGA’s own EUR view.
- Bear scenario (assumption): further hikes from both central banks push the 10-year real yield above its 2.94% peak [T1], the dollar index extends its 19-month high, and EUR gold breaks below the 30-day low of 3,363.87 toward levels implied by the 200-day decline of -19.21%. Central bank dip-buying [T1] acts as a partial offset, not a full stop.
Methodological reference: WisdomTree’s earlier gold outlook constructed its bull case on a Fed pivot with faster cuts and dollar depreciation, and its bear case on a policy error with rising yields and dollar appreciation [T2]. We use this only as a scenario template; its price levels are stale and must not be applied to current conditions. As a dated source view, [T1] reported that more Fed hikes were expected at the time of its writing; this is a source expectation, not a decision and not a current market reading.
Valuation Discussion
Gold does not lend itself to equity-style valuation, so we assess it against its own history, the real-yield relationship, and its January 2026 peak.
Against its own history: at 3,395.02, XAU/EUR is 27.59% below the January 2026 ATH of 4,688.32 and 168.32% above the November 2019 ATL of 1,265.28. The 200-day decline of -19.21% confirms a drawdown regime rather than a routine pullback.
Against real yields: according to [T1], the last time real yields were near current levels (2.84%), gold traded around $800/oz; today it trades nearly five times that. By the historical real-yield rule, gold should have fallen much further than it has. This means the market prices a structural premium, and the historical relationship would imply substantial downside if it reasserted. We label that a bear-case valuation anchor, not a forecast. Conversely, the premium has persisted throughout the current cycle because the marginal buyer, the official sector, does not respond to real yields [T1].
Against the policy regime: the 2024 to Q1 2026 dovish regime took gold from roughly $2,000/oz to above $5,000/oz, and the current drawdown of roughly 28.5% from the record mirrors the hawkish turn [T8]. Valuation is therefore regime-dependent rather than anchored to real yields alone. The relevant question is whether the regime reverts.
Against reserve demand: with gold at 29% of global allocated reserves (Q1 2026, IMF COFER) and emerging market central banks at only 15% average allocation versus 30% for developed markets [T7], the marginal official-sector buyer remains a credible valuation floor argument.
Currency decomposition: the 1-year EUR return of -8.41% embeds a currency effect. Using the EUR/USD YTD move of -6.43% as an imperfect proxy (the windows differ: 1-year versus year-to-date), the underlying USD-gold component of the 1-year EUR decline is estimated at roughly -2% on a simple additive approximation. This is an estimate with known limitations and should be treated as indicative only.
Flow context: the 85 tonnes/month central bank pace [T4] annualizes to roughly 1,020 tonnes, versus 675 tonnes purchased year-to-date [T1] and an official-sector stock of roughly 38,600 tonnes [T7]. Current buying therefore represents about 2.6% of official holdings annually, meaningful but not destabilizing.
Risks
- Policy risk: both the Fed (3.75% to 4.00%) and ECB (2.50%) delivered 25 bp hikes in September 2026. As a dated source view, [T1] reported expectations of more Fed hikes, and the October CPI beat of 0.4% m/m with services inflation near a 5% annual pace supports continued hawkish risk.
- Real yield risk: the 10-year real yield at 2.84% is near its highest since November 2008 [T1]. A new high above the 2.94% peak is a direct headwind.
- Dollar risk: the US dollar index at a roughly 19-month high pressures USD gold [T1]. For EUR holders, a euro reversal higher would remove the FX cushion that has supported EUR-quoted returns (EUR/USD -6.43% YTD).
- Flow risk: US investors pulled roughly $1.8bn from the largest gold fund in October [T1]. If Western ETF outflows accelerate beyond what central bank buying absorbs, the price floor weakens.
- Central bank concentration risk: the structural bid depends on a small number of price-insensitive buyers. Goldman notes China was the largest identifiable buyer at roughly 25 tonnes in August [T4], so a pause in Chinese buying is a key vulnerability.
- Rates and energy volatility risk: SSGA flags that elevated US rates and crude oil implied volatility through the winter could keep the macro environment impactful for gold prices [T8].
- Data-quality risk: no current BTC/ETH prices exist in the bundle. Sources [T1], [T2], [T6], and [T8] lack publication dates. [T2] is a 2023-24 era outlook and must not be used for current levels.
Scenario (tightening overshoot): a repeat of the bear-case template in [T2], a policy error with rising yields and dollar appreciation, would extend the -19.21% 200-day decline. This is a scenario, not an expectation. Scenario (flow reversal): if central bank purchases slow from the 85 tonnes/month pace [T4] while ETF outflows persist [T1], the structural floor argument inverts into two-sided selling risk.
Appendix
Data provenance. Market data retrieved 2026-11-19T05:20:05Z. XAU is quoted in EUR via the PAX Gold proxy (tokenized gold, market cap approximately EUR 1.52bn, rank 48, 24h volume approximately EUR 127m), not the physical gold market; pricing may deviate modestly from spot physical gold. Policy rates: Fed funds target range 3.75% to 4.00% (FRED, as of 2026-11-18) and ECB deposit facility rate 2.50% (ECB key rate, as of 2026-11-19) are the only authoritative policy rate levels in this report. Yield curve: ECB AAA euro area curve as of 2026-11-17 (2Y 3.09%, 5Y 3.16%, 10Y 3.42%, 30Y 3.68%; 10Y-2Y spread 33.2 bp). FX: Frankfurter FX as of 2026-11-19 (EUR/USD 1.0994, EUR/CHF 0.9243, EUR/JPY 175.23, EUR/GBP 0.8336).
Source dating caveats. [T4] is dated October 2026 (Fortune). [T5] references a WGC report published on 3 November. [T1], [T2], [T6], and [T8] lack publication dates and are cited with “according to source” framing; their figures must not be read as current market state. [T3] is background on monetary policy history only.
Explicit data gaps. No current BTC or ETH prices, returns, or market caps. No euro-area inflation print or inflation expectations, which prevents computing a euro area real yield. No US CPI print in the bundle itself; CPI figures come from [T1] only. No central bank forward guidance beyond the Policy Rates block. The ECB deposit rate and Fed target range are the only policy levels stated; any other central bank’s rate is not in the dataset.
Sources
- [T1] Why Central Bank Buying Is Keeping Gold Afloat as More Fed Hikes Are Expected (Interactive Brokers)
- [T2] Gold Outlook to Q2 2024 (WisdomTree Onchain)
- [T3] Monetary policy (Britannica Money)
- [T4] Goldman Sachs: Central banks increase gold demand and diversify storage for reserve security (Fortune, October 2026)
- [T5] Central banks buy gold at fastest pace in two years, WGC (Central Banking)
- [T6] Why Central Banks Are Bringing Gold Home (Global Coin)
- [T7] Gold Market Primer: Market size and structure (World Gold Council)
- [T8] Monthly Gold Monitor (State Street Global Advisors)
Disclaimer: This report is AI-generated, for informational purposes only, and does not constitute investment advice. Figures are drawn from the cited dataset and sources as of the retrieval dates shown; readers should verify current market data before making any investment decision.
Important Note / Wichtiger Hinweis:
EN: This report may have been generated using AI. It processes data from publicly available sources. The content is provided for informational purposes only.DE: Dieser Bericht kann mithilfe von KI erstellt worden sein. Dabei werden Daten aus öffentlich zugänglichen Quellen verarbeitet. Die Inhalte dienen ausschließlich Informationszwecken.
* DE: Die ergänzenden Inhalte können KI-generiert sein. EN: The additional content may be AI-generated.