
Watch the video
This player shows only the Gold chapter of the daily altii market briefing. Watch the full video on tube.altii.de.
Key Data Snapshot
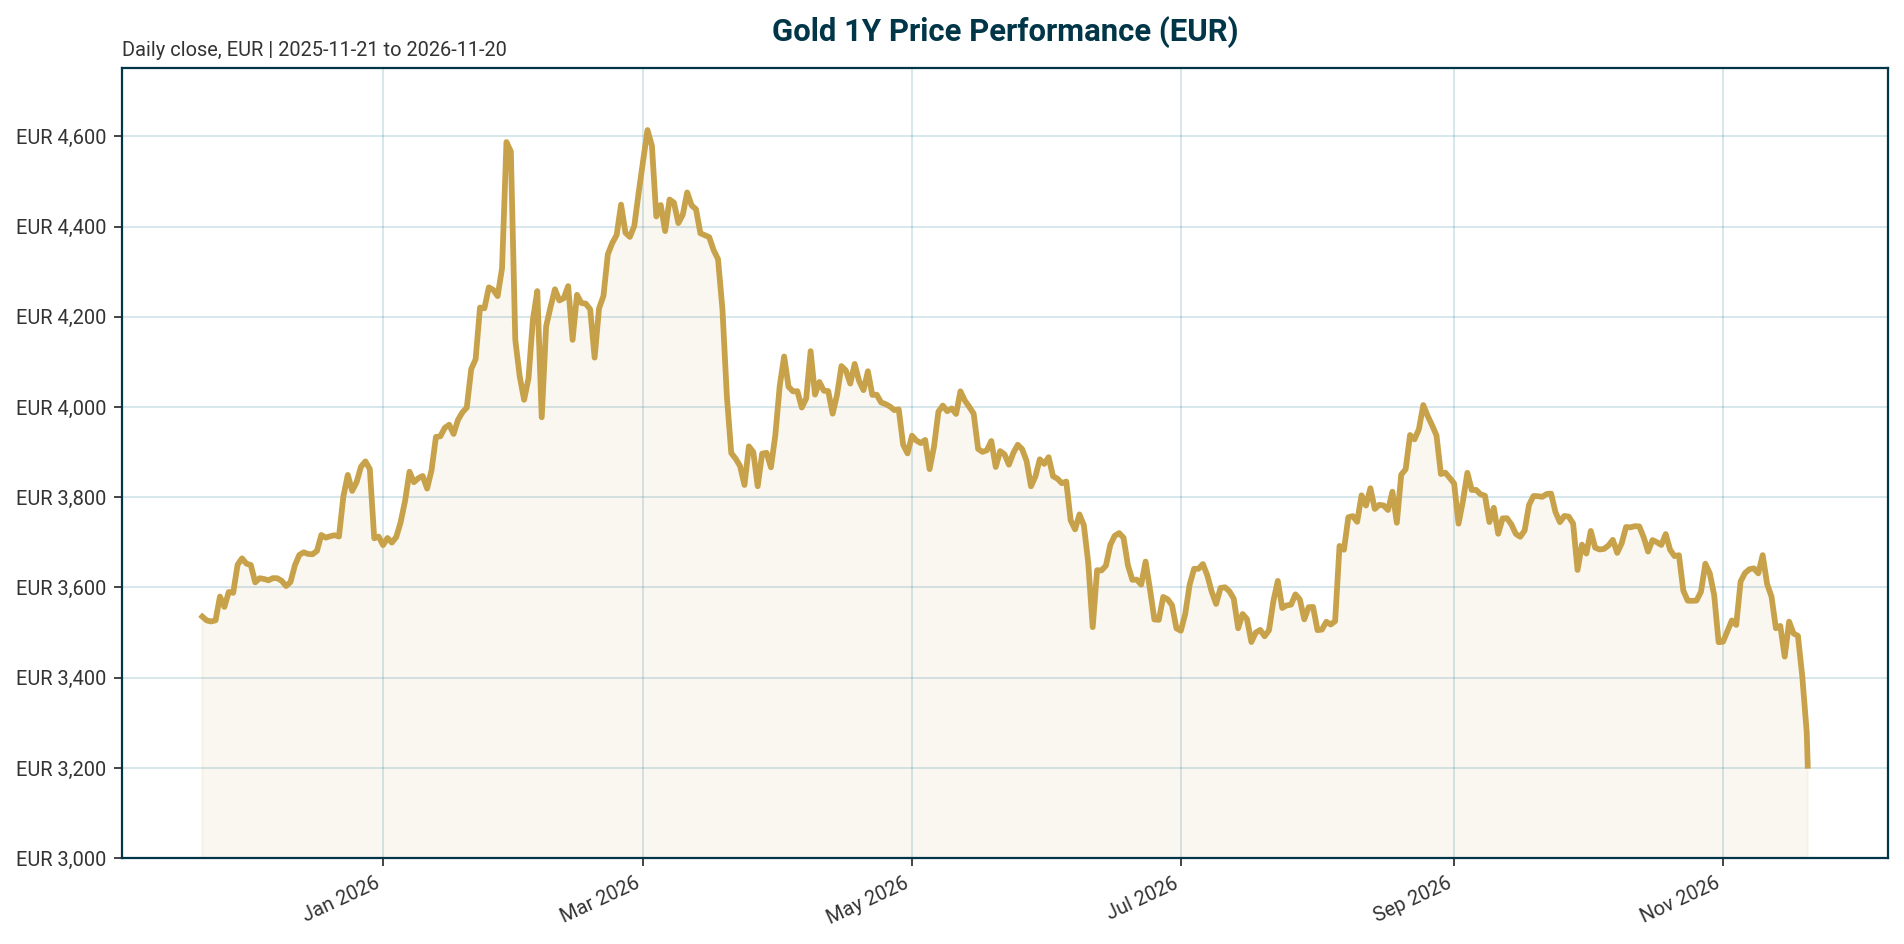
| Metric | Value | Note |
|---|---|---|
| XAU price (EUR) | EUR 3,202.04 | As of 2026-11-20 05:20 UTC |
| 24h change | -5.77% | 24h range EUR 3,201.33 to EUR 3,399.00; price sits at the low end |
| 7d / 14d / 30d change | -9.81% / -12.58% / -14.40% | Sustained tactical downtrend |
| 200d / 1y change | -23.41% / -13.12% | Deep drawdown on longer horizons |
| All-time high (EUR) | EUR 4,688.32 (2026-01-28) | Current price -31.70% below ATH. Calculation: 3,202.04 / 4,688.32 – 1 = -31.70% |
| All-time low (EUR) | EUR 1,265.28 (2019-11-17) | Current price +153.07% above ATL. Calculation: 3,202.04 / 1,265.28 – 1 = +153.07% |
| Market cap / 24h volume (EUR) | EUR 1.43bn / EUR 192.5m | PAXG-token proxy series, rank 50 |
| Fed funds target range | 3.75% to 4.00% | As of 2026-11-19; last change: hike of 25 bp, effective 2026-09-17 |
| ECB deposit facility rate | 2.50% | As of 2026-11-20; last change: hike of 25 bp, effective 2026-09-16 |
| Euro area AAA 10Y yield | 3.41% | +4.3 bp over 5 days, +46.23 bp YTD; 10Y-2Y spread 32.4 bp |
| EUR/USD | 1.0983 | -0.46% over 5 days, -6.53% YTD |
Macro Backdrop
Market overview: Risk sentiment is negative and equity momentum is broadly negative, with DACH indices broadly in line with global peers. The DAX sits at 25,463.81 (-4.81% over 5 days) while the S&P 500 is down 5.10% and the Nasdaq Composite 5.00% over the same window; the Hang Seng is the weakest at -5.94%. The rates backdrop is mixed: the euro area AAA 10Y yield stands at 3.41% after a 4.3 bp five-day rise, and the 2Y is up 97.75 bp YTD, signalling a firming euro-rate regime. FX is mixed, with EUR/USD at 1.0983 (-0.46% over 5 days, -2.21% over 1 month). This combination of falling equities, rising euro yields and a stabilising euro is tactically unfavourable for a non-yielding asset quoted in EUR.
The dominant macro driver for gold in 2026 is the return of the real-yield channel. The US Federal Funds Target Range stands at 3.75% to 4.00% as of 2026-11-19, following a 25 bp hike effective 2026-09-17, and the ECB Deposit Facility Rate stands at 2.50% as of 2026-11-20, following a 25 bp hike effective 2026-09-16. According to [T1], the Fed’s return to rate rises from September 2026 and the subsequent climb in real yields reasserted control over the gold price after the correlation had broken down between 2022 and 2025 on heavy central bank reserve buying. The same source dates the USD-quoted drawdown at roughly 31%, from about USD 5,595/oz on 29 January 2026 to about USD 3,870/oz on 30 October 2026, despite elevated inflation and Middle East supply disruptions. Note that euro-area inflation expectations are not in the dataset, so a current euro-area real yield level cannot be computed here; only the nominal euro AAA 10Y of 3.41% is available.
Investment Thesis
The thesis has two layers that currently pull in opposite directions. The cyclical layer is a real-yield headwind: with the Fed funds target range at 3.75% to 4.00% and the ECB deposit facility rate at 2.50% after the September 2026 hikes, the opportunity cost of holding a non-yielding asset has risen sharply, and [T1] documents that this channel is again the primary pricing mechanism. The structural layer is reserve diversification: gold is increasingly treated as a neutral reserve asset with no counterparty or confiscation risk as US dollar reserves face growing political risks, and the long-term upward trend remains intact as long as global excess savings persist [T2].
The flow evidence supports the structural layer. The World Gold Council reported net central bank purchases of 321 tonnes in Q3 2026, the fastest pace since late 2024 and a 46% rise year on year, with year-to-date purchases 6% above last year [T4][T8]. Goldman Sachs estimated 79 tonnes of central bank purchases in August alone, more than four times the pre-2022 monthly average of 17 tonnes, with a three-month seasonally adjusted run rate of 85 tonnes per month and China the largest identifiable buyer at roughly 25 tonnes in August [T3]. The ratio of the current run rate to the pre-2022 average is approximately 5x (85 / 17). At the reserve level, central banks held about 38,600 tonnes of gold at end-2025, worth roughly USD 5 trillion, and gold reached 29% of total global allocated reserves by Q1 2026 per IMF COFER data, second only to the US dollar [T5].
The interpretation for positioning: the 2026 correction is a rates-led cyclical event inside an intact structural uptrend. The tactical risk is that the cyclical channel dominates for several more quarters if tightening continues. The structural case is that a buyer base operating at roughly 85 tonnes per month, insensitive to real yields, keeps absorbing supply and raises the floor under the market even during corrections.
Bullish Drivers
- Accelerating central bank demand. Net 321 tonnes in Q3 2026, +46% year on year, the fastest pace since late 2024 [T4][T8]. Goldman’s August estimate of 79 tonnes versus a 17-tonne pre-2022 average, and an 85 tonnes-per-month adjusted run rate, quantify the acceleration [T3].
- Forward intent from reserve managers. A record 45% of respondents to the WGC’s June 2026 Central Bank Gold Reserves Survey expected to increase gold holdings over the next year, citing store of value, diversification and geopolitical hedging [T7].
- Reserve security behaviour. In Goldman’s August survey, 12% of central banks declined to confirm where their gold is stored in 2026 (up from 10%), 10% diversified overseas storage (up from 2%), and 9% increased domestic storage (up from 5%). The debate for developed-market central banks has shifted from volume to storage location, reflecting concerns around reserve security and cross-country trust [T3].
- Structural demand base. SSGA lists five supports: record global government debt loads, demand for liquid diversifiers with historically elevated stock/bond correlations, central bank demand +6% year on year in 2026, record China retail buying +67% year on year in 2026, and elevated macro policy uncertainty [T6].
- Fiscal and financial-repression dynamics. According to [T7] from November 2026, US Treasury Secretary Bessent ordered a Treasury buyback programme that purchased USD 6 billion in September alone to ease upward pressure on long-term yields. If policymakers implicitly choose to inflate away debt burdens, gold’s store-of-value appeal strengthens.
- Supply and flow tailwinds. ETF flows have returned and mine-driven supply is slow to respond [T7]. Per [T2], if the US moves from indirect signalling to direct capital-flow measures restricting foreign reserve hoarding, the incentive to move into gold intensifies.
Relative Positioning vs Bitcoin and Ethereum
The bundle provides crypto aggregates but no Ethereum price data; ETH-specific levels are unavailable. Bitcoin dominance stands at 58.03% and total crypto market capitalisation at USD 1,938.98bn with USD 73.25bn in 24h volume. A direct market-cap comparison with the EUR-quoted gold series is a category error: the EUR 1.43bn figure is the PAXG token proxy, not the gold market, which central banks alone hold to the value of roughly USD 5 trillion [T5].
The relevant comparison is behavioural. Gold is not immune to the current de-risking cycle: it is down 5.77% in 24h and 31.70% from its EUR all-time high, confirming [T2]’s point that over shorter periods gold moves with the global growth cycle in ways that confuse investors still using the old real-rate map. The distinction lies in the demand base. Per [T6], gold held up through both hawkish and dovish Fed regimes, first supported by buyers less tied to real rates (central banks, retail bar and coin demand outside the US), then led by ETF investors. Crypto assets lack an equivalent price-insensitive institutional bid of this scale. Scenario framing: in a prolonged risk-off regime, the central-bank-anchored demand base should limit gold’s drawdowns relative to crypto, though the current 31.70% EUR drawdown shows the floor is not immediate. If reserve diversification accelerates, gold competes more directly with Bitcoin’s digital-gold narrative than with Ethereum’s utility profile.
Scenario Framework
All scenarios are assumptions, not forecasts. The authoritative anchors are the US Federal Funds Target Range of 3.75% to 4.00% (as of 2026-11-19) and the ECB Deposit Facility Rate of 2.50% (as of 2026-11-20), both set by 25 bp hikes effective mid-September 2026. No dated market expectation of future Fed or ECB rate moves exists in the dataset.
- Bearish (hawkish continuation). Assumption: further Fed or ECB tightening beyond the current Fed funds target range of 3.75% to 4.00% and the ECB deposit facility rate of 2.50% keeps real yields rising. Per [T1], when central banks hold rates high for long, the opportunity cost of gold becomes more expensive. Gold extends its correction toward or below the late-October USD lows of about USD 3,870/oz [T1], with EUR/USD direction a key swing factor for the EUR quote.
- Base (stabilisation). Assumption: policy rates hold at current levels — the Fed funds target range at 3.75% to 4.00% and the ECB deposit facility rate at 2.50%. Central bank buying near 85 tonnes per month [T3] and returning ETF flows [T7] stabilise the price while the structural thesis rebuilds. SSGA’s dated 12-month base case range of USD 4,500 to 5,250/oz (a 60% probability band, per [T6] from its Monthly Gold Monitor) sits well above spot, implying the market is pricing a meaningful probability of further downside before any recovery toward that range.
- Bullish (dovish pivot or fiscal repression). Assumption: a policy pivot or fiscal-driven yield suppression, via the Treasury buyback mechanism described in [T7], pulls real yields lower. Gold historically performs well when nominal yields are pulled below inflation and purchasing-power concerns rise. In this scenario gold re-rates toward SSGA’s dated USD 4,500 to 5,250/oz base case range [T6].
Valuation Discussion
Gold has no cash flows, so traditional valuation metrics do not apply. The relevant anchors are drawdown position, opportunity cost, and reserve-share context. On drawdown: XAU-EUR at EUR 3,202.04 is 31.70% below its January 2026 ATH of EUR 4,688.32 and 153.07% above its 2019 ATL of EUR 1,265.28. On opportunity cost: with the Fed funds target range at 3.75% to 4.00%, the ECB deposit facility rate at 2.50%, and the euro area AAA 10Y at 3.41% in nominal terms, the yield foregone by holding gold is elevated. A real-yield level cannot be stated because euro-area and US inflation expectations are not in the dataset.
On reserve-share context: gold at 29% of global allocated reserves in Q1 2026 [T5] sits alongside emerging market central banks holding only about 15% of reserves in gold on average, versus 30% for developed markets. If EM allocations converge even partially toward developed-market averages, structural demand has a multi-year runway. On third-party views: SSGA’s 12-month base case range of USD 4,500 to 5,250/oz [T6] and GAM’s framing of the weakness to around USD 3,900/oz by end-October as potentially an opportunity rather than a warning [T7] are dated market expectations, not this report’s forecasts. Net assessment: on opportunity-cost grounds gold is tactically unattractive; on structural reserve-flow grounds the multi-year case is intact and the current drawdown improves the entry mathematics for long-horizon allocators.
Risks
- Further policy tightening. With the Fed funds target range at 3.75% to 4.00% and the ECB deposit facility rate at 2.50% after the September 2026 hikes, room remains for additional hikes, which would extend the real-yield headwind that [T1] identifies as the operative pricing mechanism in 2026. No future rate decision exists in the dataset; any expectation of one must come from a dated source.
- Currency drag. EUR/USD at 1.0983 is down 6.53% YTD. A reversal toward euro strength would mechanically depress the EUR-quoted price even if USD gold is flat.
- Weakening conventional demand. Per [T8], jewelry demand slumped even as central bank buying surged, removing a traditional demand pillar.
- Volatility transmission. Per [T6], if US rates and crude oil implied volatility remain elevated through the winter, the broader macro environment could stay impactful for gold prices, particularly through evolving Fed pricing and liquidity-sleeve cash raising.
- Reversal of central bank buying. A recovery in USD confidence or a resolution of reserve-security concerns would remove the structural floor that has absorbed the 2026 correction.
- Proxy and liquidity risk. The EUR-quoted series tracks the PAXG token (market cap EUR 1.43bn, rank 50), not physical spot. Token-level premium or discount and thin liquidity may distort short-term moves, including the -5.77% 24h print, which closed near the 24h low of EUR 3,201.33.
Appendix
Methodology and data notes. The EUR-quoted price series derives from the PAXG token (coingecko_id pax-gold) and is used as a proxy for gold in EUR; it is not identical to physical XAU/EUR spot. USD-quoted figures from news sources, such as the roughly USD 5,595/oz ATH on 29 January 2026 and the roughly USD 3,870/oz low on 30 October 2026 cited in [T1], and the roughly USD 3,900/oz end-October level in [T7], are not directly comparable to the EUR series. [T1] dates the USD drawdown at about 31% while [T6] cites roughly 28.5% from the record; both are quoted with their own sources rather than blended. Market data was retrieved 2026-11-20T05:20:20Z; equity, rates and FX data are as of 2026-11-18 to 2026-11-20 depending on source. The WGC Q3 2026 report was published on 3 November 2026 [T4]; the Goldman note was reported by Fortune on 22 October 2026 [T3]; the GAM commentary is dated 18 November 2026 [T7]. All forward-looking price ranges, including SSGA’s USD 4,500 to 5,250/oz band, are dated third-party market expectations and not forecasts of this report.
Authoritative policy rates.
- US Federal Funds Target Range: 3.75% to 4.00%, as of 2026-11-19; last change: hike of 25 bp, effective 2026-09-17.
- ECB Deposit Facility Rate: 2.50%, as of 2026-11-20; last change: hike of 25 bp, effective 2026-09-16.
Sources
- [T1] GIẢI MÃ NGHỊ LÝ GIÁ VÀNG VÀ CÁCH THẾ HỆ NHÀ ĐẦU TƯ TRẺ XÂY DỰNG TÀI SẢN
- [T2] Gold and the End of the US Dollar Standard, In Gold We Trust Nugget 2026
- [T3] Goldman Sachs: Central banks increase gold demand and diversify storage for reserve security, Fortune, 22 October 2026
- [T4] Central banks buy gold at fastest pace in two years, WGC, Central Banking, 3 November 2026
- [T5] Gold Market Primer: Market size and structure, World Gold Council
- [T6] Monthly Gold Monitor, State Street Global Advisors
- [T7] Golden Moment? Why the quintessential precious metal could be worth its weight in portfolios, GAM, 18 November 2026
- [T8] Central Bank Gold Buying Surges as Jewelry Demand Slumps, WSJ
Disclaimer. This report is AI-generated and provided for informational purposes only. It does not constitute investment advice, a recommendation, or an offer to buy or sell any financial instrument. Figures should be independently verified before any use in decision-making.
Important Note / Wichtiger Hinweis:
EN: This report may have been generated using AI. It processes data from publicly available sources. The content is provided for informational purposes only.DE: Dieser Bericht kann mithilfe von KI erstellt worden sein. Dabei werden Daten aus öffentlich zugänglichen Quellen verarbeitet. Die Inhalte dienen ausschließlich Informationszwecken.
* DE: Die ergänzenden Inhalte können KI-generiert sein. EN: The additional content may be AI-generated.