
Watch the video
This player shows only the Gold chapter of the daily altii market briefing. Watch the full video on tube.altii.de.
Key Data Snapshot
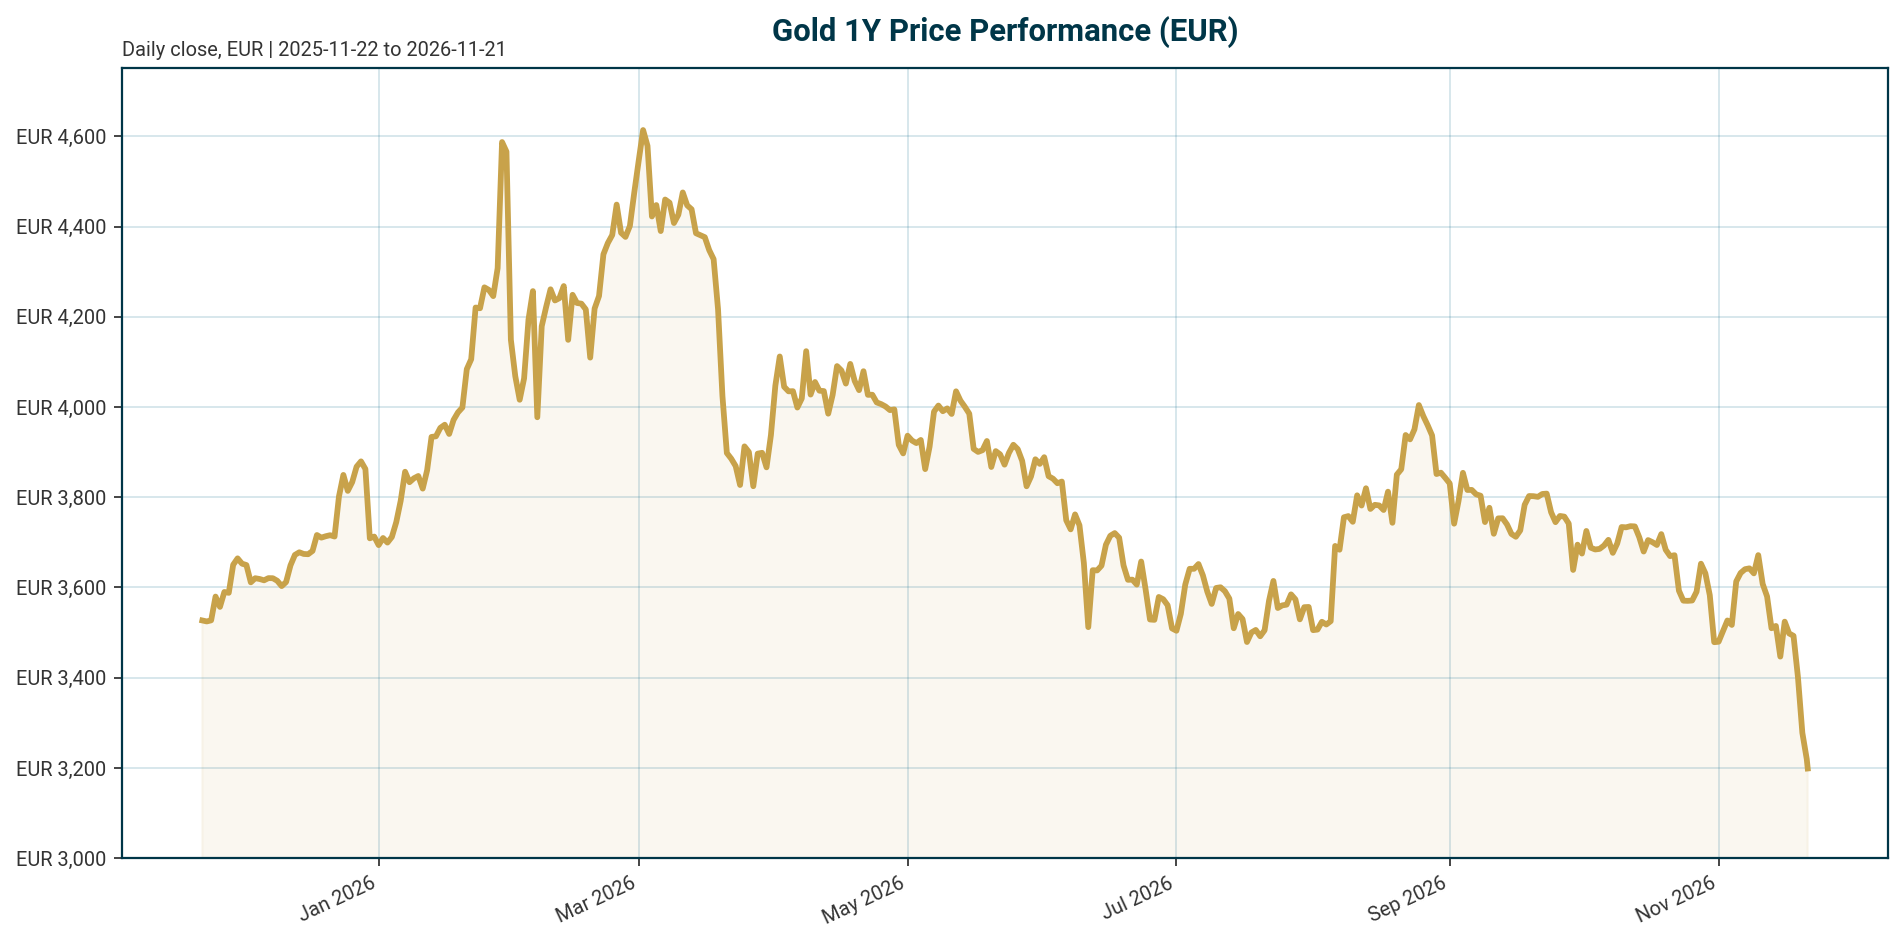
Gold (XAU) trades at EUR 3,199.71 as of 21 November 2026, in a deep correction phase. The table below summarises the current market state and the authoritative policy rate levels.
| Metric | Value | Note |
|---|---|---|
| XAU/EUR price | EUR 3,199.71 | 24h range EUR 3,186.36 to EUR 3,269.10 |
| 24h / 7d change | -0.09% / -9.06% | 14d: -13.67% |
| 30d / 200d change | -14.29% / -22.49% | 1y: -13.25% |
| All-time high (EUR) | EUR 4,688.32 | 28 Jan 2026; drawdown -31.75% |
| All-time low (EUR) | EUR 1,265.28 | 17 Nov 2019; +152.88% above |
| Fed funds target range | 3.75% to 4.00% | As of 2026-11-20; last change: hike of 25 bp, effective 2026-09-17 |
| ECB deposit facility rate | 2.50% | As of 2026-11-21; last change: hike of 25 bp, effective 2026-09-16 |
| Euro area AAA 10Y yield | 3.44% | +3.0 bp over 5 days, +49.3 bp YTD |
| Euro area AAA 2Y yield | 3.13% | +101.7 bp YTD |
| Euro area 10Y-2Y spread | 31.6 bp | 3.4415% minus 3.1251% |
| EUR/USD | 1.0988 | -6.49% YTD, -2.21% over 1 month |
| Token proxy market cap | USD 1.43bn | PAXG-linked proxy, rank 47; 24h volume USD 191.18m |
Drawdown calculation: (3,199.71 – 4,688.32) / 4,688.32 = -31.75%. Upside from ATL: (3,199.71 – 1,265.28) / 1,265.28 = +152.88%. The implied XAU/USD from the bundle is approximately 3,199.71 x 1.0988 = USD 3,516/oz, which conflicts with the ~USD 4,010/oz figure cited in one news source [T4]. We flag this as a probable timing mismatch or proxy deviation and do not reconcile the two figures.
Macro Backdrop
Market overview: Risk sentiment is negative and equity momentum is broadly negative, with DACH indicators broadly in line with global peers. Euro area yields are mixed: the AAA 10Y yield stands at 3.44%, up 3.0 bp over 5 days, and the 10Y-2Y spread sits at 31.6 bp. The FX backdrop is mixed, with EUR/USD at 1.0988 (-0.15% over 5 days) and EUR/GBP posting the strongest 5-day FX move at +0.33%. Key observations: the Nasdaq Composite is the weakest 5-day performer at -7.72%, the Nikkei 225 fell 5.41% over 5 days, the S&P 500 lost 6.83% over 5 days and 10.92% over 1 month, and the DAX fell 6.75% over 5 days while leading on a 1-month basis at -3.28%. DACH indicators average -6.59% over 5 days versus -6.40% for global equity indicators. This overview is context; the gold analysis below takes precedence.
For gold specifically, the policy backdrop is restrictive on both sides of the Atlantic. The Federal Reserve funds target stands at 3.75% to 4.00% after a 25 bp hike effective 2026-09-17, and the ECB deposit facility rate is 2.50% after a 25 bp hike effective 2026-09-16. No further changes appear in the dataset, so the working assumption is an extended hold at restrictive levels. According to a Substack analysis [T4] from November 2026 context, the 10-year Treasury yields around 5% with real yields near 2.6%, and Fed Chair Kevin Warsh has signalled more tightening, arguing the Fed’s own projection of inflation returning to 2% only in 2029 is too slow. This is a single-source claim and should be treated as such. According to StoneX and Forex.com analyses from 28 October 2026 [T2][T3], higher oil prices risk keeping inflation elevated, which could force central banks to hold policy restrictive for longer, keeping bond yields attractive and raising the opportunity cost of holding a non-yielding asset.
Notably, negative equity sentiment has not triggered safe-haven flows into gold. The metal is down 9.06% over 5 days while equities fell sharply, signalling that real-yield pressure, not risk-off demand, currently dominates gold’s price formation. Euro area HICP inflation is not in the dataset, so EUR-denominated real yields cannot be computed; only USD real yields (approximately 2.6% per [T4], a dated news figure) are available from sources.
Investment Thesis
The core tension for gold in late 2026 is a tug-of-war between tactical headwinds and structural tailwinds. Tactically, restrictive policy rates (Fed 3.75% to 4.00%, ECB 2.50%), elevated real yields and firm dollar conditions have driven a -31.75% drawdown from the January 2026 high. Structurally, record central bank accumulation and the sovereignty-asset narrative provide a price-insensitive bid beneath the market.
Real yields are the single most important near-term swing factor for gold, as the metal generates no yield and higher real rates raise its opportunity cost [T1]. With real yields near 2.6% per the November 2026 context in [T4], the tactical math is unfavourable. The structural side is stronger: the World Gold Council reported net official-sector purchases of 321 tonnes in Q3 2026, up 46% year-on-year and the fastest pace since late 2024, according to a report published 3 November 2026 [T8]. Goldman Sachs estimated central banks purchased 79 tonnes in August alone, more than four times the pre-2022 monthly average of 17 tonnes, with a three-month seasonally adjusted run-rate of 85 tonnes per month, according to a Fortune article from 22 October 2026 [T7].
For EUR-based investors, the euro’s weakness (EUR/USD at 1.0988, -6.49% YTD) partially cushions USD-denominated gold drawdowns, but has not prevented a -22.49% decline over 200 days in EUR terms. Our assessment: gold in EUR terms is tactically pressured but structurally supported. The EUR 3,200 area is a potential accumulation zone for long-horizon investors who weight the sovereignty-asset thesis heavily, while tactically oriented investors should respect the downtrend until real yields roll over.
Bullish Drivers
- Record central bank demand: Net purchases of 321 tonnes in Q3 2026, up 46% year-on-year, the fastest pace since late 2024 [T8]. Goldman Sachs put the three-month seasonally adjusted run-rate at 85 tonnes per month, roughly 5.0x the pre-2022 average of 17 tonnes per month [T7].
- China demand: The People’s Bank of China has bought gold for 23 consecutive months, China imported a record 1,141 tonnes for consumers in the first eight months of 2026, and Shanghai is building a parallel pricing hub, according to [T4] (undated, November 2026 context).
- Reserve security and storage diversification: In an August 2026 Goldman survey, 12% of central banks declined to confirm their gold storage location (versus 10% the prior year), 10% diversified overseas storage in 2026 (versus 2% the year prior), and 9% plan further diversification over the next 12 months [T7].
- China underweight: Goldman argues China remains underweight gold relative to plausible long-term allocations, and the motivations for diversifying away from G7 reserve currencies are likely to remain in place [T7].
- US fiscal dominance: US federal debt has passed USD 40 trillion with net interest costs around 3% of GDP, matching post-war highs; gold is framed as the market’s verdict on how that ends [T4].
- Dollar direction: A grinding USD downtrend is a key bullish catalyst [T1]. EUR/USD at 1.0988 currently implies USD firmness, but a reversal would support gold in both USD and EUR terms.
- Limited financial ownership: Limited financial ownership of gold remains a structural tailwind, per [T1], leaving room for returning investor demand.
Bull scenario: if the Fed pivots to cuts from the 3.75% to 4.00% range (a market expectation or scenario assumption, not a decision in the dataset) and real yields fall from the ~2.6% area, the structural central bank floor plus returning financial demand could drive a recovery toward the January 2026 highs.
Relative Positioning vs Bitcoin and Ethereum
The bundle lists ethereum as the benchmark crypto asset, but current ethereum and bitcoin price levels are not in the dataset, so the comparison is necessarily qualitative on performance. What the data does show: bitcoin dominance stands at 57.34%, total crypto market capitalisation at USD 1.79 trillion, and total crypto 24h volume at USD 117.18 billion. The gold proxy token (PAXG-linked) shows a market cap of USD 1.43 billion and 24h volume of USD 191.18 million, which reflects the token, not the physical gold market.
Structurally, gold and crypto compete for the same debasement-hedge capital, but they occupy different points on the risk spectrum. Gold has a multi-century monetary track record, central bank demand at 4 to 5 times pre-2022 norms [T7], and a volatility profile far below crypto’s. Crypto carries zero coupon like gold but with substantially higher volatility and no official-sector bid. In the current risk-off environment (Nasdaq -7.72% over 5 days), crypto typically draws more pressure than gold; if the crypto complex underperforms during this drawdown, gold’s relative defensive positioning improves. Conversely, if the Fed pivots from the 3.75% to 4.00% range, crypto would likely benefit more in percentage terms while gold benefits via falling real yields. Relative 200-day performance between gold and crypto cannot be stated from the dataset; ethereum price data is unavailable.
Scenario Framework
All forward rate paths below are scenario assumptions or market expectations, not decisions. The dataset records no policy changes after the September 2026 hikes.
- Bull case (probability-weighted upside): The Fed signals or executes cuts from the 3.75% to 4.00% range, real yields fall below ~2%, and the USD downtrend described as the key bullish catalyst in [T1] materialises. Central bank flows accelerate on dip-buying, consistent with the pattern noted in [T4]. Gold recovers toward EUR 3,800 to 4,200. Trigger to watch: dovish Fed communication and a break above the USD 4,075 to 4,106 resistance zone cited on 28 October 2026 [T2][T3], indicatively roughly EUR 4,476 to 4,510 at the current EUR/USD rate of 1.0988.
- Base case: Both central banks hold at current restrictive levels. Real yields stay near 2.6% (per the dated [T4] figure). Central bank buying at roughly 85 tonnes per month [T7] provides a floor. Gold consolidates in a EUR 3,000 to 3,400 range, with downside risk if the USD 4,000/oz support referenced in [T2][T3] breaks decisively.
- Bear case: Oil-driven inflation forces additional hikes or extended holds [T2][T3], real yields rise further, and the AI-driven productivity narrative sustains higher real yields for good reasons, the mechanism that ended previous gold bull markets [T4]. Gold breaks below EUR 3,000 and targets a deeper drawdown toward EUR 2,700 to 2,800 despite official-sector demand.
Valuation Discussion
Gold has no cash flows, so valuation rests on relative anchors. At EUR 3,199.71, the metal trades 31.75% below its January 2026 ATH of EUR 4,688.32 and 152.88% above its 2019 ATL of EUR 1,265.28. Buyers from the January 2026 euphoria are underwater, per [T4], which referenced USD prices around USD 4,010/oz, roughly 26% below the 29 January record (dated news figure; see the implied XAU/USD discrepancy in the Key Data Snapshot).
The opportunity-cost anchor is demanding. Real yields near 2.6% ([T4], dated figure) sit above the ~2.5% zone where gold valuations historically compress. On this framework, gold remains expensive relative to a discounted-yield fair-value approach and could justify further de-rating if real yields hold or rise. Against this, central bank demand at 4.6x to 5.0x the pre-2022 monthly average (79 tonnes in August versus 17 tonnes, per [T7]) represents a price-insensitive bid that distorts traditional valuation signals; the marginal buyer is not yield-sensitive.
Cross-currency valuation matters for this report’s audience. EUR/USD at 1.0988 (-6.49% YTD) means EUR-denominated gold has held up better than USD gold on a year-to-date basis. Our balanced read: gold in EUR terms screens as tactically oversold after a -22.49% 200-day decline, but structurally fairly valued relative to the sovereignty-asset demand base. It is cheap versus its January highs, not cheap versus its macro inputs.
Risks
- Policy risk (downside): Further Fed hikes beyond 4.00%. [T4] reports Chair Warsh signalling more tightening and viewing the Fed’s 2%-by-2029 inflation projection as too slow; this is a single Substack source, not verified Fed communication.
- Real yield risk (downside): Sustained real yields near 2.6% ([T4], dated figure) keep opportunity cost elevated. Oil-driven inflation could extend restrictiveness per the 28 October 2026 analyses [T2][T3].
- AI productivity risk (downside): A genuine AI-driven productivity boom sustaining higher real yields for good reasons ended previous gold bull markets and is arguably the strongest structural bear case [T4].
- Flow risk (downside): Central bank buying could slow. Goldman notes China is not buying at an alarming rate and domestic-market central banks have largely been on the sidelines [T7].
- FX risk (two-sided): A renewed USD rally would pressure XAU/EUR even if USD gold stabilises; conversely, EUR strength would amplify EUR-term losses.
- Data risk: Key news figures (real yields, Treasury yields, USD gold price) come from undated or partially dated items and may be stale relative to the 21 November 2026 dataset. The implied XAU/USD of roughly USD 3,516 from the bundle conflicts with the ~USD 4,010/oz in [T4]. We present both with provenance and draw no conclusion from the gap.
- Upside risk (to shorts): A geopolitical or fiscal event triggering a sovereignty-asset bid could overwhelm the rates-driven bear case rapidly, given the structural demand base documented in [T7][T8].
Appendix
Methodology and Data Provenance
Market data retrieved 2026-11-21T05:19:57Z. Market overview as of 2026-11-20/21. Policy rates as of 2026-11-20 (Fed, sourced from FRED) and 2026-11-21 (ECB, sourced from ECB key rate). Euro area yields from the ECB yield curve, FX from Frankfurter, and equities from STOXX, Wiener Boerse and FMP. The XAU/EUR instrument uses pax-gold (coingecko_id: pax-gold) as the proxy, with circulating supply of 447,370.32 tokens and fully diluted valuation equal to market cap at USD 1.43 billion; these figures reflect the token, not the physical gold market.
Source Dating Caveats
[T1] and [T4] lack publication dates; all figures from them (real yields ~2.6%, 10Y Treasury ~5%, USD 4,010/oz, PBoC 23-month streak, USD 40 trillion US debt) are attributed as news context, not current dataset values. [T7] figures come from an October 2026 Fortune article citing a Goldman Sachs note. [T8] cites a WGC report published 3 November 2026. [T2] and [T3] are dated 28 October 2026. [T5] (a Facebook post referencing 2024 Fed cuts) and [T6] (a WisdomTree Q2 2024 outlook) are stale historical context only and are not used as evidence of current market state.
Calculations
Drawdown from ATH: (3,199.71 – 4,688.32) / 4,688.32 = -31.75%. Upside from ATL: (3,199.71 – 1,265.28) / 1,265.28 = +152.88%. Euro area 10Y-2Y spread: 3.4415% – 3.1251% = 31.6 bp. Central bank demand multiple: 79t / 17t = 4.6x; 85t / 17t = 5.0x. Implied XAU/USD: 3,199.71 x 1.0988 = ~USD 3,516/oz, flagged as inconsistent with [T4]. Indicative EUR conversion of USD technical levels: USD 4,075 and USD 4,106 at 1.0988 give roughly EUR 4,476 and EUR 4,510. Euro area real yields cannot be computed because euro area HICP inflation is not in the dataset.
Sources
- [T1] VanEck Merk Gold Trust (OUNZ): Gold’s Macro Drivers and Structural Outlook
- [T2] Gold outlook: XAU/USD holds above key support ahead of FOMC (StoneX)
- [T3] Gold outlook: XAU/USD holds above key support ahead of FOMC (Forex.com)
- [T4] The Age of Gold: The Sovereignty Asset
- [T5] Gold Surges Past $2,700 as Central Banks Double Down on Safe Havens (Facebook)
- [T6] Gold Outlook to Q2 2024 (WisdomTree Onchain)
- [T7] Goldman Sachs: Central banks increase gold demand and diversify storage for reserve security (Fortune)
- [T8] Central banks buy gold at fastest pace in two years, WGC (Central Banking)
Disclaimer
This report is AI-generated and provided for informational purposes only. It does not constitute investment advice, a recommendation, or an offer to buy or sell any financial instrument. Data may be incomplete, delayed or inaccurate, and readers should verify all figures independently before making any investment decision.
Important Note / Wichtiger Hinweis:
EN: This report may have been generated using AI. It processes data from publicly available sources. The content is provided for informational purposes only.DE: Dieser Bericht kann mithilfe von KI erstellt worden sein. Dabei werden Daten aus öffentlich zugänglichen Quellen verarbeitet. Die Inhalte dienen ausschließlich Informationszwecken.
* DE: Die ergänzenden Inhalte können KI-generiert sein. EN: The additional content may be AI-generated.