
Watch the video
This player shows only the Gold chapter of the daily altii market briefing. Watch the full video on tube.altii.de.
Key Data Snapshot
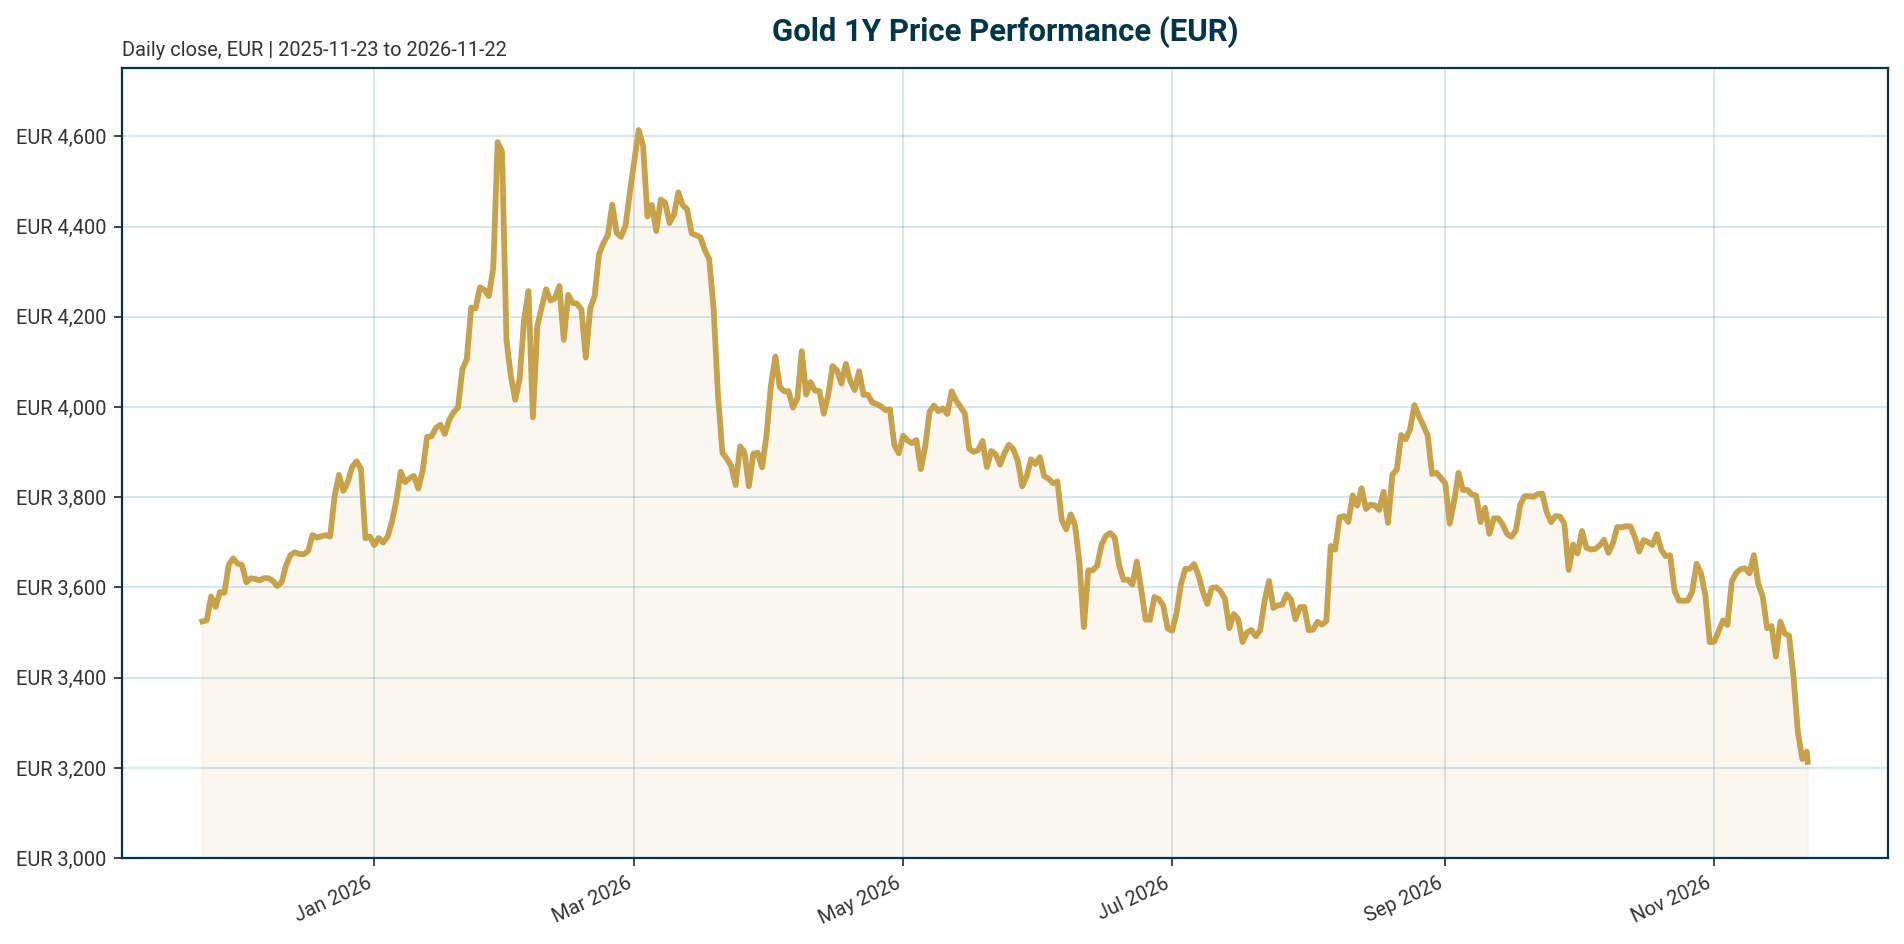
Gold (XAU) quoted in euro trades at 3,213.78 EUR as of 22 November 2026 (retrieved 05:19 UTC via the PAX Gold proxy). The metal is in a confirmed cyclical correction: down 7.68% over 5 days, 13.03% over 14 days and 31.45% below its all-time high of 4,688.32 EUR set on 28 January 2026.
| Metric | Value | Change / Context |
|---|---|---|
| XAU/EUR price | 3,213.78 EUR | 24h range 3,191.60 to 3,247.41 EUR; +0.44% 24h |
| Multi-horizon change | -7.68% (7d) | -13.03% (14d), -12.34% (30d), -23.81% (200d), -13.03% (1y) |
| All-time high | 4,688.32 EUR (2026-01-28) | Drawdown -31.45%; upside to ATH +45.9% |
| All-time low | 1,265.28 EUR (2019-11-17) | +154.00% since ATL |
| Fed funds target range | 3.75% to 4.00% (as of 2026-11-21) | Last change: hike of 25 bp, effective 2026-09-17 |
| ECB deposit facility rate | 2.50% (as of 2026-11-22) | Last change: hike of 25 bp, effective 2026-09-16 |
| Euro area AAA yields (2Y/5Y/10Y/30Y) | 3.13% / 3.19% / 3.44% / 3.69% | 10Y +49.3 bp YTD; 10Y-2Y spread 31.6 bp |
| EUR/USD | 1.0987 | -0.06% 5d, -2.06% 1m, -6.49% YTD |
| EUR/GBP / EUR/JPY | 0.83692 / 175.04 | EUR/GBP +0.41% 5d (strongest FX move) |
| Proxy market metrics | Market cap ~1.44bn EUR, rank 48 | Circulating supply 447,333 tokens; 24h volume 88.6m EUR |
Calculation note: converting the EUR price at the current EUR/USD rate implies roughly 3,213.78 x 1.0987 = ~3,531 USD/oz. Dated sources quote gold around $4,010/oz [T6]. We do not reconcile this gap silently; it reflects proxy timing, source staleness and undated figures. See Appendix.
Macro Backdrop
Market overview: Risk sentiment is negative and equity momentum is broadly negative, with DACH indices broadly in line with global peers (5-day average -6.59% versus -6.40% globally). The Nasdaq Composite is the weakest 5-day performer at -7.72%, the S&P 500 is down 6.83% over 5 days and 10.92% over a month, and the DAX has lost 6.75% over 5 days. The rates backdrop is mixed, with the euro area AAA 10Y yield at 3.44% after a 3.0 bp move over 5 days, and FX is mixed, with EUR/USD at 1.0987 (-0.06% over 5 days) and EUR/GBP posting the strongest 5-day move at +0.41%. These observations frame, but do not replace, the gold-specific analysis below.
Policy is restrictive on both sides of the Atlantic. The Federal Reserve funds target stands at 3.75% to 4.00% after a 25 bp hike effective 17 September 2026, and the ECB deposit facility rate sits at 2.50% after a 25 bp hike effective 16 September 2026. Euro area AAA 2Y yields are up 101.7 bp year to date, showing how sharply the front end has repriced.
For gold, real yields are the dominant near-term swing factor [T1]. According to [T6], written during the current episode, the 10-year Treasury yielded around 5% with real yields near 2.6%, raising the opportunity cost of a non-yielding asset. Kitco described October 2026 as a near-perfect storm: real yields surged, the US dollar hit 52-week highs, energy prices accelerated and financial conditions tightened, yet underlying market structure stayed firmer than the price action suggested [T4]. Higher oil prices risk keeping inflation elevated and central banks restrictive for longer, per StoneX and Forex.com commentary dated 28 October 2026 [T2] [T3].
Scenario (assumption): if the Fed holds the 3.75% to 4.00% range into year-end while oil-driven inflation persists, real yields stay elevated and the opportunity-cost headwind remains. Conversely, if tightening financial conditions and sovereign debt stress force a pivot, the same forces would turn supportive, per the mechanism described in [T4].
Investment Thesis
The core tension in 2026 is a tug-of-war between tactical headwinds and structural tailwinds [T1]. Tactically, a hawkish Fed under Chair Kevin Warsh, who has signalled more tightening and a smaller balance sheet, elevated real yields and a firm dollar all cap the metal [T6]. Structurally, record central bank buying, fiscal dominance and de-dollarization underpin it. XAU/EUR at 3,213.78 EUR sits mid-correction: 31.45% below the January high but 154.00% above its November 2019 low.
The fiscal argument is the anchor of the structural case. US federal debt has passed $40tn with net interest costs around 3% of GDP, matching post-war highs, and gold is the market’s verdict on how that ends [T6]. Globally, sovereign debt stands near $108 trillion, or 91.5% of world GDP, potentially constraining central bank policy and eroding real fixed-income returns [T5]. Since the 2022 freezing of Russian reserves, gold has become the sovereignty asset, the only reserve that is nobody else’s liability; the People’s Bank of China has bought for 23 consecutive months and China imported a record 1,141 tonnes for consumers in the first eight months of 2026, according to [T6] as of writing.
Despite the price decline, market structure is stronger than the tape suggests: systematic positioning has been reduced while Chinese physical, commercial and central bank demand stayed resilient [T4]. The strongest bear case is paradoxically the AI productivity boom, since genuinely higher real yields for good reasons ended previous gold bull markets [T6].
Base case (scenario assumption): gold consolidates while the Fed stays restrictive, with the $4,000/oz USD area, per [T6] as of writing, holding through repeated tests as central banks buy dips. Structural case (scenario assumption): if fiscal dominance and reserve diversification continue, this correction is cyclical within a secular bull market, with the late-2022 bottoming process described in [T4] as the template.
Bullish Drivers
- Central bank demand as a structural floor. Official-sector purchases, even at historically elevated prices, reduce downside sensitivity to weaker retail demand; the pace of PBoC and National Bank of Poland buying is a key swing factor [T1] [T2] [T3].
- Chinese demand intensity. The PBoC has bought for 23 consecutive months, Shanghai is building a parallel pricing hub, and consumer imports hit a record 1,141 tonnes in the first eight months of 2026, per [T6] as of writing.
- Fiscal constraints on policy. Record debt burdens ($108tn, 91.5% of world GDP) potentially cap how long real rates can stay restrictive, while persistent inflation erodes real fixed-income returns [T5]. If policymakers must balance inflation control against financial stability, maintaining restrictive real rates becomes increasingly difficult [T4].
- Cleaner positioning and physical demand. Reduced speculative positioning, resilient Chinese physical demand and a potential larger policy response from China are cited as catalysts for the next leg of the cycle [T4].
- Safe-haven channel. The bundle’s risk sentiment is negative, with the Nasdaq down 7.72% over 5 days; gold’s historical role in preserving purchasing power during stress and instability remains intact [T8].
- Dollar weakness trigger. A grinding US dollar downtrend or renewed dollar weakness is identified as a key bullish catalyst [T1].
Bull scenario (assumption): financial stability or fiscal stress forces the Fed off its restrictive path despite hawkish rhetoric; falling real yields plus continued official-sector buying drive a durable recovery, analogous to the late-2022 bottoming process in [T4].
Relative Positioning vs Bitcoin and Ethereum
The bundle provides no current Bitcoin or Ethereum price, return or drawdown data, so a quantitative comparison is not possible from this dataset; the comparison below is qualitative, anchored on crypto market context and gold’s structural characteristics.
Crypto context from the bundle: total crypto market cap stands at ~1.87 trillion USD, Bitcoin dominance is 57.66%, and 24-hour crypto volume is ~79.05bn USD. Gold’s proxy market cap of ~1.44bn EUR reflects only the tokenized PAX Gold wrapper, not the gold market itself.
Three structural contrasts matter for allocators. First, the demand floor: gold carries an official-sector bid from central banks [T1] [T4]; crypto assets have no comparable sovereign buyer. Second, macro sensitivity: gold trades on real yields and the dollar [T1], while crypto trades on liquidity and risk appetite, which are currently negative per the bundle’s risk sentiment. Third, yield characteristics: gold pays no coupon [T1] [T8], but it competes with bonds as a reserve asset; crypto competes with risk assets as a liquidity beneficiary.
Scenario (assumption): in a negative risk-sentiment regime, gold’s central bank floor differentiates it from crypto, which lacks that bid. Scenario (assumption): if the Fed pivots and liquidity eases, both benefit, but crypto’s higher beta would likely produce larger moves. These are assumptions, not sourced data.
Scenario Framework
The framework anchors on the Fed’s reaction function, real yields and central bank flows. Policy rates are facts: Fed funds target 3.75% to 4.00% (as of 2026-11-21) and ECB deposit rate 2.50% (as of 2026-11-22). No forward rate decisions exist in the dataset; all forward paths below are scenario assumptions, not market-implied expectations, as no futures or OIS data is available.
| Scenario | Real yields (assumption) | EUR/USD (assumption) | Central bank flows | Gold implication |
|---|---|---|---|---|
| Bear | Rise further from the ~2.6% level cited by [T6] as of writing | Dollar firms; EUR cushion only partial | Buying slows at lower prices | $4,000/oz USD support fails; XAU/EUR extends beyond -31.45% drawdown |
| Base | Stay elevated but stable as the Fed holds 3.75% to 4.00% | Ranges near 1.0987 | Official sector absorbs dips, per the pattern in [T6] | Sideways range; $4,000/oz USD zone repeatedly tested |
| Bull | Fall as fiscal or financial stress forces a pivot [T4] | Dollar weakness, the [T1] catalyst | Accelerate on dollar weakness | Recovery resumes; late-2022 rebound in [T4] as template |
Technical reference from a dated source: per StoneX and Forex.com commentary dated 28 October 2026, a sustained move above $4,075 to $4,106 in USD terms would be the first sign sellers are losing control [T2] [T3]. These are USD levels from late October, not current EUR levels. The EUR overlay matters: with EUR/USD down 6.49% YTD, EUR-quoted outcomes will differ from USD headlines.
Valuation Discussion
Gold has no cash flows, so valuation must be framed through drawdown, opportunity cost and structural demand rather than a discounted cash flow model.
Drawdown anchor. XAU/EUR at 3,213.78 EUR is 31.45% below the 28 January 2026 ATH of 4,688.32 EUR, with upside to the ATH of (4,688.32 / 3,213.78) – 1 = +45.9%. It remains 154.00% above the November 2019 ATL of 1,265.28 EUR. Buyers of the January euphoria are underwater, and per [T6] as of writing gold traded around $4,010/oz, roughly 26% below its 29 January record.
Opportunity cost anchor. With the Fed at 3.75% to 4.00% and euro area AAA 10Y yields at 3.44%, a non-yielding asset competes against attractive bond returns [T1] [T2] [T3]. Higher-for-longer rates have raised expectations for neutral policy rates and term premia, pressuring non-yielding assets [T5]. The dataset contains no current euro-area inflation figure, so a euro real yield cannot be computed; any real-rate estimate would require a stated inflation assumption and none is available here.
Structural demand anchor. Limited financial ownership of gold is a structural tailwind, suggesting price history alone understates potential demand [T1]. If central banks keep buying even at historically elevated prices [T1], the official sector effectively sets a valuation floor that retail-driven models underestimate (scenario assumption).
Valuation view (scenario assumption): if real yields near 2.6%, as cited by [T6] as of writing, persist, gold’s equilibrium price is lower than January 2026 euphoria implied, and the current 31.45% drawdown partially restores a margin of safety for structural buyers. Counterpoint (scenario assumption): a genuine AI-driven productivity boom sustaining higher real yields would argue that prior bull market endings, not fiscal dominance, are the relevant template [T6].
Risks
- Hawkish Fed risk. Chair Warsh has signalled more tightening and a smaller balance sheet [T6]. The dataset contains no meeting calendar, so timing risk cannot be quantified.
- Real-yield risk. Persistent inflation and energy-driven pressures could keep real yields elevated and delay a durable turn in gold [T4].
- Two-sided driver risk. The same inflation that supports gold as a hedge forces the hawkish policy that hurts it [T2] [T3]. Every major driver currently cuts both ways.
- Dollar risk. Renewed dollar strength dampens gold momentum [T1]. For EUR-quoted investors, the euro quote partially hedges this, since EUR/USD weakness cushions EUR-denominated losses.
- AI/productivity risk. A genuine AI productivity boom sustaining higher real yields is the strongest structural bear case [T6].
- Positioning risk. Cleaner speculative positioning is a positive [T4], but a further break of support could trigger renewed systematic selling.
- Data and proxy risks. The bundle price is PAX Gold used as an XAU/EUR proxy, with potential tracking differences versus spot. Tavily sources quote USD prices at various dates, some undated. The bundle contains no current CPI, payroll or US real-yield series, and the implied USD price (~3,531/oz) differs materially from the ~$4,010/oz in undated [T6]; this gap is disclosed, not reconciled.
- Model risk. All scenario probabilities here are qualitative. The dataset contains no market-implied policy path, so no probability can be attributed to future rate moves.
Appendix
Methodology and provenance. XAU/EUR price data comes from the PAX Gold token (coingecko_id pax-gold) as a proxy for spot gold, retrieved 2026-11-22T05:19:47Z. Market overview series are as of 2026-11-19 (euro yields), 2026-11-20 (equities) and 2026-11-22 (FX). Policy rates come exclusively from the authoritative Policy Rates block: Fed funds target range 3.75% to 4.00% (FRED, as of 2026-11-21) and ECB deposit facility rate 2.50% (ECB key rate, as of 2026-11-22). No other central bank policy rates are in the dataset.
Source dating. T2 and T3 are dated 28 October 2026; T4 is dated 18 November 2026. T1, T5, T6, T7 and T8 carry no publication date in the dataset; figures from these sources are quoted as of writing and may be stale.
Currency note. All bundle price data is EUR-quoted. USD figures from sources ($4,000/oz support, $4,010/oz spot, $4,075 to $4,106 resistance) are USD and dated, and must not be read as current EUR levels.
Key calculations. Drawdown from ATH: (3,213.78 / 4,688.32) – 1 = -31.45%. Upside to ATH: (4,688.32 / 3,213.78) – 1 = +45.9%. Gain since ATL: (3,213.78 / 1,265.28) – 1 = +154.0%. Euro AAA 10Y-2Y spread: 3.44% – 3.13% = 31.6 bp, matching the bundle value. Implied USD price: 3,213.78 x 1.0987 = ~3,531 USD/oz. Cross-asset 5-day test of the safe-haven hypothesis: gold -7.68% versus Nasdaq -7.72%, S&P 500 -6.83%, DAX -6.75%, Hang Seng -5.65%, Nikkei -5.41%; gold offered no relative shelter in this window, indicating the rates headwind dominated the stress channel.
Glossary. Real yield: a bond yield adjusted for inflation, the key opportunity cost for gold. Opportunity cost: the return forgone by holding a non-yielding asset. Deposit facility rate: the ECB rate on overnight deposits from banks, its effective policy floor. Federal funds target range: the Fed’s corridor for overnight interbank rates. 10Y-2Y spread: the gap between 10-year and 2-year yields, a curve steepness measure. Drawdown: peak-to-trough price decline. De-dollarization: the shift of reserves away from US dollar assets. Sovereignty asset: a reserve asset that is no other entity’s liability.
Sources
- [T1] VanEck Merk Gold Trust (OUNZ): Gold’s Macro Drivers and Structural Outlook
- [T2] Gold outlook: XAU/USD holds above key support ahead of FOMC (StoneX, 2026-10-28)
- [T3] Gold outlook: XAU/USD holds above key support ahead of FOMC (Forex.com, 2026-10-28)
- [T4] Gold and silver weather a perfect storm as demand holds firm (Kitco News, 2026-11-18)
- [T5] Rethinking the 60/40 portfolio: The case for gold (State Street Global Advisors)
- [T6] The Age of Gold: The Sovereignty Asset (Crack the Market)
- [T7] Gold Outlook to Q2 2024 (WisdomTree Onchain)
- [T8] Why do governments and central banks hold gold as a reserve asset? (Britannica)
Disclaimer. This report is AI-generated, for informational purposes only, and does not constitute investment advice. Figures should be independently verified before any investment decision. Scenario statements are assumptions, not forecasts, and no probability is attached to any future policy move.
Important Note / Wichtiger Hinweis:
EN: This report may have been generated using AI. It processes data from publicly available sources. The content is provided for informational purposes only.DE: Dieser Bericht kann mithilfe von KI erstellt worden sein. Dabei werden Daten aus öffentlich zugänglichen Quellen verarbeitet. Die Inhalte dienen ausschließlich Informationszwecken.
* DE: Die ergänzenden Inhalte können KI-generiert sein. EN: The additional content may be AI-generated.