
Key Data Snapshot
| Metric | Value |
|---|---|
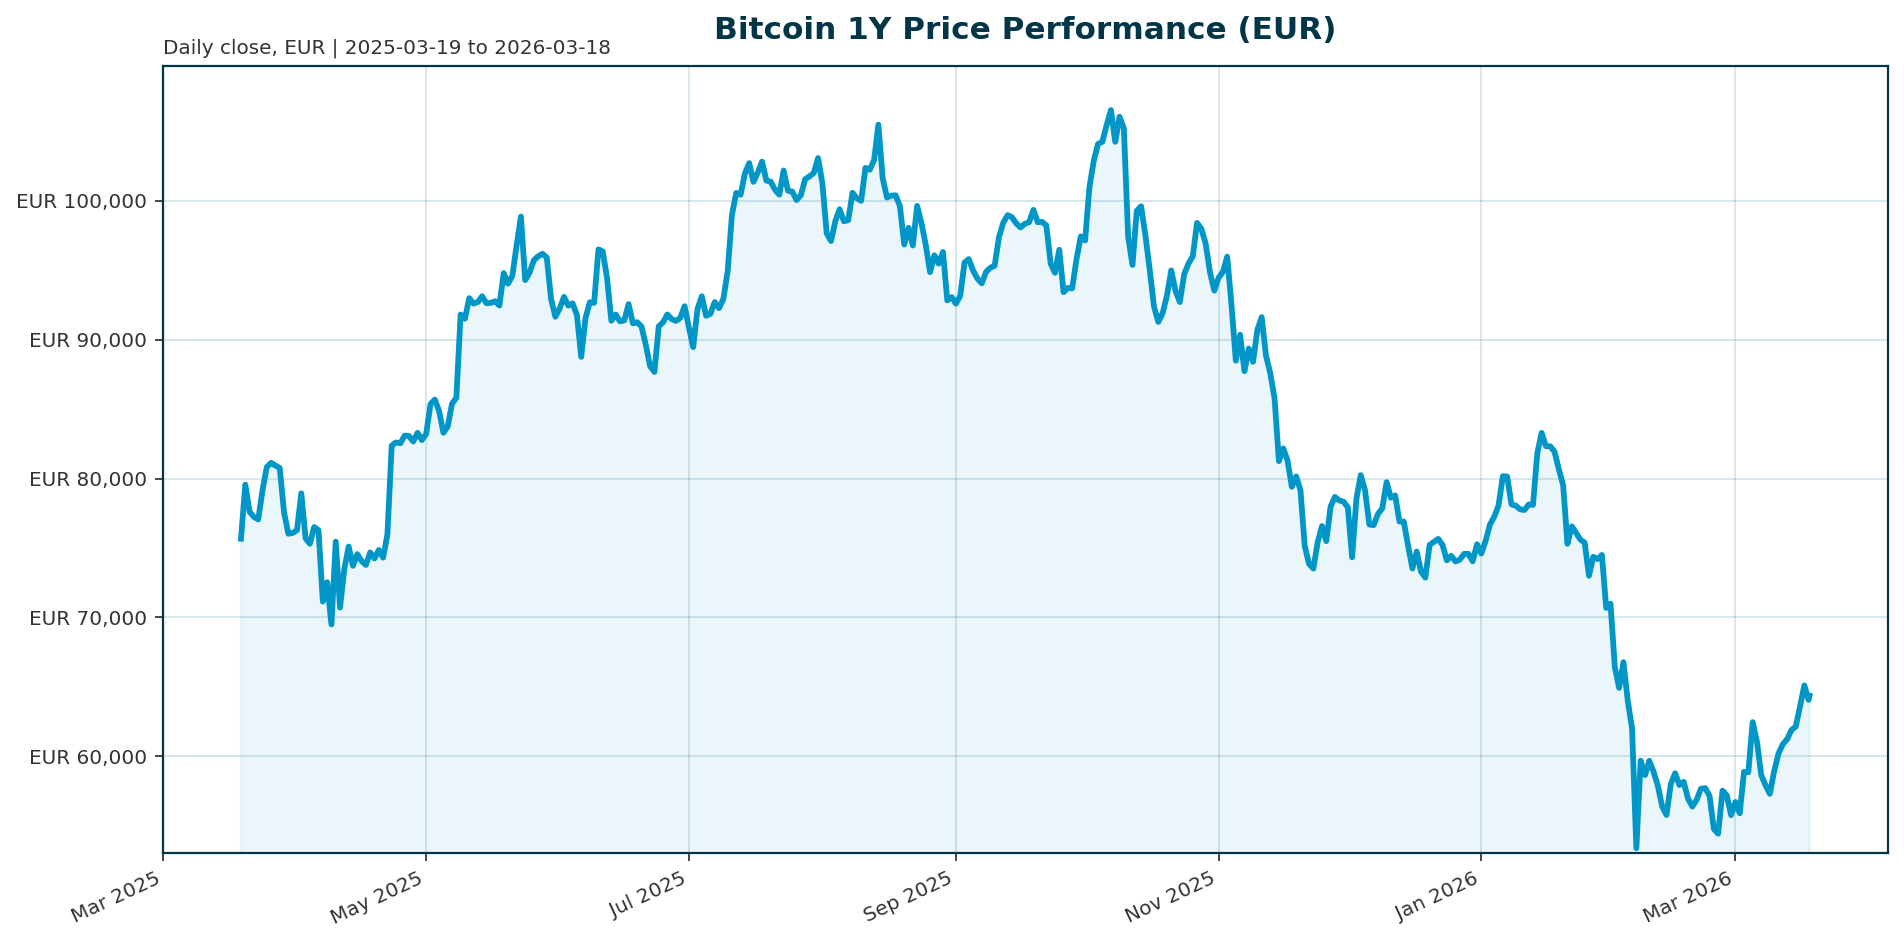
| Price (EUR) | 64,357.00 |
| 24h Change | -0.52% |
| 7d Change | +7.61% |
| 30d Change | +11.69% |
| 200d Change | -30.65% |
| Market Cap | 1.29T EUR |
| ATH (Oct 2025) | 107,662.00 EUR (-40.22%) |
| BTC Dominance | 56.70% |
| 24h Volume | 33.96B EUR |
Market Setup
Bitcoin is navigating a complex macro environment characterized by a structural shift in demand and persistent geopolitical uncertainty. The asset is in a recovery phase, having bottomed after a 40% drawdown from its October 2025 all-time high [T4]. The immediate catalyst is the Federal Reserve’s March 18 rate decision, which market participants are watching closely for signals on liquidity [T1].
On the positive side, Bitcoin has begun to decouple from traditional risk assets. While the S&P 500 and tech stocks have struggled, and gold has shed value, Bitcoin has outperformed both over the past two weeks, suggesting a weakening correlation with equities and a potential re-evaluation of its role in portfolios [T4]. However, the backdrop of the U.S.-Iran conflict and surging oil prices continues to weigh on risk sentiment, creating a volatile landscape for high-beta assets [T6][T7].
Investment Thesis
The core investment thesis for Bitcoin has evolved from a “digital safe haven” to a “post-shock liquidity” play. Analysis suggests Bitcoin does not function as a safe haven during the initial phase of geopolitical shocks, as institutional investors typically rotate into gold and cash during genuine fear [T6]. Instead, Bitcoin acts as a bet on the aftermath.
When crises trigger fiscal stimulus and money creation, liquidity eventually flows into scarce assets. In the current scenario, a US-led war effort against Iran is likely to require significant fiscal spending, which will be monetized. This fiscal expansion could create the inflationary environment where Bitcoin’s fixed supply narrative becomes most powerful, potentially driving prices to $150,000-$180,000 within 18-24 months once oil stabilizes [T6].
Bullish Drivers
Several structural factors are supporting the current recovery. First, U.S. spot Bitcoin ETFs have recorded three consecutive weeks of net inflows, totaling $767.3 million last week, signaling renewed institutional interest [T1][T3]. Second, corporate accumulation remains robust, highlighted by Strategy’s recent purchase of 17,994 BTC valued at roughly $1.2 billion [T3][T8].
Additionally, a novel demand driver has emerged in the form of Strategy’s preferred issuance (STRC), which offers an 11.5% yield tied to Bitcoin exposure. This product has attracted hundreds of millions in daily demand, suggesting that crypto-specific capital flows are overwhelming traditional macro correlations [T8]. The divergence from tech stocks, which have underperformed while Bitcoin has risen, further supports the bullish case for a structural rotation [T4].
Relative Positioning vs Gold and Ethereum
Bitcoin currently underperforms gold as a safe haven asset, a dynamic expected during periods of acute geopolitical stress. Gold has remained stable at $5,003.80 while Bitcoin dipped slightly, reflecting the traditional flight-to-safety preference for gold [T5].
However, Bitcoin is outperforming traditional equities and tech stocks. In contrast, Ethereum is leading the flow narrative. Spot Ether ETFs recorded $160.8 million in inflows over the same period as Bitcoin ETFs, indicating that capital is rotating toward Ethereum as the primary beneficiary of ETF adoption [T1][T3]. This suggests Ethereum may be capturing the bulk of institutional interest, potentially pressuring Bitcoin’s dominance.
Scenario Framework
Market participants are closely watching the $75,000 level, which represents a concentration of options open interest and a psychological resistance point [T7]. The path forward depends heavily on macro clarity.
- Bullish Scenario: If the Federal Reserve cuts rates and oil prices stabilize, liquidity expands. Bitcoin breaks above $75,000, triggering a short squeeze. Supported by post-war fiscal spending, Bitcoin could reclaim $100,000 and target $150,000-$180,000 within 18-24 months [T6][T7].
- Base Case: Bitcoin consolidates within the $70,000-$75,000 range. The asset waits for a definitive signal from the Fed or a resolution to the Middle East conflict before making a directional move.
- Bearish Scenario: If oil shocks persist or the Fed holds rates, risk sentiment could deteriorate. Bitcoin fails to hold $70,000, leading to a retest of the $50,000 support level [T7].
Valuation Discussion
Bitcoin is currently trading at approximately 60% of its October 2025 all-time high, reflecting a 40% drawdown from peak valuation [T4]. The Fully Diluted Valuation stands at 1.29T EUR. While the current price suggests a discount to peak levels, the valuation is supported by a massive increase in cumulative ETF inflows, which have reached 56.31 billion EUR since inception [T5].
Valuation risks include the potential for Ethereum to outperform Bitcoin if ETF flows continue to favor ETH over BTC. If Bitcoin loses its dominance edge, the market cap expansion may be slower than historical cycles, keeping the price range more compressed than previous bull runs.
Risks
- Geopolitical Escalation: The U.S.-Iran conflict remains a primary tail risk. A sudden escalation could trigger a global risk-off trade, causing Bitcoin to underperform gold and cash as institutional investors retreat from high-beta assets [T6][T7].
- Macro Policy: The Federal Reserve’s decision on March 18 is critical. A hawkish stance could stifle liquidity, while a dovish cut could validate the post-shock liquidity thesis.
- Options Concentration: The large concentration of open interest around the $75,000 strike creates a volatility risk. A breach could trigger amplified moves, while a rejection could lead to a sharp correction [T7].
- Adoption Depth: Despite strong headline flows, roughly 80% of crypto ETF activity is driven by self-directed investors rather than advisor-managed portfolios. This limits the depth of institutional integration and leaves the market vulnerable to retail sentiment shifts [T2].
Appendix
Sources
- Bitcoin rally tests $75,000 level in massive short squeeze – The Block [T1]
- Crypto ETF Demand Still Driven by Self-Directed Investors, Morgan Stanley Says – FinanceFeeds [T2]
- Bitcoin trades around $72,800 in ‘solid’ relief bounce supported by ETF inflows – The Block [T3]
- BTC price analysis: Bitcoin set for best week since September 2025 as correlation with tech stocks weakens – CoinDesk [T4]
- BTC price hits a wall at $75,000 while onchain energy markets run hot: Crypto Daybook Americas – CoinDesk [T5]
- Bitcoin In The Crossfire: What Oil Shocks Really Do To Crypto – Forbes [T6]
- Bitcoin Pushes Higher as Macro Tests Loom – Decrypt [T7]
- Why Bitcoin’s Price Is at a Weekly High Despite Middle East Tensions – Decrypt [T8]
Disclaimer: This report is AI-generated for informational purposes only and does not constitute investment advice. The data and analysis presented are based on market conditions as of March 18, 2026, and are subject to change. Readers should conduct their own due diligence before making investment decisions.
Important Note / Wichtiger Hinweis:
EN: This report may have been generated using AI. It processes data from publicly available sources. The content is provided for informational purposes only.DE: Dieser Bericht kann mithilfe von KI erstellt worden sein. Dabei werden Daten aus öffentlich zugänglichen Quellen verarbeitet. Die Inhalte dienen ausschließlich Informationszwecken.
* DE: Die ergänzenden Inhalte können KI-generiert sein. EN: The additional content may be AI-generated.