
Key Data Snapshot
| Metric | Value |
|---|---|
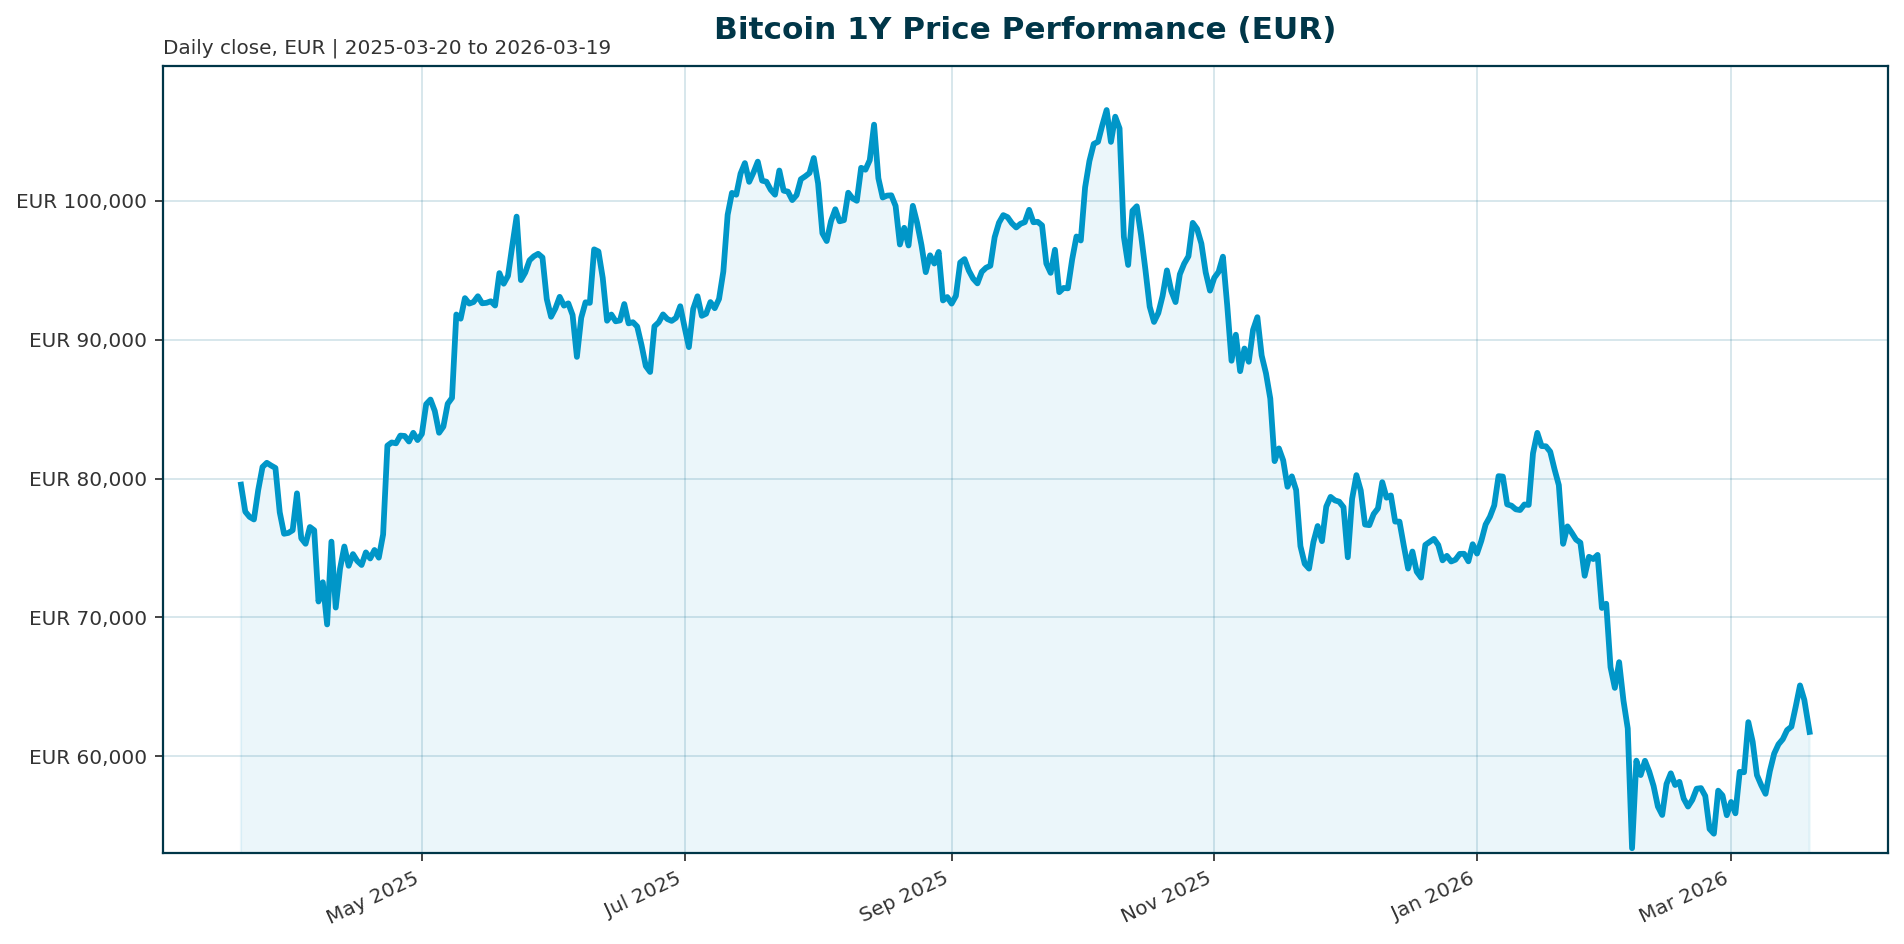
| Current Price (EUR) | €61,740.00 |
| 24h Change | -4.04% |
| 7d Change | +2.65% |
| 30d Change | +6.85% |
| 200d Change | -33.69% |
| Market Cap (EUR) | €1.235T |
| Bitcoin Dominance | 56.33% |
| All-Time High (ATH) | €107,662.00 (Oct 2025) |
| ATH Drawdown | -42.65% |
Market Setup
Bitcoin is consolidating around €61,740 following a relief rally that tested the €75,000 resistance level. The recent strength is attributed to a return of institutional spot demand and positive ETF flows [T1][T3]. Despite the rally, the asset remains in a downtrend relative to its October 2025 all-time high, sitting down 42.65% from that peak [T6].
The current market structure is defined by a dichotomy between retail and institutional participation. While spot ETF net inflows have returned positively, totaling approximately €1.3 billion in March [T6], Morgan Stanley research indicates roughly 80% of these flows are driven by self-directed investors rather than advisor-managed portfolios [T2]. This suggests the current liquidity is largely retail-driven, creating a structural vulnerability if sentiment shifts.
On the macro front, the asset is navigating a complex geopolitical environment. The ongoing U.S.-Iran conflict has driven oil prices to $103 per barrel [T1], creating inflationary pressure. However, Bitcoin has decoupled from traditional risk assets, outperforming both gold and the S&P 500 during the initial phase of the conflict [T4][T6]. Traders are currently watching the Federal Reserve’s March 18 rate decision and oil price trajectories for direction [T1].
Investment Thesis
The investment thesis for Bitcoin centers on the concept of a “conditional hedge” and a “bet on what happens after the shock.” Unlike traditional safe havens like gold, Bitcoin does not perform well during the immediate onset of geopolitical stress. Instead, it thrives when fiscal stimulus and monetary expansion follow the crisis [T8].
The current Iran conflict highlights this dynamic. While gold remained stable and the U.S. dollar strengthened, Bitcoin surged nearly 10% [T4]. This outperformance is driven by the expectation that the U.S. war effort will require significant fiscal spending, which will likely be monetized, leading to an expansion of global liquidity [T8]. Bitcoin, with its fixed supply of 21 million coins, is positioned to capture a disproportionate share of this newly created liquidity.
Furthermore, the narrative is shifting from a speculative risk asset to a macro liquidity receiver. As the correlation with tech stocks weakens [T6], Bitcoin is beginning to function more like a digital store of value that reacts to central bank policy and fiscal deficits rather than just growth expectations.
Bullish Drivers
Several structural and cyclical factors support a bullish outlook for Bitcoin.
- Corporate Treasury Accumulation: Strategy (MSTR) has demonstrated extraordinary demand for its preferred equity issuance, STRC, which offers an 11.5% yield tied to Bitcoin exposure. This product has attracted hundreds of millions in daily demand, translating into the purchase of nearly 18,000 BTC in a single week [T7].
- ETF Inflow Resurgence: U.S. spot Bitcoin ETFs have recorded net inflows for five consecutive days, totaling $767.3 million in the previous week [T3]. This indicates that institutional spot demand is returning, supporting the price floor.
- Post-Halving Supply Dynamics: The market is operating in a post-halving environment with reduced selling pressure from miners. Combined with the capped supply, this scarcity supports higher valuations as liquidity expands [T3].
- Decoupling from Tech Stocks: Bitcoin has begun to diverge from the broader market. While tech stocks have sold off due to energy concerns related to the Iran conflict, Bitcoin has remained resilient, suggesting crypto-specific capital flows are overpowering traditional macro correlations [T6][T7].
Relative Positioning vs Gold and Ethereum
Bitcoin is currently outperforming traditional safe havens and Ethereum in the current risk-on environment.
- Vs. Gold: During the escalation of the Iran conflict, Bitcoin surged the most among major asset classes. Gold remained relatively stable, while Bitcoin leveraged its 24/7 liquidity and borderless nature to attract tactical capital fleeing traditional markets [T4].
- Vs. Ethereum: While Ethereum ETFs have also seen strong inflows, they peaked in mid-January. Bitcoin currently holds the narrative dominance as the primary store of value and macro hedge, whereas Ethereum is often viewed as the primary growth asset within the crypto ecosystem [T1].
- Correlation: The most significant shift in positioning is the weakening correlation with technology stocks. Bitcoin is no longer moving in lockstep with the Nasdaq or AI-related equities, which have been hit hard by energy supply concerns [T6].
Scenario Framework
The market outlook depends heavily on the resolution of the Iran conflict and the Federal Reserve’s monetary policy.
- Bull Scenario (18-24 Months): If oil prices stabilize and the U.S. leads a coalition to secure shipping routes, the immediate threat of conflict subsides. The Federal Reserve then cuts rates, and fiscal spending from the war effort monetizes into the system. In this environment, Bitcoin could reclaim the $100,000 level and potentially reach $150,000-$180,000 as global liquidity expands [T8].
- Base Scenario: The conflict de-escalates without a major economic shock. The Federal Reserve holds rates steady. Bitcoin consolidates between €60,000 and €70,000, slowly grinding higher as ETF flows normalize and institutional adoption deepens.
- Bear Scenario: The conflict escalates, leading to sustained high oil prices and a stagflationary environment. The Federal Reserve maintains rates to combat inflation. In this case, Bitcoin reverts to its risk-on classification, failing to find support and potentially retesting the €50,000 level.
Valuation Discussion
Bitcoin is currently trading at a significant discount to its all-time high, down 42.65% from the €107,662 peak [T6]. However, valuation metrics suggest the asset is not as cheap as the drawdown implies.
- Fully Diluted Valuation (FDV): The current price of €61,740 is slightly above the FDV of €61,740, indicating that holders are profitable and demand is high relative to the maximum supply.
- MVRV Ratio: The Market Value to Realized Value (MVRV) ratio is a key indicator of market tops and bottoms. A reading above 3.0 often signals a top, while readings below 1.0 suggest undervaluation. Given the recent inflows and MSTR accumulation, the ratio is likely stabilizing in a range that supports further accumulation rather than a capitulation event.
- P/B Ratio: The price-to-balance sheet ratio, often used to value companies like MicroStrategy, suggests that the market is pricing in the continued accumulation of Bitcoin by corporates, reinforcing the floor in the market.
Risks
Despite the bullish drivers, several risks could derail the recovery.
- Retail-Driven Liquidity: The current ETF inflow narrative is heavily skewed toward self-directed investors. If retail sentiment turns negative, the inflow data could reverse rapidly, leading to a sharp correction [T2].
- Geopolitical Escalation: The current rally is predicated on the assumption that the Iran conflict remains contained. A significant escalation or a disruption to oil supplies could trigger a genuine risk-off rotation, causing Bitcoin to underperform gold and the U.S. dollar [T4][T8].
- Regulatory Headwinds: While regulation has improved with ETF approvals, the slow pace of advisor integration means the asset remains a niche product for many institutions. A sudden regulatory crackdown on self-directed accounts or ETF structures could freeze liquidity [T2].
- Stagflationary Pressure: High oil prices ($103 Brent) combined with potential rate hikes or holds could create a stagflationary environment. In such a scenario, Bitcoin, which is often viewed as a risk asset, may struggle to attract capital from investors seeking real yields.
Appendix
Sources
- Bitcoin rally tests $75,000 level in massive short squeeze – The Block [T1]
- Crypto ETF Demand Still Driven by Self-Directed Investors, Morgan Stanley Says – FinanceFeeds [T2]
- Bitcoin trades around $72,800 in ‘solid’ relief bounce supported by ETF inflows – The Block [T3]
- Not Gold, Not US Dollar, This Asset Has Surged The Most During Iran War – NDTV [T4]
- BTC price hits a wall at $75,000 while onchain energy markets run hot: Crypto Daybook Americas – CoinDesk [T5]
- BTC price analysis: Bitcoin set for best week since September 2025 as correlation with tech stocks weakens – CoinDesk [T6]
- Why Bitcoin’s Price Is at a Weekly High Despite Middle East Tensions – Decrypt [T7]
- Bitcoin In The Crossfire: What Oil Shocks Really Do To Crypto – Forbes [T8]
Disclaimer: This report is AI-generated for informational purposes only and does not constitute financial advice. The analysis provided is based on market data and news retrieved as of March 19, 2026. Readers should conduct their own research and consult with a qualified financial advisor before making investment decisions.
Important Note / Wichtiger Hinweis:
EN: This report may have been generated using AI. It processes data from publicly available sources. The content is provided for informational purposes only.DE: Dieser Bericht kann mithilfe von KI erstellt worden sein. Dabei werden Daten aus öffentlich zugänglichen Quellen verarbeitet. Die Inhalte dienen ausschließlich Informationszwecken.
* DE: Die ergänzenden Inhalte können KI-generiert sein. EN: The additional content may be AI-generated.