
Listen to the summary
Key Data Snapshot
| Metric | Value |
|---|---|
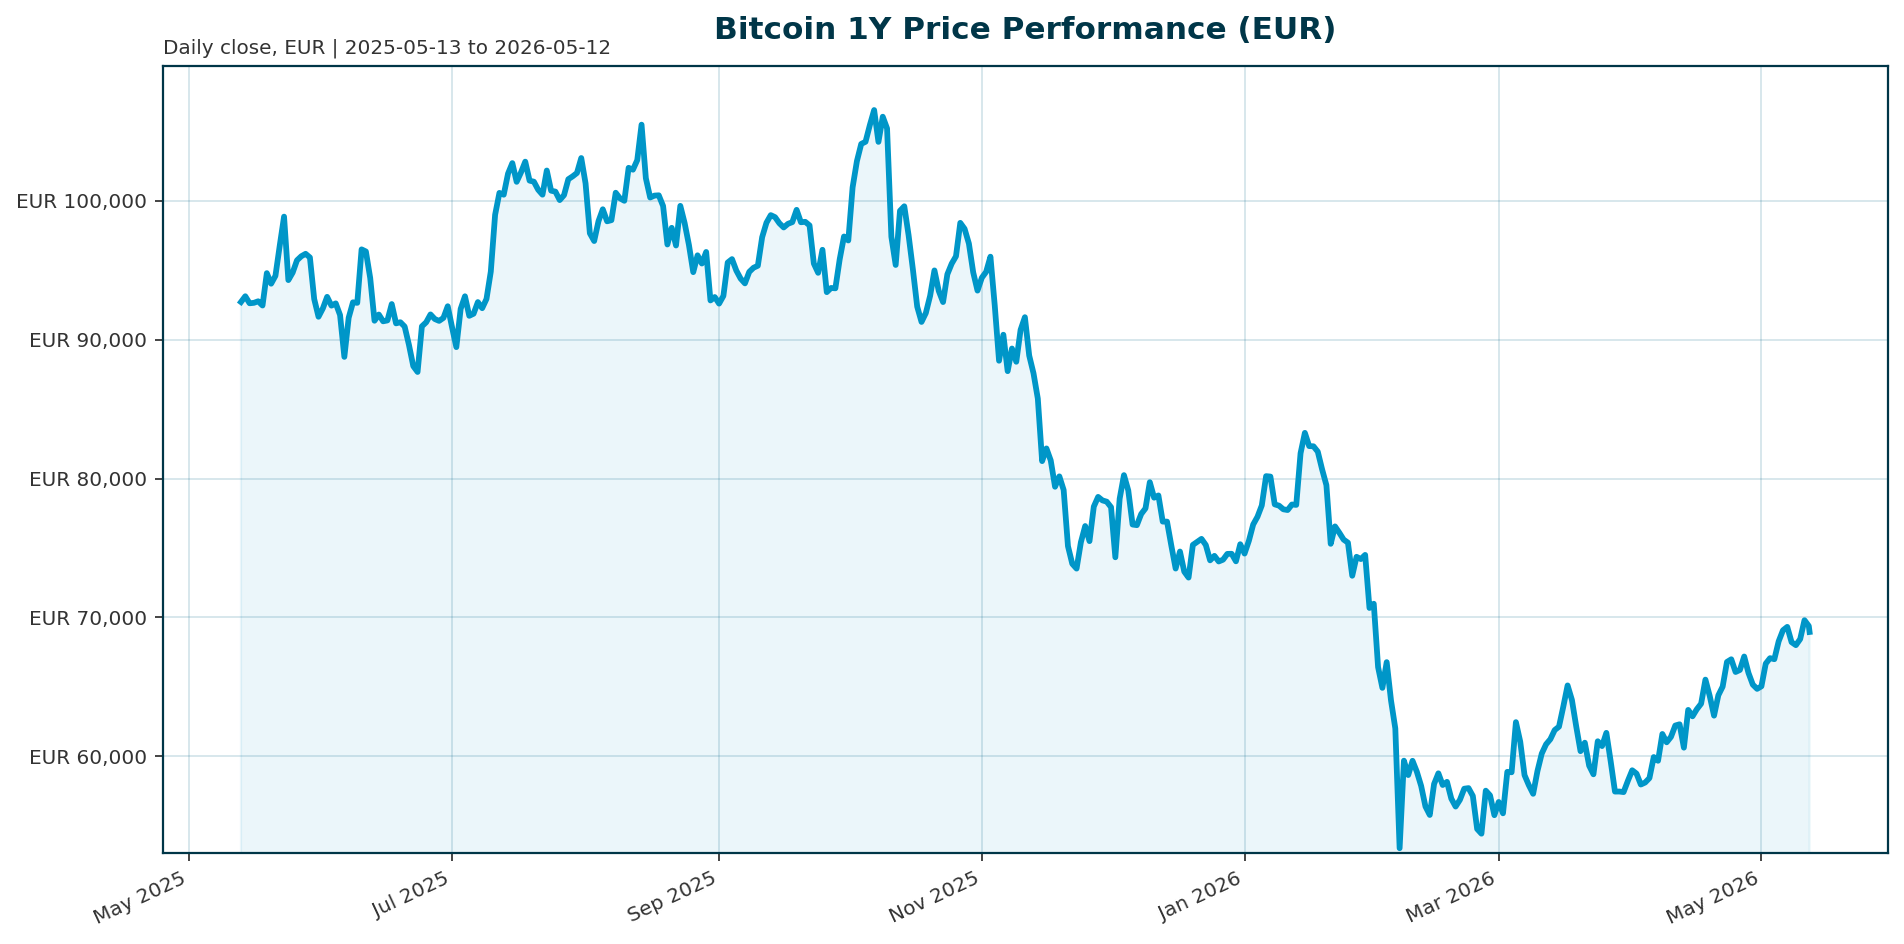
| Price (EUR) | 68,886.00 |
| Market Cap (EUR) | 1.38 T |
| 24h Volume (EUR) | 26.22 B |
| Volume / Market Cap | 1.9% |
| 30-Day Change | +12.72% |
| 200-Day Change | -27.75% |
| ATH (Oct 2025) | 107,662.00 (-36.02%) |
| BTC Dominance | 58.26% |
Market Setup
Global risk sentiment is broadly positive, driven by strong performance in Asian equities where the Nikkei 225 surged 5.40% over five days. However, the DACH region is lagging with a -0.21% decline over the same period, creating a divergence in regional equity momentum. The Euro area 10-year yield sits at 3.05%, with the 10Y-2Y spread at 51.2 bp, indicating a mixed backdrop for fixed income. The FX backdrop is mixed, with EUR/USD holding at 1.1772. Despite the lagging DACH indices, Bitcoin has demonstrated resilience with a 12.7% gain over the last 30 days, outperforming the broader European equity basket.
Investment Thesis
The investment thesis for Bitcoin remains anchored on the acceleration of institutionalization and the maturation of regulatory frameworks. A key pillar of this thesis is the rapid uptake of spot ETFs, evidenced by Morgan Stanley’s MSBT fund gathering over $200 million in assets within weeks, largely driven by self-directed investors rather than traditional advisors [T2]. This shift suggests a transition from decentralized speculation to regulated allocation. Furthermore, the potential passage of the Clarity Act is viewed as a “major moment” for the industry, offering a clearer regulatory path that could unlock significant institutional capital [T3]. Conversely, the thesis faces headwinds from structural risks in private credit markets and regulatory delays, such as the SEC’s caution regarding prediction markets ETFs, which highlight the ongoing friction in market structure [T1][T4].
Bullish Drivers
- Regulatory Clarity: The Clarity Act is positioned as a catalyst that could harmonize regulatory oversight and accelerate blockchain adoption by reducing uncertainty for entrepreneurs and investors [T3].
- Institutional Flows: The success of the Morgan Stanley ETF launch demonstrates that self-directed crypto holders are actively seeking regulated exposure, validating the demand for compliant entry points [T2].
- Market Structure: The ETF wrapper provides a proven, transparent, and convenient mechanism for capital allocation, which is increasingly attractive compared to opaque private credit structures [T1][T2].
Relative Positioning vs Gold and Ethereum
Bitcoin currently anchors the cryptocurrency ecosystem with a dominance of 58.26%, indicating that capital is flowing into the primary crypto asset rather than chasing high-beta altcoins. While explicit Gold price data is unavailable, the high BTC dominance suggests investors are rotating into Bitcoin as a digital store of value amidst a complex macroeconomic backdrop. Ethereum and other altcoins have not yet reclaimed leadership in this cycle, as evidenced by the stable dominance metric. The market structure remains centered on Bitcoin, which continues to dictate the risk sentiment of the broader digital asset class.
Scenario Framework
- Base Case (Consolidation): Bitcoin consolidates between 65,000 and 75,000 EUR. Regulatory progress (Clarity Act) continues, but execution is slow, leading to steady ETF inflows without a sharp price explosion.
- Bull Case (Re-rating): The Clarity Act passes with bipartisan support, and ETF inflows exceed $200 million weekly. Regulatory friction (e.g., SEC delays on prediction markets) is resolved, driving BTC to test the 90,000 EUR level.
- Bear Case (Liquidity Crunch): Private credit structural risks materialize, triggering a broader liquidity squeeze. Regulatory gridlock on stablecoin bills [T6] exacerbates the downturn, causing BTC to retest support levels near 50,000 EUR.
Valuation Discussion
Bitcoin is currently trading at a 36% discount to its October 2025 all-time high of 107,662 EUR. The 200-day moving average is down 27.75%, indicating the asset is still in a correction phase. Valuation metrics suggest the market is pricing in significant regulatory uncertainty. However, the volume-to-market-cap ratio of 1.9% indicates healthy liquidity relative to the asset’s size. The fully diluted valuation matches the market cap, implying no immediate dilution pressure, but the gap to ATH suggests investors are demanding a premium for regulatory and macro risks that were not present during the previous cycle peak.
Risks
- Regulatory Hurdles: The SEC’s delay on prediction markets ETFs and ongoing tussles over stablecoin bills [T1][T6] highlight that regulatory clarity is not guaranteed and could stall institutional adoption.
- Private Credit Vulnerabilities: Regulators warn of structural risks as private credit expansion outpaces oversight, which could lead to a loss of confidence in financial markets and a liquidity crunch that negatively impacts risk assets [T4].
- Macro Headwinds: Geopolitical tensions and weaker global growth prospects, combined with elevated debt servicing costs, pose a threat to the broader risk-on environment that supports Bitcoin [T4].
Appendix
Sources
- SEC delay on prediction markets ETFs echoes a long-fought bitcoin fund battle – CNBC [T1]
- Self-directed investors power bitcoin ETF launch despite Morgan Stanley’s scale – CoinDesk [T2]
- Clarity Act is a ‘major moment’ for the blockchain industry: Pantera Capital – CNBC [T3]
- Regulators warn of structural risks as private credit expansion outpaces oversight – Private Equity Wire [T4]
- Banks and Crypto Backers Tussle as Senators Eye Landmark Digital Asset Bill – Bloomberg [T6]
This report is AI-generated for informational purposes only and does not constitute investment advice. The analysis is based on data available as of May 12, 2026, and should not be considered a recommendation to buy or sell any asset.
Important Note / Wichtiger Hinweis:
EN: This report may have been generated using AI. It processes data from publicly available sources. The content is provided for informational purposes only.DE: Dieser Bericht kann mithilfe von KI erstellt worden sein. Dabei werden Daten aus öffentlich zugänglichen Quellen verarbeitet. Die Inhalte dienen ausschließlich Informationszwecken.
* DE: Die ergänzenden Inhalte können KI-generiert sein. EN: The additional content may be AI-generated.