
Listen to the summary
Key Data Snapshot
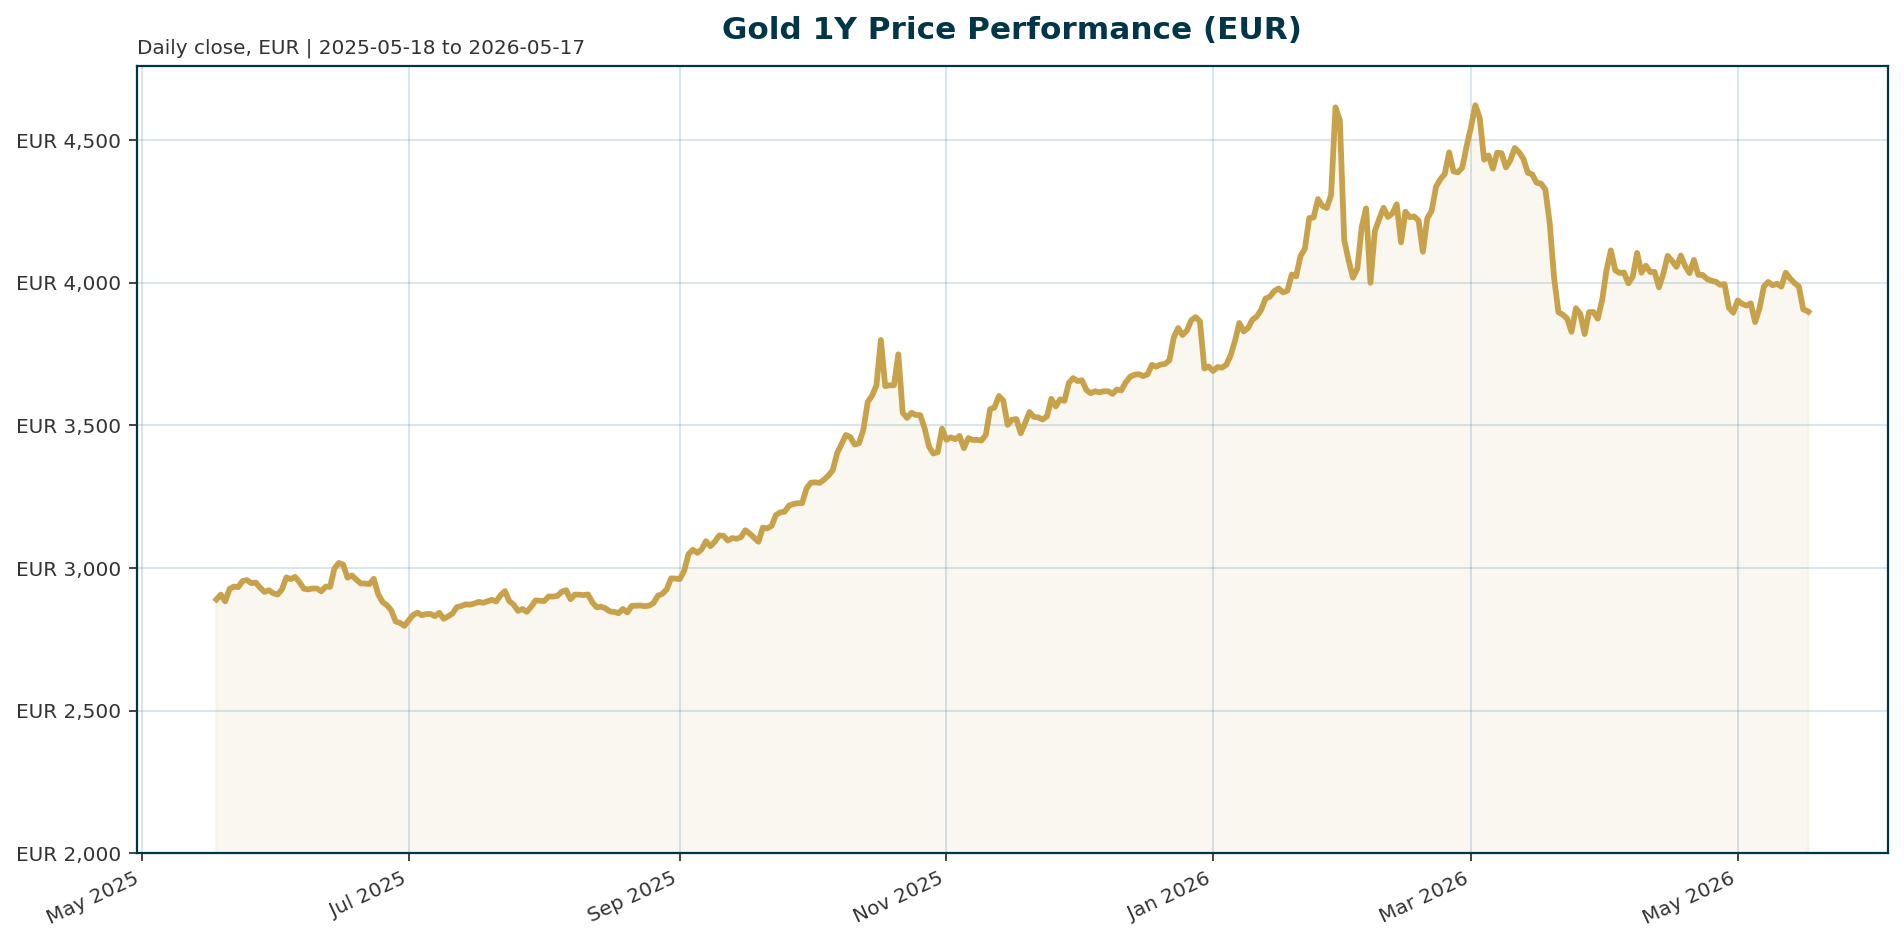
Gold (XAU) trades at 3,898.29 EUR, consolidating near record highs after a 7-day decline of 2.46%. The asset remains significantly undervalued relative to its all-time high (ATH) of 4,688.32 EUR, currently sitting 16.85% below that level. Year-to-date performance remains robust at 35.20%, outpacing global equity benchmarks.
| Metric | Value | Change (7d) |
|---|---|---|
| Price (XAU/EUR) | 3,898.29 | -2.46% |
| ATH (EUR) | 4,688.32 | -16.85% |
| YTD Return | 35.20% | – |
| US CPI (YoY) | 3.80% | – |
| Euro Area 10Y Yield | 3.10% | +4.7 bp |
| EUR/USD | 1.1632 | -0.76% |
Calculation: ATH Distance = (3,898.29 – 4,688.32) / 4,688.32 = -16.85%.
Macro Backdrop
Risk sentiment remains neutral as markets weigh sticky inflation against hawkish policy expectations. Equity momentum is moderately positive, led by the Nasdaq Composite (+9.20% 1M) but weighed by underperformance in the DAX (-1.64% 5d) and Hang Seng (-1.68% 5d). The rates backdrop is mixed, with the Euro area 10Y yield at 3.10% and the 2Y spread at 49.4 bp. FX dynamics are mixed, with EUR/USD weakness (1.1632) pressuring the pair while EUR/GBP strength (0.87046) offers support. Key observations include the Nasdaq leading on a 1-month basis and the DAX lagging behind global peers.
Investment Thesis
The primary thesis for Gold centers on its role as a hedge against persistent inflation and geopolitical risk. Despite the Federal Reserve’s hawkish tilt under Chair Kevin Warsh, US inflation remains elevated at 3.8% YoY, reinforcing the metal’s defensive appeal. Structural safe-haven demand, driven by concerns over US fiscal policy and the Iran war, combined with EUR weakness, provides a floor for prices. While higher real yields and dollar strength pose near-term headwinds, the divergence between sticky inflation and slowing growth suggests gold remains an essential allocation for inflation hedging.
Bullish Drivers
- Inflation Persistence: US CPI accelerated to 3.8% YoY, the fastest pace since 2023, and Japan’s PPI rose 4.9% YoY. This data reinforces expectations that the Fed will keep rates elevated longer, supporting gold’s inflation-hedge narrative [T1][T5].
- Geopolitical Risk: The Iran war has amplified uncertainty, driving energy prices up 50% and increasing demand for safe-haven assets [T1].
- Analyst Targets: Commonwealth Bank of Australia and UBS have forecast prices reaching $5,900 and $6,000 respectively by year-end, implying significant upside from current levels [T2][T7].
- Fed Liquidity Concerns: Criticism of Fed Chair Warsh’s plan to shrink the balance sheet highlights concerns about liquidity and fiscal dominance, which typically supports gold [T3].
Relative Positioning vs Bitcoin and Ethereum
Gold maintains its status as the premier safe haven, outperforming traditional equities year-to-date (35.20% vs S&P 500 +8.22%). While Bitcoin dominance stands at 58.25%, gold offers a more stable store of value during periods of geopolitical stress. The Nasdaq’s 1-month outperformance (+9.20%) suggests a risk-on rotation into tech, but gold remains the primary hedge against systemic currency debasement and rate volatility.
Scenario Framework
- Base Case (Hawkish Hold): Inflation remains sticky, keeping the Fed on hold. Gold consolidates in a 3,800–4,200 EUR range.
- Bull Case (Inflation Spike): An energy shock forces the Fed to delay rate cuts or balance sheet normalization. Gold surges toward $5,900–$6,000.
- Bear Case (Rate Shock): Inflation is tamed rapidly, causing yields to spike. Gold falls to 3,500 EUR.
Valuation Discussion
Current valuations present a margin of safety. The price is 16.85% below the ATH, offering a discount to recent highs. Analyst targets of $5,900–$6,000 suggest the current pullback is a buying opportunity. The valuation is supported by the “inflation premium” embedded in the price, particularly given the 50% rise in gasoline prices since the start of the Iran conflict [T1][T7].
Risks
- Rate Hikes: The Fed may remain hawkish longer than anticipated, driving real yields higher and pressuring gold [T1][T5].
- Fed Balance Sheet: Warsh’s plan to shrink the Fed balance sheet could tighten liquidity and spike Treasury yields [T3].
- Dollar Strength: A stronger USD makes gold expensive for international buyers, weighing on demand [T5].
- Profit Taking: A sharp recovery in risk appetite could trigger profit-taking from long-only funds [T5].
Appendix
Sources
- Gold prices steadies as inflation revives higher-rate bets – Mining.com [T1]
- Gold Edges Higher After U.S. Inflation Surged in April – WSJ [T2]
- US debt load could undercut Warsh’s plan to shrink Fed balance sheet – KITCO [T3]
- Gold remains an attractive long-term asset as inflation takes its toll – KITCO [T4]
- Bonds, stocks and precious metals slump as inflation fears mount, silver falls 7% – CNBC [T5]
- Gold and the data the Fed can’t ignore – KITCO [T6]
- UBS: Yen to stay under pressure given the negative energy balance – CNBC [T7]
- Investors should be hedging inflation risk right now, says T. Rowe Price’s Sébastien Page – CNBC [T8]
This report is AI-generated for informational purposes only and does not constitute investment advice. The views expressed herein are those of the AI assistant and do not reflect the official positions of any financial institution or organization.
Important Note / Wichtiger Hinweis:
EN: This report may have been generated using AI. It processes data from publicly available sources. The content is provided for informational purposes only.DE: Dieser Bericht kann mithilfe von KI erstellt worden sein. Dabei werden Daten aus öffentlich zugänglichen Quellen verarbeitet. Die Inhalte dienen ausschließlich Informationszwecken.
* DE: Die ergänzenden Inhalte können KI-generiert sein. EN: The additional content may be AI-generated.