
Listen to the summary
Key Data Snapshot
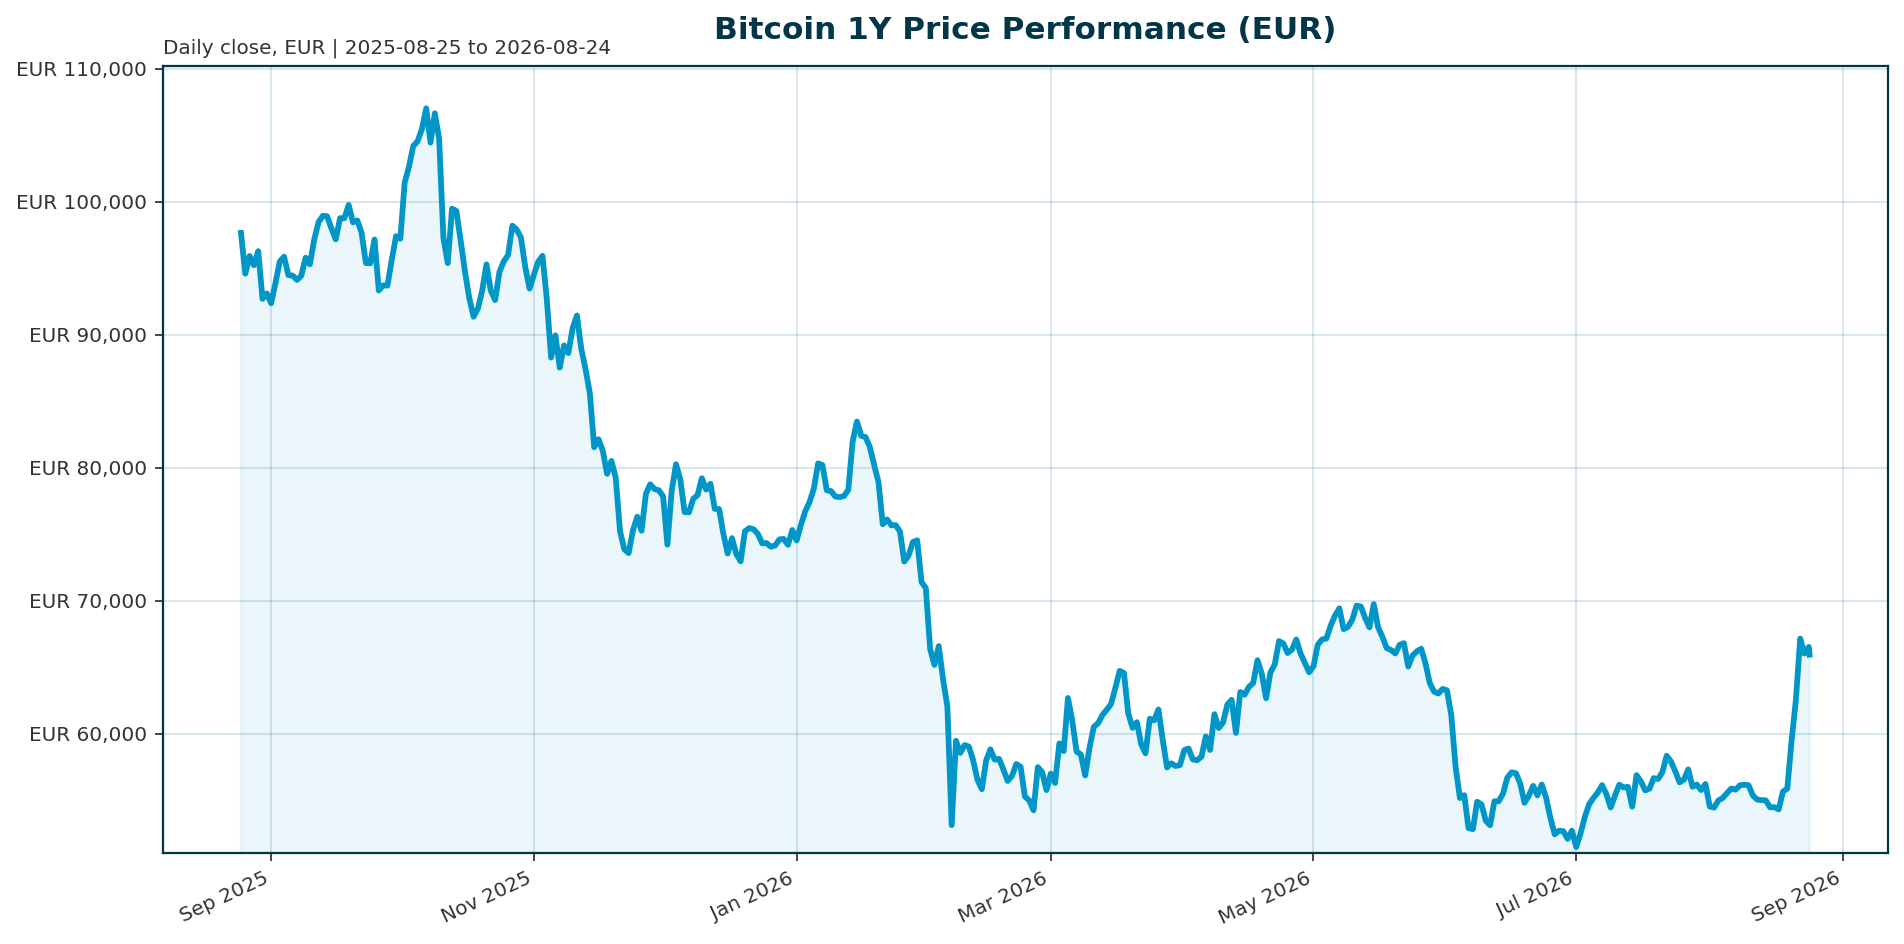
| Metric | Value |
|---|---|
| Price (EUR) | 65,961.00 |
| Market Cap (EUR) | 1.32 T |
| 24h Volume (EUR) | 27.37 B |
| 7d Change | +21.4% |
| 1y Change | -33.1% |
| BTC Dominance | 59.21% |
| ATH (EUR) | 107,662.00 |
| ATH Change | -38.73% |
Market Setup
Risk sentiment is neutral with moderately positive equity momentum. The euro area yield curve presents a mixed backdrop, with the 10-year yield at 3.28%. FX markets are mixed, highlighted by a strong EUR/JPY move. DACH equities are lagging global peers slightly, with the DAX leading on a 1-month basis at 3.90%. The current environment suggests a cautious approach to risk assets, with liquidity conditions tightening as US Treasury yields surge to new highs [T6].Investment Thesis
Bitcoin has fundamentally transitioned from a speculative asset driven by retail speculation and the halving cycle to a regulated, institutional portfolio staple. The market structure has shifted from a purely supply-driven model to one dominated by institutional capital flows. ETF flows have effectively replaced the halving cycle as the primary price driver, with regulated capital movement now dictating market structure [T1][T7].Bullish Drivers
- Institutional Capital Inflows: Spot Bitcoin ETFs are recording consistent daily inflows exceeding $400 million, providing a steady demand floor and signaling that Bitcoin is a legitimate portfolio allocation for traditional investors [T2].
- Regulatory Clarity: The Digital Asset Market Clarity Act scheduled for Senate Banking Committee review in May 2026 could provide the regulatory framework necessary to unlock the next wave of institutional participation [T8].
- Corporate Treasury Accumulation: Corporate treasuries increasingly view Bitcoin as a strategic reserve asset, acting as a long-term store of value and reducing circulating supply [T2].
Relative Positioning vs Gold and Ethereum
Bitcoin maintains dominance at 59.2% of the total crypto market cap [T1]. While both BTC and Ethereum benefit from ETF flows, Bitcoin remains the primary risk-on allocation for institutions. In the “store of value” narrative, Bitcoin competes directly with gold. However, rising US Treasury yields currently pressure the relative appeal of non-yielding assets like BTC compared to sovereign debt [T6]. Ethereum is increasingly viewed as a complementary smart contract layer, but BTC captures the bulk of institutional capital flows due to its first-mover advantage and store-of-value characteristics [T5].Scenario Framework
- Base Case (60%): Sustained ETF inflows and moderate macro conditions support a continued appreciation toward €85,000 to €100,000 by year-end [T2].
- Bull Case (25%): If the Digital Asset Market Clarity Act passes and the Federal Reserve adopts an aggressive easing stance, Bitcoin could target the €150,000 mark [T2][T8].
- Bear Case (15%): Persistent high US Treasury yields and rapid ETF outflows could trigger a retest of the 2025 all-time high around €107,662 [T1][T6].
Valuation Discussion
The current valuation reflects a premium priced for institutional adoption. With a 24h volume of €27.37 billion, liquidity absorption capacity remains high. However, valuation is sensitive to yield compression. At current levels, BTC must compete with sovereign debt which offers a stronger return profile, making the asset vulnerable to macro repricing [T6]. The market cap is currently €1.32 trillion, positioning BTC as a dominant force within the digital asset ecosystem.Risks
- Macro Headwinds: Rising US Treasury yields act as a clear headwind, increasing the opportunity cost of holding a volatile, non-yielding asset [T6].
- Flow Volatility: ETF flows are not a straight line and can flip rapidly based on rate news, price weakness, or regulatory headlines [T5].
- Regulatory Uncertainty: Any reversal or tightening of regulations could freeze institutional inflows and negatively impact market structure [T3].
Appendix
Sources
- Crypto Market 2025: Year-End Review & Expert Insights — TradingView News [T1]
- Bitcoin Price Prediction 2026: Institutional Adoption — Intellectia [T2]
- Crypto Analysis for 2026: Bitcoin, ETFs, Regulation — Blockchain Council [T3]
- BlackRock Bitcoin ETF Achieves Staggering $935M Q1 Inflow Milestone — Binance Square [T4]
- Bitcoin and Ether ETF Inflows Rebound — Blockchain Council [T5]
- US Treasury Yields Surge to New Highs as Liquidity Tightens — CryptoSlate [T6]
- Bitcoin Price Faces a Pivotal Shift: New Market Structure — CryptoRank [T7]
- Bitcoin Price Prediction 2026 — Intellectia [T8]
Disclaimer: This report is AI-generated for informational purposes only and does not constitute investment advice. The views expressed herein are those of the author and do not necessarily reflect the views of Venice.ai or GLM 4.7 Flash. Cryptocurrency investments are subject to high market risk. Please consult with a qualified financial advisor before making any investment decisions.
Important Note / Wichtiger Hinweis:
EN: This report may have been generated using AI. It processes data from publicly available sources. The content is provided for informational purposes only.DE: Dieser Bericht kann mithilfe von KI erstellt worden sein. Dabei werden Daten aus öffentlich zugänglichen Quellen verarbeitet. Die Inhalte dienen ausschließlich Informationszwecken.
* DE: Die ergänzenden Inhalte können KI-generiert sein. EN: The additional content may be AI-generated.