
Listen to the summary
Key Data Snapshot
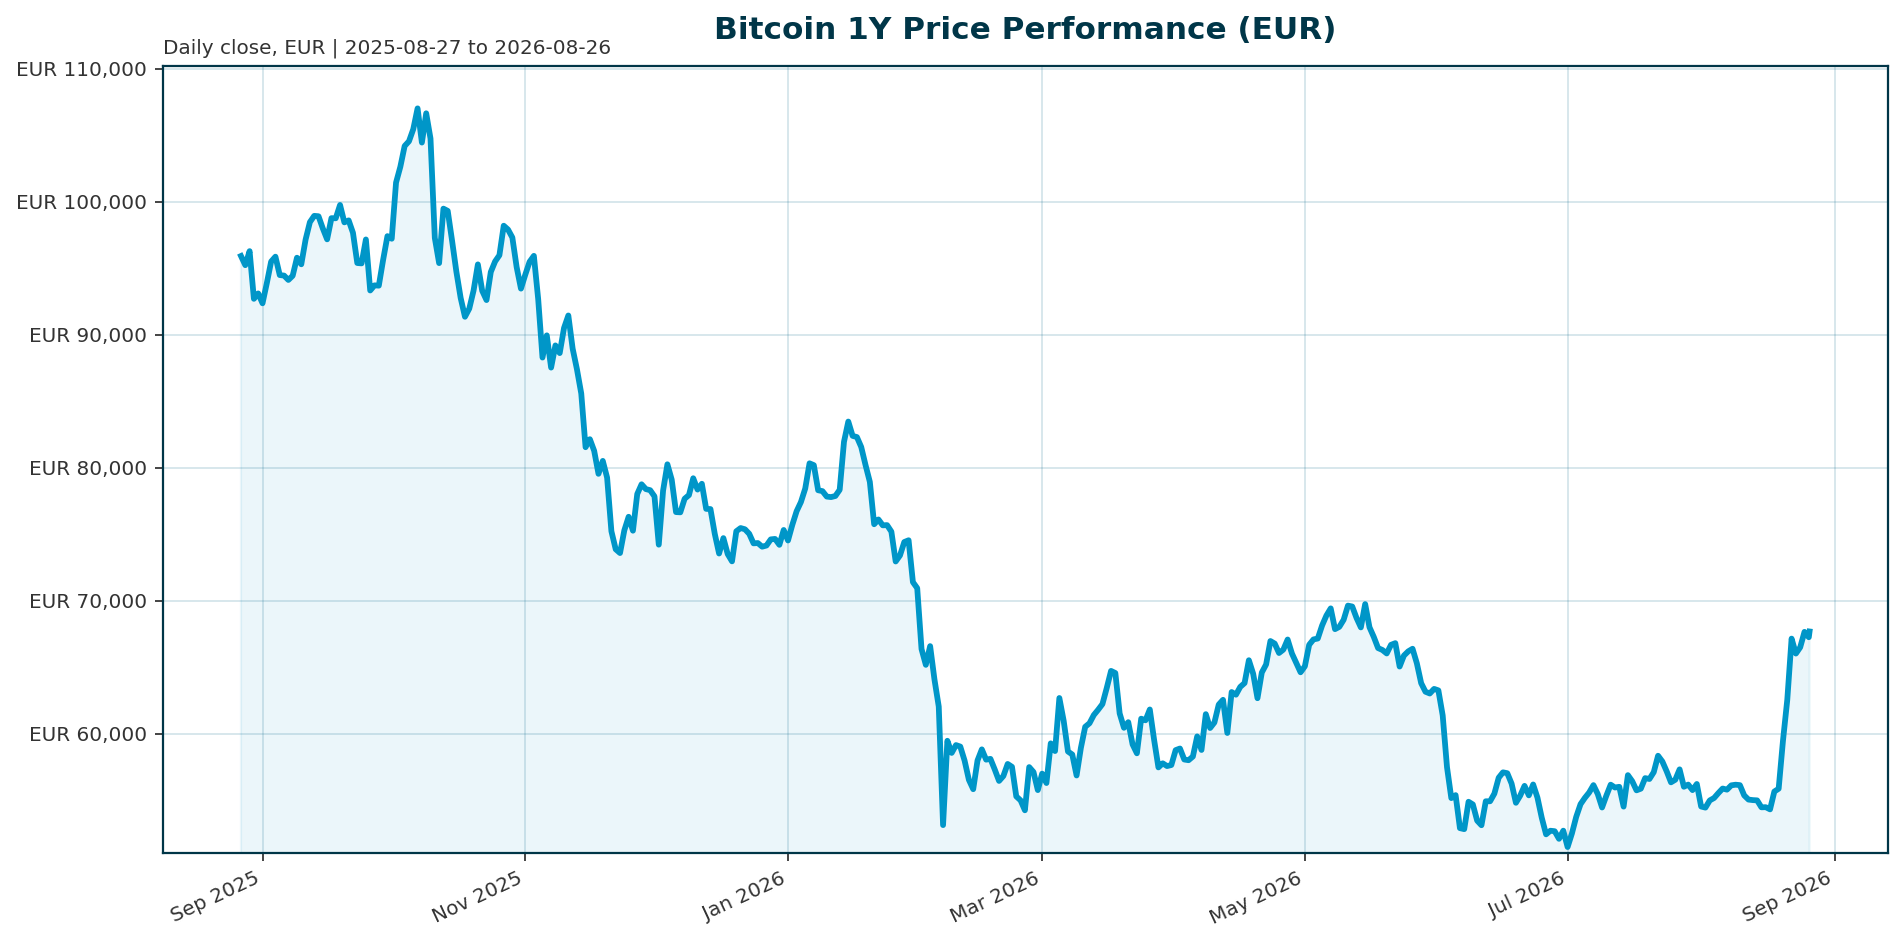
| Metric | Value | Context |
|---|---|---|
| Price (EUR) | 67,743.00 | Current level after 7-day rebound of 23% |
| Market Cap (EUR) | 1.36T | Fully diluted valuation |
| Bitcoin Dominance | 59.28% | Leading crypto asset class |
| 200-Day Return | +12.3% | Long-term uptrend intact |
| 1-Year Return | -27.9% | Post-ATH correction phase |
| All-Time High | 107,662.00 | ATH reached Oct 2025 |
| Volatility (Est.) | ~43% | Compressed from 84% (2024) |
Market Setup
Market sentiment is neutral to positive. The euro area 10Y yield sits at 3.28% with a mixed backdrop. FX is mixed with EUR/USD at 1.1672. Key observations include the ATX outperforming with a 1.20% move versus the Nasdaq lagging at -0.68%. This divergence suggests DACH investors are showing more regional risk appetite than US tech investors. Bitcoin is currently trading at 67,743 EUR, testing support levels after a 20-month low, with volatility compressed to approximately 43% [T1][T6].
Investment Thesis
Bitcoin has transitioned from a speculative curiosity to a legitimate financial asset. The market structure has fundamentally shifted to an “institutional supply era” where ETF flows act as the primary macro indicator [T1][T3]. This structural shift is supported by the fact that 94% of institutional investors now recognize the long-term value of blockchain technology [T2]. The asset is maturing, with volatility decreasing significantly from 84% to 43%, indicating it is evolving into a more stable, allocatable line item for institutions [T1].
Bullish Drivers
Key bullish catalysts include the Digital Asset Market Clarity Act scheduled for Senate review, which could unlock the next wave of institutional participation [T5]. JPMorgan Chase projects a $150,000 peak target by Q4 2026 using a flow-based valuation model, emphasizing structural demand from ETFs and corporate treasuries [T2]. Ark Invest maintains a more aggressive target of $200,000 by 2026, focusing on Bitcoin capturing market share from gold [T2]. Corporate treasury accumulation and the expansion of regulated investment vehicles continue to provide steady demand [T3][T7].
Relative Positioning vs Gold and Ethereum
Bitcoin maintains dominance at 59.28%, serving as the benchmark for broader crypto trends [T1]. While Ethereum competes for capital, Bitcoin is increasingly viewed as the primary store-of-value proxy within the digital asset class. Projections suggest Bitcoin may capture significant market share from traditional store-of-value assets like gold as adoption accelerates [T2]. The ETF channel has become central to Bitcoin’s market structure, providing institutions with a regulated, liquid way to add exposure [T4][T7].
Scenario Framework
- Base Case: ETF flows stabilize and US Treasury yields remain contained. Price targets range from $100,000 to $120,000 by year-end [T5].
- Bull Case: Regulatory clarity via the Clarity Act and daily ETF inflows exceeding $500 million drive a breakout. Price targets reach $150,000 to $200,000 [T2][T5].
- Bear Case: Persistent US Treasury yield surges and continued ETF outflows (such as the recent 13-day $4.4 billion streak) trigger de-risking. This risks a retest of the $60,000 support level [T4][T8].
Valuation Discussion
Valuation is increasingly driven by institutional flow models rather than pure scarcity. JPMorgan’s model suggests the traditional halving cycle dynamics have been augmented by new institutional demand vectors [T2]. Conservative models project Bitcoin reaching $85,000 to $118,000 during 2026, contingent on favorable Federal Reserve policy shifts [T5]. Ark Invest’s aggressive long-term projection of $1,000,000 by 2030 relies on Bitcoin becoming a dominant global reserve asset [T2].
Risks
- Macro Headwinds: Rising US Treasury yields are acting as a clear headwind. As yields move higher, the relative appeal of government debt improves, raising the opportunity cost of holding a volatile, non-yielding asset like BTC [T4].
- Flow Reversal: ETF outflows can amplify volatility just as easily as they support rallies. Recent outflows demonstrate that institutional participation can lead to sharp de-risking moves [T7][T8].
- Regulatory Uncertainty: Failure of the Digital Asset Market Clarity Act or a reversal in policy could dampen institutional participation [T5].
Appendix
Sources
- Crypto Market 2025: Year-End Review & Expert Insights [T1]
- Bitcoin Price Prediction 2026: Institutional Adoption & ETF Impact Analysis [T2]
- Crypto Analysis for 2026: Bitcoin, ETFs, Regulation [T3]
- US Treasury yields surge to new highs as liquidity tightens, pushing Bitcoin back below $82,000 resistance [T4]
- Bitcoin Price Prediction 2026: Institutional Adoption & ETF Impact Analysis [T5]
- Bitcoin Tests $70,000 As Intraday Squeeze Lifts Market – CryptoRank [T6]
- Bitcoin Outlook: ETF Outflows, Institutional Adoption & Price Forecast 2026 | IG South Africa [T7]
- Bitcoin’s drop to a 20-month low is testing whether the institutional adoption story was ever real – Startup Fortune [T8]
This report is AI-generated for informational purposes only and does not constitute investment advice. The views expressed are those of the AI assistant GLM 4.7 Flash and should not be taken as financial guidance. Always conduct your own research and consult with a qualified financial advisor before making investment decisions.
Important Note / Wichtiger Hinweis:
EN: This report may have been generated using AI. It processes data from publicly available sources. The content is provided for informational purposes only.DE: Dieser Bericht kann mithilfe von KI erstellt worden sein. Dabei werden Daten aus öffentlich zugänglichen Quellen verarbeitet. Die Inhalte dienen ausschließlich Informationszwecken.
* DE: Die ergänzenden Inhalte können KI-generiert sein. EN: The additional content may be AI-generated.