
Listen to the summary
Key Data Snapshot
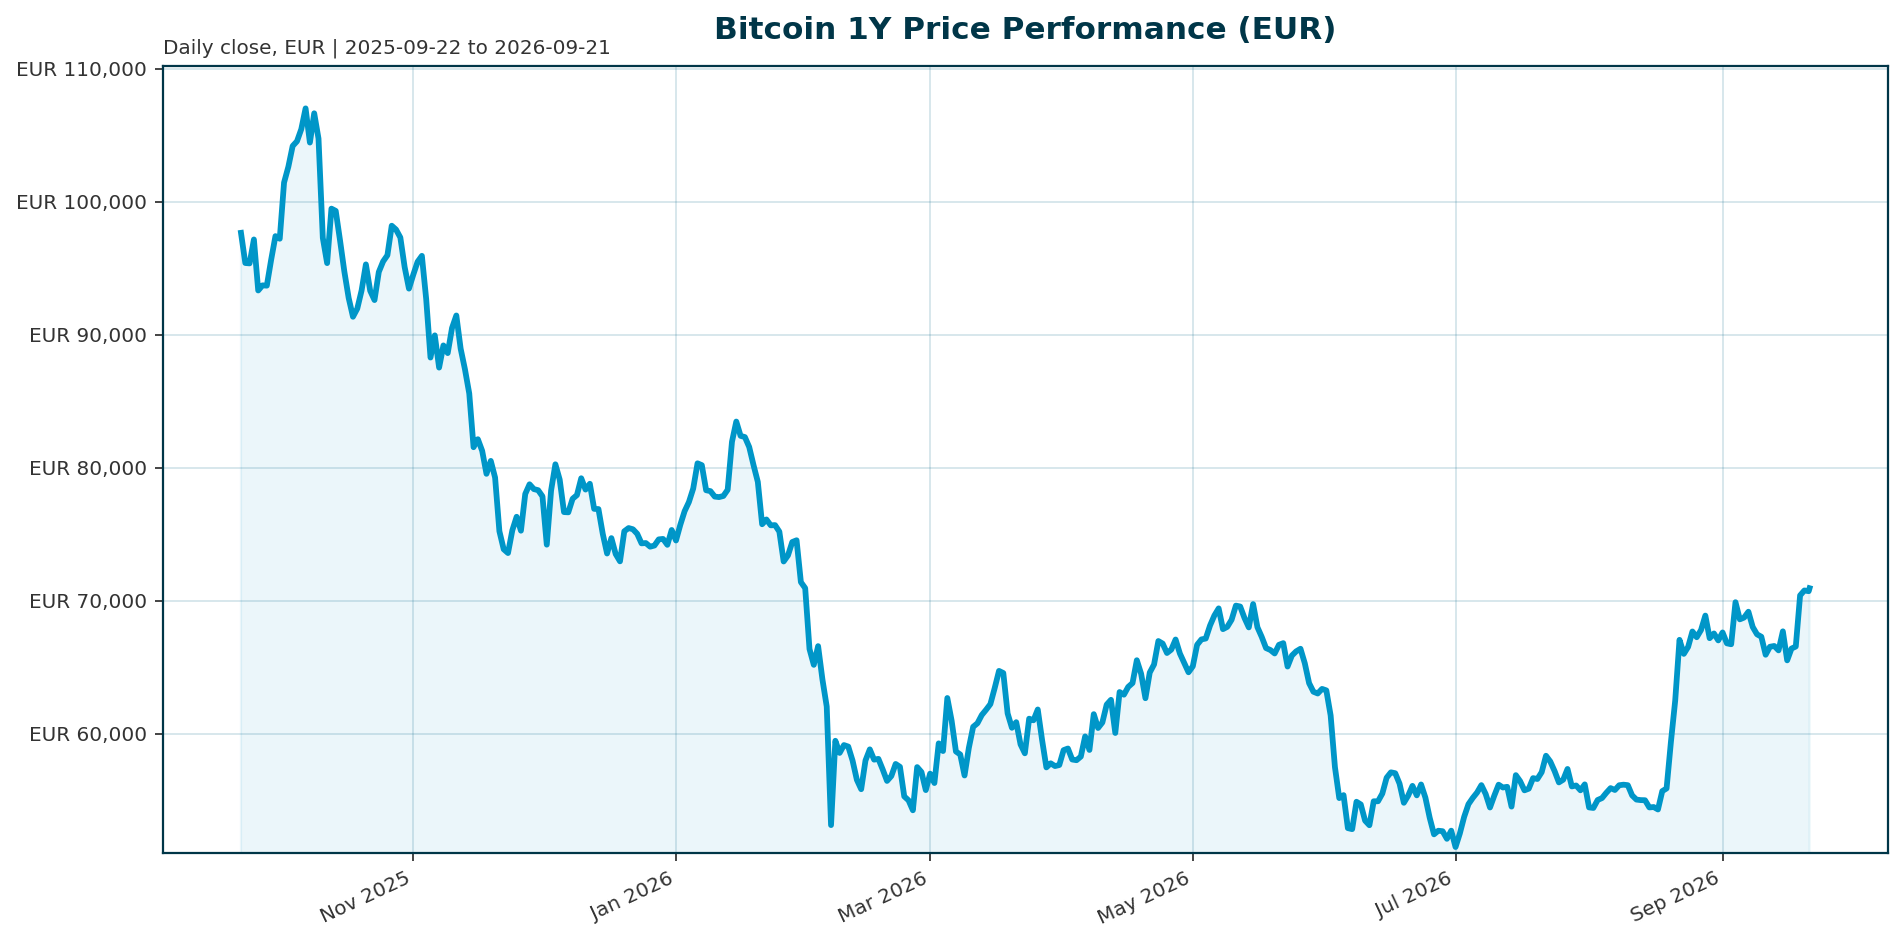
| Metric | Value | Note |
|---|---|---|
| Price (BTC/EUR) | EUR 70,833 | 24h high/low: EUR 71,466 / EUR 69,848 |
| Market capitalization | EUR 1.4226 trillion | Rank 1 among crypto assets |
| 24h volume | EUR 21.63 billion | ~1.52% of market cap (21,625,508,635 / 1,422,591,805,827) |
| Performance 24h / 7d / 30d | +1.14% / +4.9% / +3.8% | Short-term momentum positive |
| Performance 200d / 1y | +12.2% / −29.7% | Recovery trade, not an all-time-high breakout |
| All-time high | EUR 107,662 (6 Oct 2025) | Current price 34.21% below ATH |
| Circulating / max supply | 20,087,237 / 21,000,000 BTC | 95.65% of max supply circulating; 912,763 BTC remaining |
| BTC dominance | 58.15% | Share of EUR 2.4413 trillion total crypto market cap |
| EUR/USD reference | 1.1493 | Implied USD-equivalent price ≈ USD 81,412 (70,833 × 1.1493) |
Market Setup
Cross-asset conditions are neutral rather than decisively supportive. Risk sentiment is neutral, euro-area yields are mixed with a flattening curve, and FX conditions are mixed. DACH indicators average −0.01% over five days versus +1.22% for global equity indicators, with the DAX the weakest five-day performer at −0.54% and the Nikkei 225 the strongest at +2.40%. The euro-area AAA 10Y yield stands at 3.49%, down 3.5 bp over five days, and the AAA 10Y-2Y spread is 33.9 bp. EUR/USD trades at 1.1493, down 0.15% over five days.
Against this backdrop, Bitcoin’s market structure has changed more than its price. ETF flows are repeatedly cited as Bitcoin’s new macro indicator and the most tangible gauge of institutional capital rotation [T1][T2]. At the same time, rates and liquidity conditions act as a key constraint: higher Treasury yields raise the opportunity cost of holding a non-yielding asset and have made institutional buyers more selective [T4]. For EUR-based allocators, the 3.49% AAA 10Y yield means BTC competes directly with a positive-yielding sovereign curve, complicating a pure liquidity-beta thesis.
Investment Thesis
Bitcoin is a scarce, increasingly regulated and institutionally accessible asset whose price discovery is now driven primarily by ETF flows, macro liquidity and adoption channels rather than retail speculation. Spot ETFs, corporate treasuries and regulated vehicles have made BTC an allocatable line item for registered investment advisors, private banks and institutions [T1]. By end-2025, roughly 6.7 million BTC reportedly sat across ETFs, exchanges and treasuries, and institutional entities now hold approximately 18.5% of the fixed 21 million supply cap [T1][T8].
The base case treats BTC as an institutionalizing scarce asset whose returns remain conditional on ETF demand and macro liquidity. The upside case rests on a higher-quality, more durable demand base replacing speculative retail cycles. The downside case is straightforward: if ETF demand slows or treasury-company issuance capacity weakens as equity premiums compress, institutionalization alone may not drive near-term appreciation [T6]. With BTC trading 34.21% below its October 2025 high and 29.7% lower over one year, positioning today is a recovery trade with structural support, not a momentum trade at highs.
Bullish Drivers
- ETF-flow recovery: ETF inflows have revived bullish sentiment and institutional demand is visible again in cited commentary [T3]. Early-May data showed approximately USD 467 million in net inflows on a single day, the fourth consecutive day of positive flows [T7].
- Broadening institutional access: Regulated products continue to widen the investor base, and product innovation such as covered-call crypto ETFs, multi-asset index products and institutional model portfolios could deepen ETF-flow relevance [T5].
- Regulatory catalyst: The CLARITY Act would establish a federal market-structure framework and could unlock broader institutional participation if passed [T2]. Clarity in custody, market structure and tax treatment could pull sidelined institutions in [T5].
- Fixed supply: 95.65% of the 21 million maximum supply is already circulating, leaving only 912,763 BTC to be issued. Scarcity amplifies demand shocks in either direction.
- Recovery momentum: Positive 7-day (+4.9%), 30-day (+3.8%) and 200-day (+12.2%) returns in EUR terms show accumulation is underway.
- Dominance: At 58.15% of total crypto market capitalization, BTC remains the sector’s core allocation reference and the primary lens for crypto risk sentiment [T6].
The counterweight: these drivers require confirmation. Sustained inflows over several weeks, not single strong days, provide structural support for price [T5].
Relative Positioning vs Gold and Ethereum
BTC sits between its two benchmarks. Against gold, it offers harder programmable scarcity (a fixed 21 million cap versus gold’s uncertain and elastic supply response) but materially higher volatility and stronger sensitivity to rates and ETF flows. A cited 2025 review noted BTC lagged traditional assets like gold and bonds during the Q4 2025 correction, underscoring that BTC remains a high-beta corner of global markets even in the institutional era [T1]. Against Ethereum, BTC is the more store-of-value oriented, flow-sensitive and dominant asset, with 58.15% crypto-market dominance versus ETH’s smart-contract and tokenization beta.
Data limitation: No current gold price, gold market-cap proxy, ETH price, ETH market cap or ETH return data is provided in this bundle. Both BTC and ETH ETF flows are discussed in cited sources, including record joint outflows in Q4 2025 and subsequent rebound commentary [T1][T5], so the quantitative comparison here must remain qualitative until benchmark pricing is supplied.
Scenario Framework
- Bull case: Sustained ETF inflows, CLARITY Act passage and stable-to-easier liquidity conditions support a recovery toward prior highs. BTC’s fixed supply and 58.15% dominance would amplify the move. Signposts: multi-week positive ETF flow streaks [T5], regulatory progress [T2], and EUR price reclaiming the EUR 73,900 to 78,300 zone that maps the USD 85,000 to 90,000 resistance discussed in cited technical commentary [T7] (converted at EUR/USD 1.1493).
- Base case: BTC remains range-bound to moderately constructive, supported by institutional access and scarcity but capped by neutral risk sentiment, a 3.49% euro AAA 10Y yield and expected Fed policy restraint under Chair Warsh through Q3 [T2]. The current EUR 69,848 to 71,466 range and the +12.2% 200-day return frame the consolidative picture.
- Bear case: ETF flows stall or reverse, yields rise and liquidity tightens, and BTC trades again as a high-beta non-yielding asset. The Q4 2025 episode is the template: record ETF outflows coincided with BTC breaking support near USD 98,000 (≈EUR 85,265) and retesting the low USD 90,000 range [T1]. A repeat would put the USD 80,000 level (≈EUR 69,608) back in focus as the critical support cited in market commentary [T3][T7].
Valuation Discussion
BTC has no cash flows, so valuation rests on scarcity, adoption and liquidity rather than discounting models. Three reference points frame the current level:
- Supply-based scarcity: At EUR 70,833 with 20,087,237 BTC circulating, mechanical market cap equals EUR 70,833 × 20,087,237 ≈ EUR 1.4226 trillion, matching the reported EUR 1,422,591,805,827. A max-supply-based fully diluted valuation would be EUR 70,833 × 21,000,000 = EUR 1,487,493,000,000. The reported FDV of EUR 1,422,593,576,344 instead reflects total supply (20,087,262 BTC), meaning the quoted FDV understates the theoretical max-supply figure by roughly EUR 64.9 billion. The difference is cosmetic given issuance ends near current levels, but the methodology mismatch should be flagged.
- Drawdown-anchored entry: BTC trades 34.21% below its EUR 107,662 all-time high. Historical precedent shows drawdowns of this depth have preceded both further downside and strong recoveries; the valuation case depends on whether institutional demand re-accelerates.
- Volatility-adjusted framing: Cited analysis puts Bitcoin volatility down from 84% to 43%, indicating maturation toward a more stable institutional asset [T1]. Yet the current 24-hour range of EUR 1,618 (2.28% of price) still implies elevated short-horizon risk. A 43% annualized volatility profile is roughly double that of equities and several times gold’s; risk sizing must reflect this even in the institutionalized regime.
Upside valuation rests on persistent marginal ETF demand against essentially fixed supply. Downside rests on the non-yielding nature becoming more punitive as sovereign yields near 3.5% in euros and higher in dollars [T4].
Risks
- Macro and rates: Rising Treasury yields are a clear macro headwind, raising the opportunity cost of holding a volatile, non-yielding asset and making institutional buyers more selective [T4]. The Fed is expected to hold rates through Q3 under Chair Warsh, limiting the easing that historically supported risk-asset recoveries [T2].
- ETF-flow reversal: When flows weaken, the spot market loses one of its clearest sources of marginal demand [T4]. Record Q4 2025 outflows coincided with support breaks and a near-30% drawdown from peak, erasing more than USD 1 trillion in market value [T1]. ETF inflows also slowed in 2025 versus 2024 [T6].
- Treasury-company fragility: Digital asset treasury firms may face a tougher path issuing equity as premiums compress, limiting their ability to drive another impulse higher without a clear risk-on backdrop [T6].
- Regulatory uncertainty: Regulatory uncertainty continues to constrain short-term price growth [T8], and the CLARITY Act remains a potential rather than realized catalyst [T2].
- Residual crypto volatility: Even with structural maturation, BTC remains high-beta [T1]. The 2.28% 24-hour range and the −29.7% one-year return are direct evidence.
- Data limitations: This report lacks on-chain metrics, futures positioning, daily ETF flow tables, options data and realized volatility measures, and cited USD technical levels involve timing mismatch when converted to EUR.
Appendix
Methodology and Calculations
- 24h range: EUR 71,466 − EUR 69,848 = EUR 1,618; EUR 1,618 / EUR 70,833 ≈ 2.28% of price.
- Volume-to-market-cap: EUR 21,625,508,635 / EUR 1,422,591,805,827 ≈ 1.52%.
- Circulating supply share: 20,087,237 / 21,000,000 = 95.65%; remaining issuance 912,763 BTC.
- Market cap check: EUR 70,833 × 20,087,237 ≈ EUR 1.4226 trillion, consistent with reported figure.
- FDV reconciliation: reported FDV = price × total supply (20,087,262 BTC) = EUR 1,422,593,576,344. Max-supply FDV = EUR 70,833 × 21,000,000 = EUR 1,487,493,000,000.
- Implied USD price: EUR 70,833 × 1.1493 ≈ USD 81,412.
- USD-to-EUR conversions of cited technical levels (indicative, at EUR/USD 1.1493, timing mismatch noted): USD 80,000 ≈ EUR 69,608; USD 82,000 ≈ EUR 71,349; USD 85,000 ≈ EUR 73,960; USD 90,000 ≈ EUR 78,312; USD 98,000 ≈ EUR 85,265.
- Distance to ATH: 70,833 / 107,662 − 1 = −34.21%, consistent with the reported −34.2078%.
- Market-cap share of total crypto: 1,422,591,805,827 / 2,441,279,961,303 ≈ 58.27%, close to the reported 58.15% dominance figure.
Data Limitations
Market data reflects a snapshot retrieved 2026-09-21 04:15 UTC; equity and rates context is as of 2026-09-17 to 2026-09-21 depending on instrument. No current gold or Ethereum pricing is included despite both being specified benchmarks; the relative positioning section is therefore qualitative. Several cited sources carry no publication date, and their USD-denominated technical levels are time-specific references rather than current EUR quotes. News-derived institutional holdings figures (6.7 million BTC across ETFs, exchanges and treasuries; 18.5% of supply cap) are attributed to the cited summaries and are not independently verified here.
Sources
- [T1] Crypto Market 2025: Year-End Review & Expert Insights — tradingview.com
- [T2] Q2 2026 Digital Asset Review — coindesk.com
- [T3] Bitcoin Holds Near $80K–$81K as ETF Inflows Revive Bullish Sentiment — hedgeco.net
- [T4] US Treasury yields surge to new highs as liquidity tightens, pushing Bitcoin back below $82,000 resistance — cryptoslate.com
- [T5] Bitcoin and Ether ETF Inflows Rebound — blockchain-council.org
- [T6] Kraken sees 2026 crypto markets shifting from hype to structure as macro forces reshape bitcoin cycle — theblock.co
- [T7] Bitcoin Price Analysis May 2026 — intellectia.ai
- [T8] The End of Bitcoin’s Four-Year Cycle? How ETFs and Institutions Are Reshaping the Market — wolfandco.com
Disclaimer
This report is AI-generated and provided for informational purposes only. It does not constitute investment advice, a recommendation, or an offer to buy or sell any financial instrument. Data may be incomplete, delayed or inaccurate, and readers should independently verify all figures before making any investment decision.
Important Note / Wichtiger Hinweis:
EN: This report may have been generated using AI. It processes data from publicly available sources. The content is provided for informational purposes only.DE: Dieser Bericht kann mithilfe von KI erstellt worden sein. Dabei werden Daten aus öffentlich zugänglichen Quellen verarbeitet. Die Inhalte dienen ausschließlich Informationszwecken.
* DE: Die ergänzenden Inhalte können KI-generiert sein. EN: The additional content may be AI-generated.