
Listen to the summary
Key Data Snapshot
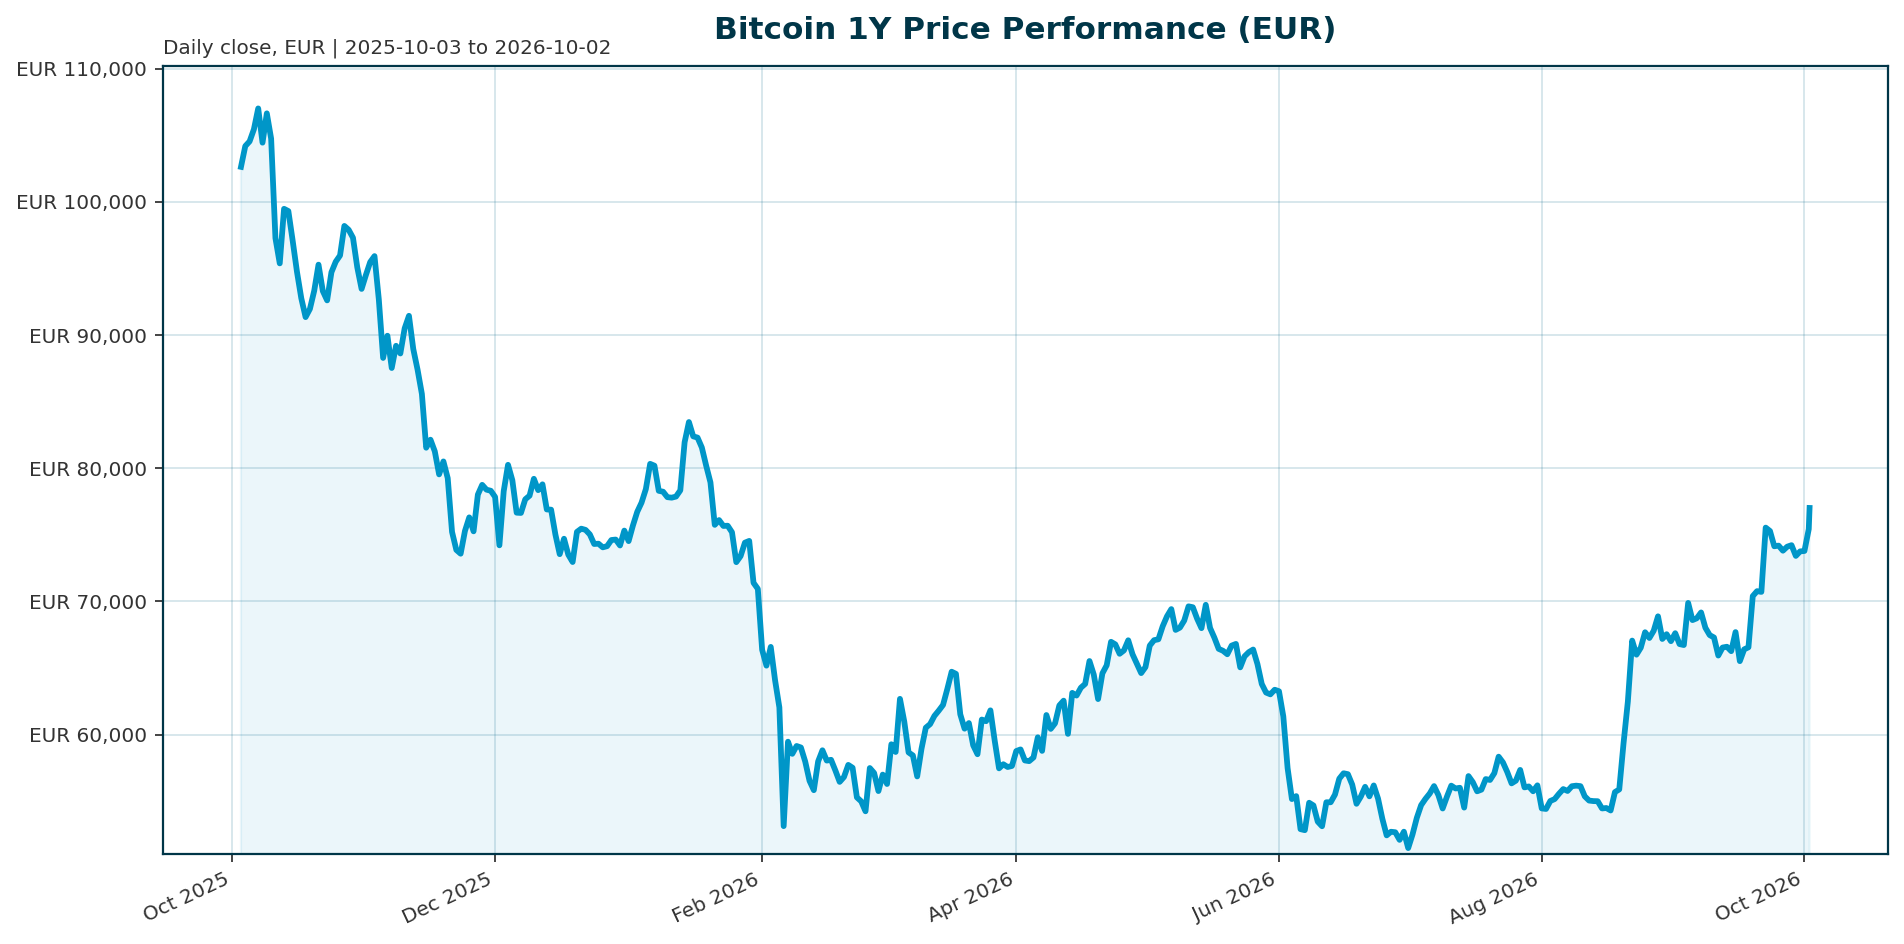
| Metric | Value | Comment |
|---|---|---|
| Price (EUR) | EUR 75,952 | 24h range EUR 73,925 to 76,030 (2.85% width) |
| Change 1h / 24h / 7d | +0.41% / +2.61% / +1.55% | Short-term momentum positive |
| Change 14d / 30d | +11.15% / +10.64% | Recovery under way; 14d versus 30d gap of roughly 0.5pp signals recent acceleration |
| Change 200d / 1y | +17.95% / -28.07% | Corrective regime: solid medium-term recovery inside a deeply negative annual return |
| Market cap | EUR 1.526 trillion | Rank #1; 58.74% BTC dominance; total crypto market cap EUR 2.595 trillion |
| 24h volume | EUR 31.03 billion | Turnover of 31.03bn / 1,526.16bn = ~2.03% of market cap |
| Supply | 20,092,228 / 21,000,000 | 95.68% mined; 907,772 BTC remain unmined |
| Fully diluted valuation | EUR 1.526 trillion | Equals market cap because issuance is near complete; terminal FDV at current price = 21,000,000 x 75,952 = ~EUR 1.595 trillion (+4.5% uplift) |
| All-time high | EUR 107,662 (2025-10-06) | Current price at -29.45%; recovery to ATH requires +41.7% |
| All-time low | EUR 51.30 (2013-07-04) | Context only; early-era EUR conversion methodology is not verifiable |
Framing: BTC trades in the EUR 73,000 to 77,000 band near-term, with the 24h range as the immediate reference window. The 14d and 30d gains of roughly 11% sit against a 1-year loss of 28.1%, the signature of an early-stage recovery within a post-ATH correction rather than a confirmed new bull leg.
Market Setup
The broader backdrop is neutral to negative for risk, with mixed equity momentum and DACH equities clearly lagging: DACH indicators average -2.83% over five days versus -0.13% for global equity benchmarks, with the ATX the weakest performer at -3.82% and the Nikkei 225 the strongest at +3.65%. Rates are mixed with curve steepening: the euro-area AAA 10Y yield sits at 3.58% (+1.5bp over 5 days), the 2Y at 3.16% (-7.0bp over 5 days), producing a 10Y-2Y spread of 42.2bp, and the whole curve has built 24 to 30bp over the past month. FX is mixed: EUR/USD at 1.1312 (-0.75% over 5 days, -2.37% over 1 month, -3.73% YTD). These data are subordinate to the Bitcoin analysis but matter directly: elevated euro yields raise the opportunity cost of holding a non-yielding asset, and US yield pressure has already been identified as a macro headwind that makes institutional buyers more selective [T5]. Under Fed Chair Kevin Warsh, the US central bank is expected to hold rates through Q3, limiting the policy-easing tailwind that historically supports high-beta recoveries [T2]. A weaker EUR mechanically inflates EUR-quoted BTC returns; a reversal toward EUR strength would suppress them even if the USD price holds.
Investment Thesis
The core thesis: Bitcoin has transitioned from a halving-cycle-driven speculative asset into an ETF- and macro-led allocatable asset whose marginal price is set by regulated fund flows. ETF flows now function as Bitcoin’s leading macro indicator; record Q4-2025 outflows from US-listed BTC and ETH ETFs coincided with the break of $98,000 support and a retest of the low $90,000 range [T1]. Continuous institutional flows have displaced the four-year halving cycle as the primary valuation driver [T6]. At end-2025, 6.7 million BTC sat across ETFs, exchanges, and treasuries, which Glassnode labeled the “institutional supply era” [T1]. Realized volatility compressed from 84% to 43%, evidence of institutionalization and of a larger addressable allocation base [T1]. The demand channel is active again: late August 2026 saw $1.92 billion in weekly ETF inflows, concentrated in BlackRock’s IBIT [T8], after recurring daily inflows above $400 million through 2026 [T3]. Against this stands a fixed supply cap of 21 million with 95.7% already mined, so demand, not issuance, sets the price. The thesis is credible but flow-dependent: the same channel that powered the rally delivered the Q4-2025 drawdown in which more than $1 trillion of crypto market value was erased and BTC fell nearly 30% from its peak, lagging gold and bonds [T1].
Bullish Drivers
- ETF flow momentum: $1.92 billion in weekly inflows in late August 2026, with IBIT dominant, indicates positioning ahead of upside rather than reaction to it [T8]. May 2026 recorded a $467 million single-day net inflow, the fourth consecutive positive day [T7].
- Structural adoption: Corporate treasury holdings are projected to surpass $250 billion and more than 100 new crypto-linked ETFs are expected, deepening the regulated wrapper ecosystem [T4].
- Regulatory catalysts: The US CLARITY Act would establish a federal market-structure framework and could unlock broader institutional participation if passed [T2]. Hong Kong’s Stablecoins Ordinance sets a global benchmark for prudentially compatible tokenization [T2].
- Supply scarcity: 95.68% of the 21 million cap is mined; institutional absorption of the remaining float tightens effective supply [T1].
- Volatility compression: The fall from 84% to 43% realized volatility makes BTC allocatable for registered investment advisors, private banks, and treasury mandates, expanding aggregate demand capacity [T1].
- Third-party projections: Analytics platforms project $85,000 to $132,000 for 2026, with some institutional paths toward $150,000; treat these as estimates, not consensus [T3].
Balanced view: each driver is real but conditional. The bull case requires flows to persist; the Q4-2025 episode shows the same infrastructure transmits outflows with equal force [T1].
Relative Positioning vs Gold and Ethereum
Gold and Ethereum price and performance data are not available in the underlying dataset, so this section is qualitative and cannot compute gold/BTC or ETH/BTC ratios; both are explicitly flagged as unavailable. What the record shows: during the Q4-2025 correction, BTC lagged traditional assets including gold and bonds, while more than $1 trillion was erased from crypto [T1]. Gold competes for the same store-of-value allocation, and rising government bond yields improved the appeal of debt relative to both non-yielding assets, BTC and gold alike [T5]. BTC’s differentiator is its hard 21 million cap versus gold’s supply elasticity; its liability is materially higher beta even in the compressed 43% volatility regime [T1]. Within crypto, BTC dominance of 58.74% over a EUR 2.595 trillion total market confirms Bitcoin’s gravitational position. ETH competes on a different axis: Asian institutional adoption is deploying through real-world-asset tokenization and regulated stablecoins, areas where ETH-linked infrastructure captures flows and pure bitcoin ETFs play a smaller strategic role than in North America and Europe [T2]. Q4-2025 outflows hit BTC and ETH ETFs simultaneously, showing the two are correlated institutional risk vehicles, not hedges for each other [T1]. Scenarios: sustained 43% volatility and stable flows would narrow BTC’s credibility gap with gold; a persistent high-rate regime keeps gold and bonds favored and BTC structurally high-beta; a tokenization-led adoption wave would rotate incremental institutional capital toward ETH and compress BTC dominance from 58.7%, while pure store-of-value demand would re-concentrate flows into BTC.
Scenario Framework
All scenarios are labeled assumptions, not forecasts. USD-quoted levels are converted at EUR/USD 1.1312 and inherit that FX basis.
- Bull (assumption): The CLARITY Act passes and/or the Fed eases in H2 2026; weekly ETF inflows sustain above $1 billion [T2, T8]. BTC retests the EUR 107,662 ATH and enters the $100,000 to $150,000 projection corridor, equivalent to roughly EUR 88,400 to 132,600 [T3]. Trigger: four or more consecutive weeks of positive net ETF flows above $1 billion plus a legislative milestone.
- Base (assumption): The Fed holds through Q3 [T2], the CLARITY Act stalls, and ETF flows alternate weekly between positive and negative. BTC trades within an EUR-equivalent band of roughly $70,000 to $95,000, or EUR 61,870 to 83,980, ending 2026 modestly above current levels. Trigger: flows oscillating around zero, euro 10Y AAA yield pinned near 3.6%.
- Bear (assumption): Outflows accelerate in a renewed high-yield, tightening-liquidity regime [T5], and a repeat of the Q4-2025 pattern produces a 20% to 30% drawdown, taking BTC below the $80,000 structural support observed in May 2026, or roughly EUR 70,700 [T1, T7]. Applied to the current price, a 20% to 30% drawdown implies EUR 60,760 to 53,170. Trigger: two consecutive weeks of record-scale outflows or a break of the 14d/30d recovery trend.
Trigger dashboard: (i) weekly ETF net flows, the single most important observable [T1, T8]; (ii) CLARITY Act legislative status [T2]; (iii) euro 10Y AAA yield direction and the 10Y-2Y spread; (iv) EUR/USD; (v) BTC dominance trend.
Valuation Discussion
Market cap equals fully diluted valuation at EUR 1.526 trillion because 95.68% of supply is issued; the terminal FDV at the current price is approximately EUR 1.595 trillion, a +4.5% uplift at full issuance. The valuation anchor is the ATH: at EUR 75,952, BTC is 29.45% below the EUR 107,662 high of October 2025, which roughly matches the nearly 30% peak-to-trough drawdown of Q4-2025 [T1]. Read two ways, bullish and bearish: the drawdown math suggests the flow shock is largely priced in, so further downside requires new negative catalysts rather than mean reversion of the prior correction; conversely, the price has as yet no confirmation of a new demand regime, and the 1-year return of -28.07% warns against anchoring on the ATH as fair value. The opportunity-cost framework matters for a non-yielding asset: with the euro AAA 10Y at 3.58% and US yields surging, government debt offers a stronger risk-adjusted return profile that competes directly for institutional capital [T5]. The compressed 43% volatility regime changes position sizing, not fundamental value; lower volatility permits larger aggregate allocations, which is demand-accretive over time [T1]. Third-party projections of $85,000 to $132,000 for 2026 [T3] imply EUR-quoted upside of roughly -2% to +54% at the current FX rate; if price reached the upper bound, EUR valuation would exceed the ATH by more than 20% with no change in cash-flow fundamentals, since BTC generates none. That upper range is flow-dependent, not fundamental, and should be flagged as such. EUR translation sensitivity: holding the USD price constant, a +/-1% move in EUR/USD shifts EUR-quoted returns by approximately +/-1%; the -3.73% YTD EUR/USD decline has flattered EUR-quoted performance. Intraday realized range of 2.85% over 24 hours indicates contained short-term volatility consistent with the institutional regime.
Risks
- Flow-reversal risk: The realized precedent is record Q4-2025 ETF outflows and a $1 trillion market-cap wipeout [T1]. The ETF channel transmits outflows as efficiently as inflows.
- Rate and liquidity risk: A Fed hold through Q3 under Chair Warsh limits easing support [T2], and rising Treasury yields raise the opportunity cost of holding BTC [T5]. The timing and effect of the US Treasury bond buyback program beginning in September is a double-edged liquidity factor [T8].
- Concentration risk: IBIT’s dominance of inflows creates single-issuer dependence within the ETF channel; idiosyncratic fund redemptions could transmit into the spot market independent of BTC fundamentals [T8].
- Regulatory-execution risk: CLARITY Act non-passage or delay into 2027 would collapse the regulatory leg of the bull case [T2].
- Persistent high-beta risk: Even in the institutional era, crypto remains a high-beta corner of global markets, as the 2025 underperformance versus gold and bonds demonstrated [T1].
- EUR-translation risk: EUR/USD at 1.1312 with a -3.73% YTD move means EUR strength would erode EUR-quoted returns even if USD performance holds.
- Data and flow staleness: The most recent weekly ETF flow figure in the source set dates from late August 2026 [T8]; current flow momentum is unknown and must be verified before acting.
- Forecast dispersion: The $85,000 to $150,000 projection spread evidences wide model uncertainty and should not be treated as a consensus anchor [T3].
Appendix
Methodology and Data Caveats
Market data derives from the CoinGecko composite, retrieved 2026-10-02T04:15Z, quoted in EUR. Market-overview data is as of 2026-10-01/02. News items are undated or partially stale relative to the report date; ETF flow figures are USD-quoted and require conversion at prevailing rates, introducing FX basis into cross-source comparisons. USD-quoted price and technical levels in this report are approximations using EUR/USD 1.1312. Sources T3, T4, and T7 are marketing-adjacent publications; their projections are treated as third-party estimates and weighted below the institutional reviews T1, T2, and T8. The T5 reference to BTC below $82,000 may predate current conditions; the USD-equivalent of the current EUR price is approximately $85,900 (75,952 x 1.1312), which sits above the $80,000 support and within the $85,000 to $90,000 resistance zone cited in May 2026 [T7]. No on-chain metrics (exchange reserves, realized price, MVRV, derivatives positioning) were available in the dataset; market-structure depth claims remain qualitative.
Regional Market Detail
| Indicator | Level | 5d | 1m | YTD |
|---|---|---|---|---|
| DAX | 24,939 | -1.85% | -3.97% | +1.83% |
| ATX | 6,678 | -3.82% | -1.18% | +25.63% |
| Euro Stoxx 50 | 6,190 | -2.51% | -2.51% | +6.80% |
| S&P 500 | 7,666 | -0.99% | +0.46% | +11.99% |
| Nasdaq Composite | 26,872 | -0.73% | +2.96% | +15.62% |
| Nikkei 225 | 68,285 | +3.65% | +6.16% | +35.65% |
| Hang Seng | 23,913 | -2.44% | -6.70% | -6.70% |
Euro-Area AAA Yield Curve
| Tenor | Yield | 1d | 5d | 1m | YTD |
|---|---|---|---|---|---|
| 2Y | 3.16% | -5.1bp | -7.0bp | +30.3bp | +105.1bp |
| 5Y | 3.29% | -5.8bp | -5.2bp | +28.4bp | +85.1bp |
| 10Y | 3.58% | -2.6bp | +1.5bp | +24.2bp | +63.4bp |
| 30Y | 3.81% | -2.1bp | +6.4bp | +3.3bp | +33.0bp |
FX Matrix
| Pair | Level | 5d | 1m | YTD |
|---|---|---|---|---|
| EUR/USD | 1.1312 | -0.75% | -2.37% | -3.73% |
| EUR/CHF | 0.9437 | -0.18% | +0.33% | +1.46% |
| EUR/JPY | 178.69 | -0.42% | -3.54% | -2.76% |
| EUR/GBP | 0.8539 | -0.58% | -0.43% | -2.04% |
Glossary
ETF flow dominance: the regime in which regulated fund flows are the marginal price-setter. BTC dominance: Bitcoin’s share of total crypto market capitalization. FDV: fully diluted valuation, price multiplied by maximum supply. Halving cycle: the roughly four-year pattern of supply-reduction-driven price cycles, now considered superseded by flow-led structure [T6]. Market-structure regime: the prevailing set of channels (ETFs, treasuries, derivatives) through which capital enters and exits.
Sources
- [T1] Crypto Market 2025: Year-End Review & Expert Insights. tradingview.com
- [T2] Q2 2026 Digital Asset Review. coindesk.com
- [T3] Bitcoin Price Prediction 2026: Institutional Adoption. intellectia.ai
- [T4] Crypto Analysis for 2026: Bitcoin, ETFs, Regulation. blockchain-council.org
- [T5] US Treasury yields surge to new highs as liquidity tightens, pushing Bitcoin back below $82,000 resistance. cryptoslate.com
- [T6] Bitcoin Price Faces a Pivotal Shift: New Market Structure, Institutional Funds, and Macroeconomics Now Drive Value. cryptorank.io
- [T7] Bitcoin Price Analysis May 2026. intellectia.ai
- [T8] Bitcoin ETF Inflows Surge to $1.92 Billion Last Week. cryptonomist.ch
Disclaimer: This report is AI-generated, for informational purposes only, and does not constitute investment advice. Figures reflect the data snapshot at the stated retrieval time and may not reflect current market conditions. Readers should conduct their own due diligence and consult licensed advisors before making investment decisions.
Important Note / Wichtiger Hinweis:
EN: This report may have been generated using AI. It processes data from publicly available sources. The content is provided for informational purposes only.DE: Dieser Bericht kann mithilfe von KI erstellt worden sein. Dabei werden Daten aus öffentlich zugänglichen Quellen verarbeitet. Die Inhalte dienen ausschließlich Informationszwecken.
* DE: Die ergänzenden Inhalte können KI-generiert sein. EN: The additional content may be AI-generated.