
The altii-Gold-Report: Gold (XAU) in EUR
As of 2 October 2026, 04:37 UTC. Quote basis: EUR. EUR spot references the PAX Gold (PAXG) tokenized proxy.
Listen to the summary
Key Data Snapshot
| Metric | Value | Context |
|---|---|---|
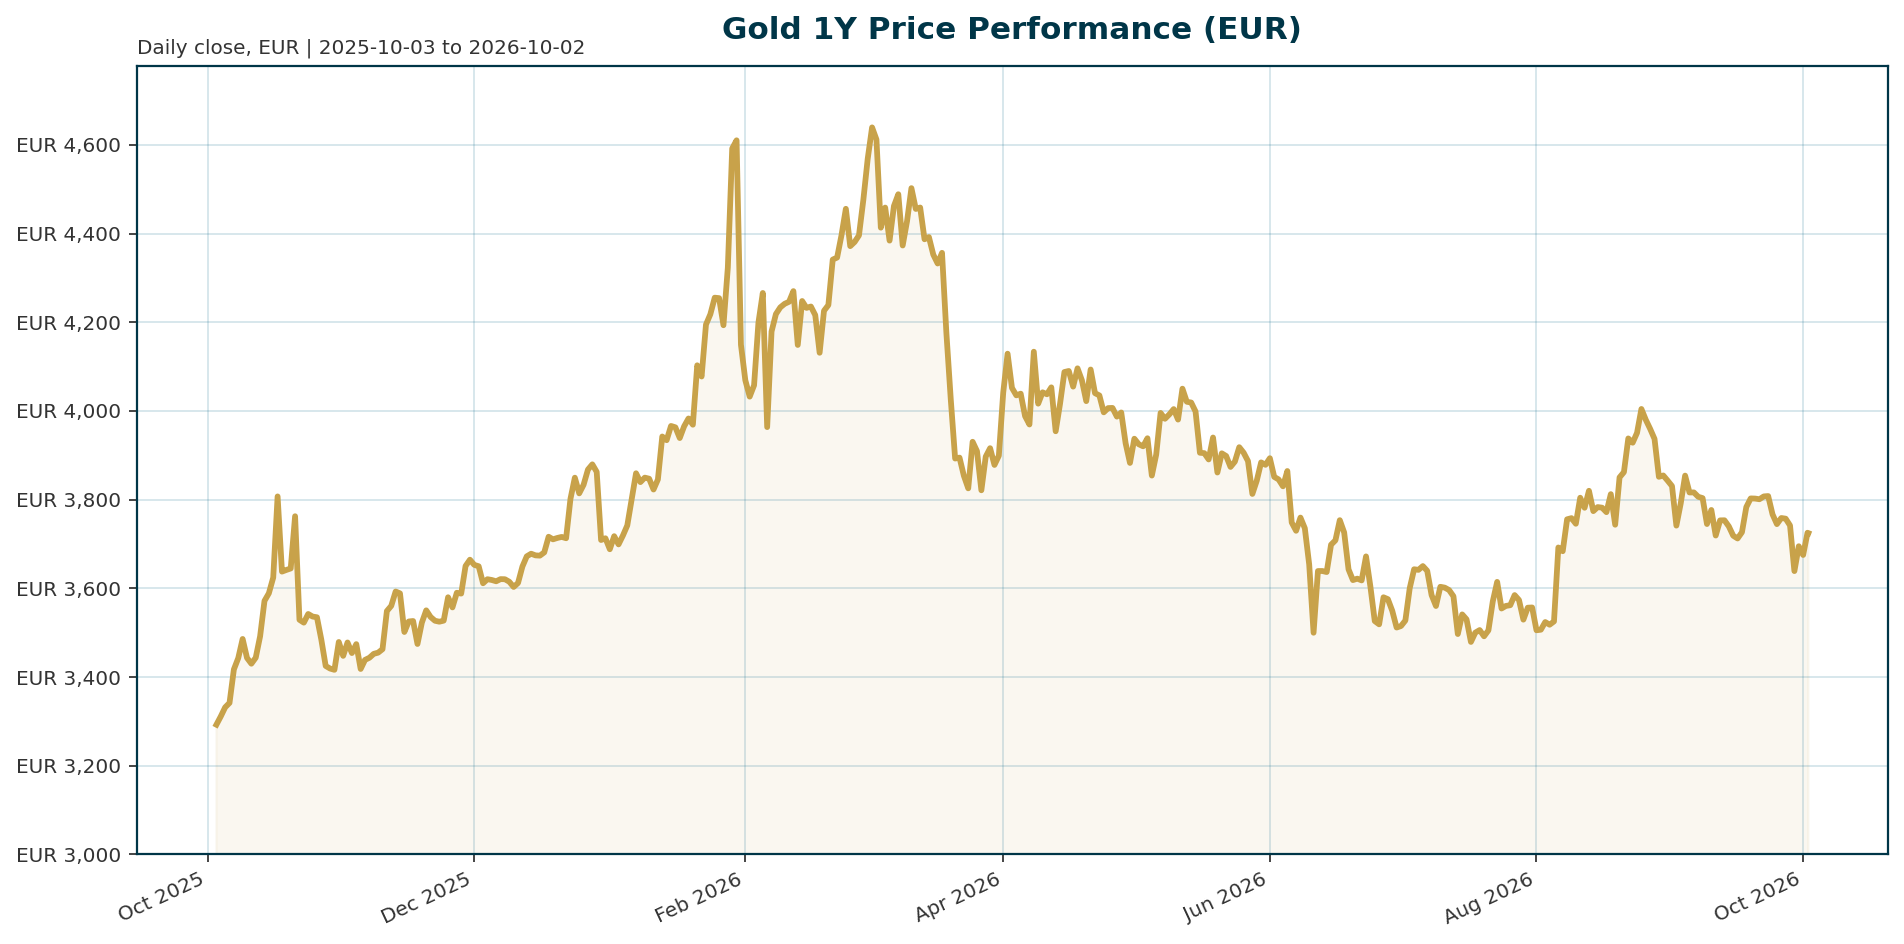
| Price (EUR) | 3,728.63 | 24h +0.99%; 24h high 3,728.82 / low 3,687.24 |
| vs All-Time High | -20.47% | ATH 4,688.32 EUR on 2026-01-28; calc: (3,728.63 – 4,688.32) / 4,688.32 |
| vs All-Time Low | +194.69% | ATL 1,265.28 EUR on 2019-11-17 |
| 7d / 14d / 30d | -2.17% / -3.66% / -3.02% | Negative momentum across all short horizons |
| 200d / 1y | -16.25% / +7.94% | Correction within a still-positive annual trend |
| Tokenized market cap (PAXG) | 1.62bn EUR | Rank 58; supply 435,070.59 tokens; 24h volume 107.6m EUR (token-level only) |
| Euro Area AAA 10Y yield | 3.58% | +24.2bp 1m, +63.4bp YTD; 10Y-2Y spread 42.2bp (as of 2026-09-30) |
| Euro Area AAA 2Y yield | 3.16% | +105.1bp YTD; front-end repricing against Eurosystem easing |
| EUR/USD | 1.1312 | -0.75% 5d, -3.73% YTD; FX drag on EUR-quoted gold |
| DAX / S&P 500 | 24,939 / 7,666 | 5d: -1.85% / -0.99%; S&P YTD +11.99% |
| BTC dominance / crypto total cap | 58.90% / 2.63tn EUR | Speculative flows concentrated in Bitcoin |
Macro Backdrop
Market overview: Risk sentiment is neutral to negative, equity momentum is mixed, and DACH indices are lagging global peers: the DACH 5-day average is -2.83% versus -0.13% for global equity indicators. The rates backdrop shows mixed euro yields with curve steepening (AAA 10Y at 3.58%, +1.5bp over 5 days; the 10Y-2Y spread sits at 42.2bp), while FX is mixed with EUR/USD at 1.1312 (-0.75% over 5 days). The Nikkei 225 is the strongest 5-day performer at +3.65% and the ATX the weakest at -3.82%. This tape offers no broad risk-off bid yet, but the defensive tilt in European sentiment is consistent with gold’s stabilization after a multi-week slide.
Monetary policy is the dominant swing factor. The Federal Reserve held rates this week, with Chair Powell requiring clearer progress on inflation before further easing, though ING’s US economist still expects two 25bp cuts later in the year [T1]. Lombard Odier frames it more cautiously: the Fed is likely to stay on hold for much of 2026, with any cut arriving toward year end [T6]. Rising energy prices on geopolitical tension keep inflation risk elevated, and a higher-for-longer environment would keep real yields elevated, a direct headwind for gold [T1].
The structural anchor is official-sector demand. Central banks accumulated an average of roughly 1,000t of gold per year over the past four years, double the 500t average of the preceding decade [T7]. Between 2022 and 2024 the cumulative purchase exceeded 3,200t: about 1,136t in 2022 (the highest annual figure in modern data), 1,037t in 2023 and around 1,045t in 2024 [T8]. In the World Gold Council’s 2026 survey, 89% of respondents expect global central bank gold reserves to rise over the next 12 months and a record 45% expect their own reserves to increase [T7]. This accumulation is a reserve-diversification response to high public debt levels (at or near post-war highs in advanced economies) and to sanctions vulnerability [T3][T8].
Investment Thesis
The core thesis rests on the SocGen dual-driver framework: central bank flows form the structural floor, while the real-yield cycle is the swing factor [T2]. Central bank purchases, particularly from emerging economies diversifying away from the US dollar, provide a consistent bid that absorbs supply and reduces gold’s sensitivity to short-term rate expectations [T2]. ING concurs: any deeper pullback would likely attract central bank and longer-term buyers [T1].
The second pillar is the real-yield linkage, which has re-asserted itself in recent months [T6]. Gold yields nothing, so real interest rates measure its opportunity cost [T5]. High public debt levels make it politically and economically difficult for major economies to sustain restrictive policy, capping real rates and supporting non-yielding assets [T8]. If debt burdens are ultimately resolved through financial repression, inflation, or currency depreciation, gold historically outperforms in all three outcomes [T3]. The WGC survey confirms the mechanism: 92% of reserve managers cite interest rate levels as relevant to allocation decisions and 90% cite gold’s crisis performance [T4].
The EUR quotation adds a local constraint. Euro-area nominal yields have risen sharply this year (2Y +105bp YTD, 10Y +63bp YTD), lifting the EUR opportunity cost of holding gold, and EUR/USD weakness of -3.73% YTD means USD-gold strength partially leaks away for euro-based holders. The thesis holds if official-sector demand continues near 1,000t per year while real yields drift sideways to lower by end-2026. It weakens if a hawkish policy reversal drives real yields sharply higher while central bank buying slows, which is SocGen’s explicitly stated headwind [T2].
Bullish Drivers
- Structural official-sector bid: A record 45% of surveyed central banks expect to raise their own gold reserves over the next 12 months and 89% expect global reserves to rise [T7]. JPMorgan Private Bank cites a record 43% of 73 monetary authorities expecting to increase reserves [T5].
- Geopolitical hedging demand: 90% of WGC respondents cited gold’s crisis performance following the Middle East escalation; EMDE institutions prioritize geopolitical instability as an allocation driver at 95% versus 67% in advanced economies [T4].
- Active reserve management: About 44% of reserve managers now actively manage their gold books with risk management as a key motive, embedding recurring demand [T8].
- Capped real rates via fiscal dominance: High public debt makes very restrictive policy hard to sustain, keeping real interest rates politically capped, which supports non-yielding assets [T8]. Sustained negative real rates would be a powerful structural tailwind [T3].
- Dip-buying behavior: After a strong YTD run (roughly +6% in USD terms per ING), the market is vulnerable to profit-taking, but deeper pullbacks attract central bank and long-term buyers [T1].
- Bull case path: Late-2026 Fed cuts plus continued ~1,000t annual accumulation would re-assert the real-yield tailwind and close part of the -20.5% gap to the January ATH. A bull-stretch variant is an explicit fiscal-repression debate that triggers a new leg higher [T3].
Relative Positioning vs Bitcoin and Ethereum
The tokenized gold proxy’s market cap of 1.62bn EUR represents roughly 0.06% of the 2.63tn EUR total crypto market cap (calc: 1.622 / 2,629 = 0.0006), and ranks 58th. Tokenized gold and the crypto complex therefore operate in entirely different liquidity pools, and relative performance is driven by regime, not by capital competition at the margin.
The driver sets differ fundamentally. Gold’s price is set by real yields, central bank reserve flows and inflation hedging; crypto’s is set by liquidity conditions, dominance rotation and risk appetite. Current conditions favor a defensive reading: BTC dominance is rising at 58.90% while DACH equities lag global peers by 2.70pp over 5 days (-2.83% vs -0.13%). Capital is favoring Bitcoin or cash over both gold and high-beta ETH. Gold differentiates through the official-sector bid, which crypto lacks entirely.
Scenario differentiation: in a stagflation regime, gold’s crisis-performance record, cited by 90% of reserve managers [T4], clearly outshines ETH’s liquidity-sensitive profile. In an easing-driven risk rally over a 3 to 6 month horizon, ETH would likely outperform gold. No ETH or BTC price data is available in this data bundle, so the comparison stays at driver-set and aggregate level; precise ETH relative returns are unavailable.
Scenario Framework
- Base case, hold-then-cut (moderate probability): The Fed stays on hold for much of 2026 with cuts toward year end [T6], real yields plateau, and central bank accumulation continues near 1,000t [T7]. EUR-gold consolidates in a rough 3,600 to 4,000 range; pullbacks are absorbed by the official sector [T1][T2]. Monitor: Fed communication, euro-area 2Y yield direction, WGC quarterly flow data.
- Bearish case, hawkish persistence (elevated probability near term): Energy-driven inflation re-accelerates [T1], cuts get priced out (euro 2Y is already +105bp YTD, signaling less expected easing), real yields rise, and central bank buying slows [T1][T2]. EUR-gold extends the correction below 3,600 and tests the 3,400 to 3,600 support zone. Monitor: inflation surprises, rate-cut pricing, official-sector purchase disclosures.
- Bullish case, stagflation or early pivot (lower probability, high impact): Growth disappoints while inflation persists, or easing arrives faster than priced. This is historically gold’s most supportive regime [T1][T3]. EUR-gold retests the 4,600+ ATH zone. Monitor: growth downgrades, fiscal-repression rhetoric, reserve policy announcements from Asia and the Middle East [T3].
Valuation Discussion
Gold has no cash flows, so conventional valuation anchors do not apply. The relevant framework is opportunity cost and flow support. On the opportunity-cost side, the position is unattractive in EUR terms: the euro AAA 10Y yield of 3.58% with +63.4bp YTD movement implies elevated real hurdle rates unless euro-area inflation is correspondingly high. The bundle contains no euro breakeven inflation series, so a precise EUR real-yield estimate is unavailable; the nominal yield trajectory is the observable proxy and it points against gold. Note that the historical inverse real-yield relationship broke down between 2022 and 2024: real yields rose to their highest levels since 2008, yet gold was flat in 2022 and returned +13% in 2023 to a record $2,068 per ounce, evidence that central bank flows decouple gold from pure rates models [T5].
On positioning, gold trades at 3,728.63 EUR, 20.47% below its January 2026 ATH and 194.69% above its November 2019 ATL. After a -16.25% move over 200 days and -3.02% over 30 days, gold is closer to flow-supported fair value than to cycle-peak extremes, assuming central bank buying continues. A retest of the ATH requires a real-yield tailwind. Overvaluation risk concentrates in one scenario: if central bank buying halves while real yields rise, the January 2026 ATH may mark a cycle peak. This valuation judgment is regime- and flow-based and explicitly scenario-dependent.
Risks
- Hawkish policy reversal: A sharp rise in real yields from rapid monetary tightening is SocGen’s explicit caution and the single largest threat to the thesis [T2].
- Higher-for-longer rates: Energy-price-driven inflation persistence complicates easing and keeps real yields elevated, a direct gold headwind [T1].
- Central bank buying fatigue: Official purchases may slow after four years of ~1,000t averages [T1]. Profit-taking remains a vulnerability after the strong YTD run [T1].
- EUR real-yield headwind: Euro 10Y +63bp YTD and 2Y +105bp YTD lift the local opportunity cost even if USD-gold holds.
- FX mechanics: A EUR/USD recovery above 1.15 (from 1.1312, -3.73% YTD) would mechanically depress EUR-quoted gold with no gold-specific deterioration.
- Crypto rotation: Rising BTC dominance (58.90%) can draw marginal safe-haven-adjacent flows toward Bitcoin instead.
- Data quality: The EUR quote derives from the PAXG tokenized proxy; the 1.62bn EUR market cap reflects tokenized supply only and must not be read as the physical gold market’s size. The 107.6m EUR 24h volume is token-level turnover, not physical liquidity. No euro breakeven inflation or USD real-yield series is available in this bundle, and news sources are largely undated, so house views (ING’s September/December cut timing) may be stale and are presented as opinions, not consensus.
Appendix
Methodology Notes
- Market data retrieved 2026-10-02T04:37Z; ECB yield curve data as of 2026-09-30; equity and FX data as of 2026-10-01/02.
- The EUR quote is PAXG-derived (a tokenized gold proxy). Physical spot/premium basis is not observable in this bundle.
- PAXG market cap (1.62bn EUR) covers tokenized supply only and is not representative of the total above-ground gold market.
- Central bank flow arithmetic: 1,000t four-year average versus a 500t prior-decade average is a 2x acceleration; the 2022-2024 cumulative figure of 3,200t+ cross-checks across sources [T7][T8].
- DACH vs global 5-day risk-sentiment spread: -2.83% minus -0.13% equals a -2.70pp gap.
- The EUR-gold 1y return of +7.94% versus USD-gold performance embeds EUR/USD YTD weakness of -3.73%; this is an approximation given period mismatches, not an exact implied return.
- Stagflation and financial-repression narratives stem from interpretive frameworks [T3][T8], not primary data.
WGC 2026 Central Bank Gold Reserves Survey Highlights
- 76 responses, the highest participation in the survey’s nine-year history; fielded 5 February to 19 May 2026 [T4].
- 89% expect global central bank gold reserves to rise over 12 months; record 45% expect their own reserves to rise; 1% expect a decrease [T7].
- Trend arc: 2024 survey recorded a then-record 29% planning increases; by 2025 about 44% of reserve managers actively managed their gold books [T8].
- Historical anchor: 2023 gold return +13% to a record $2,068/oz despite post-2008-high real yields [T5].
Sources
- [T1] Geopolitics alone isn’t enough to lift gold | ING THINK
- [T2] Gold’s Dual Drivers: Central Bank Flows and Real Yields, According to Societe Generale | CryptoRank.io
- [T3] Report: Central Banks Now Hold More Gold Than Treasuries | CEOWORLD magazine
- [T4] Central Bank Gold Purchases Hit 1,000t Average: WGC Survey | Mexico Business News
- [T5] Is it a golden era for gold? | J.P. Morgan Private Bank U.S.
- [T6] Gold’s slowdown doesn’t signal a reversal | Lombard Odier
- [T7] Central Bank Gold Reserves Survey 2026 | World Gold Council
- [T8] How Geopolitics and Central Banks Are Driving Gold Higher | EBC Financial Group
Disclaimer
This report is AI-generated and for informational purposes only. It does not constitute investment advice, a recommendation, or an offer to buy or sell any asset. Data may be incomplete, delayed, or derived from proxies as described above. Readers should conduct their own research and consult a licensed financial advisor before making investment decisions.
Important Note / Wichtiger Hinweis:
EN: This report may have been generated using AI. It processes data from publicly available sources. The content is provided for informational purposes only.DE: Dieser Bericht kann mithilfe von KI erstellt worden sein. Dabei werden Daten aus öffentlich zugänglichen Quellen verarbeitet. Die Inhalte dienen ausschließlich Informationszwecken.
* DE: Die ergänzenden Inhalte können KI-generiert sein. EN: The additional content may be AI-generated.