
Watch the video
This player shows only the Bitcoin chapter of the daily altii market briefing. Watch the full video on tube.altii.de.
Key Data Snapshot
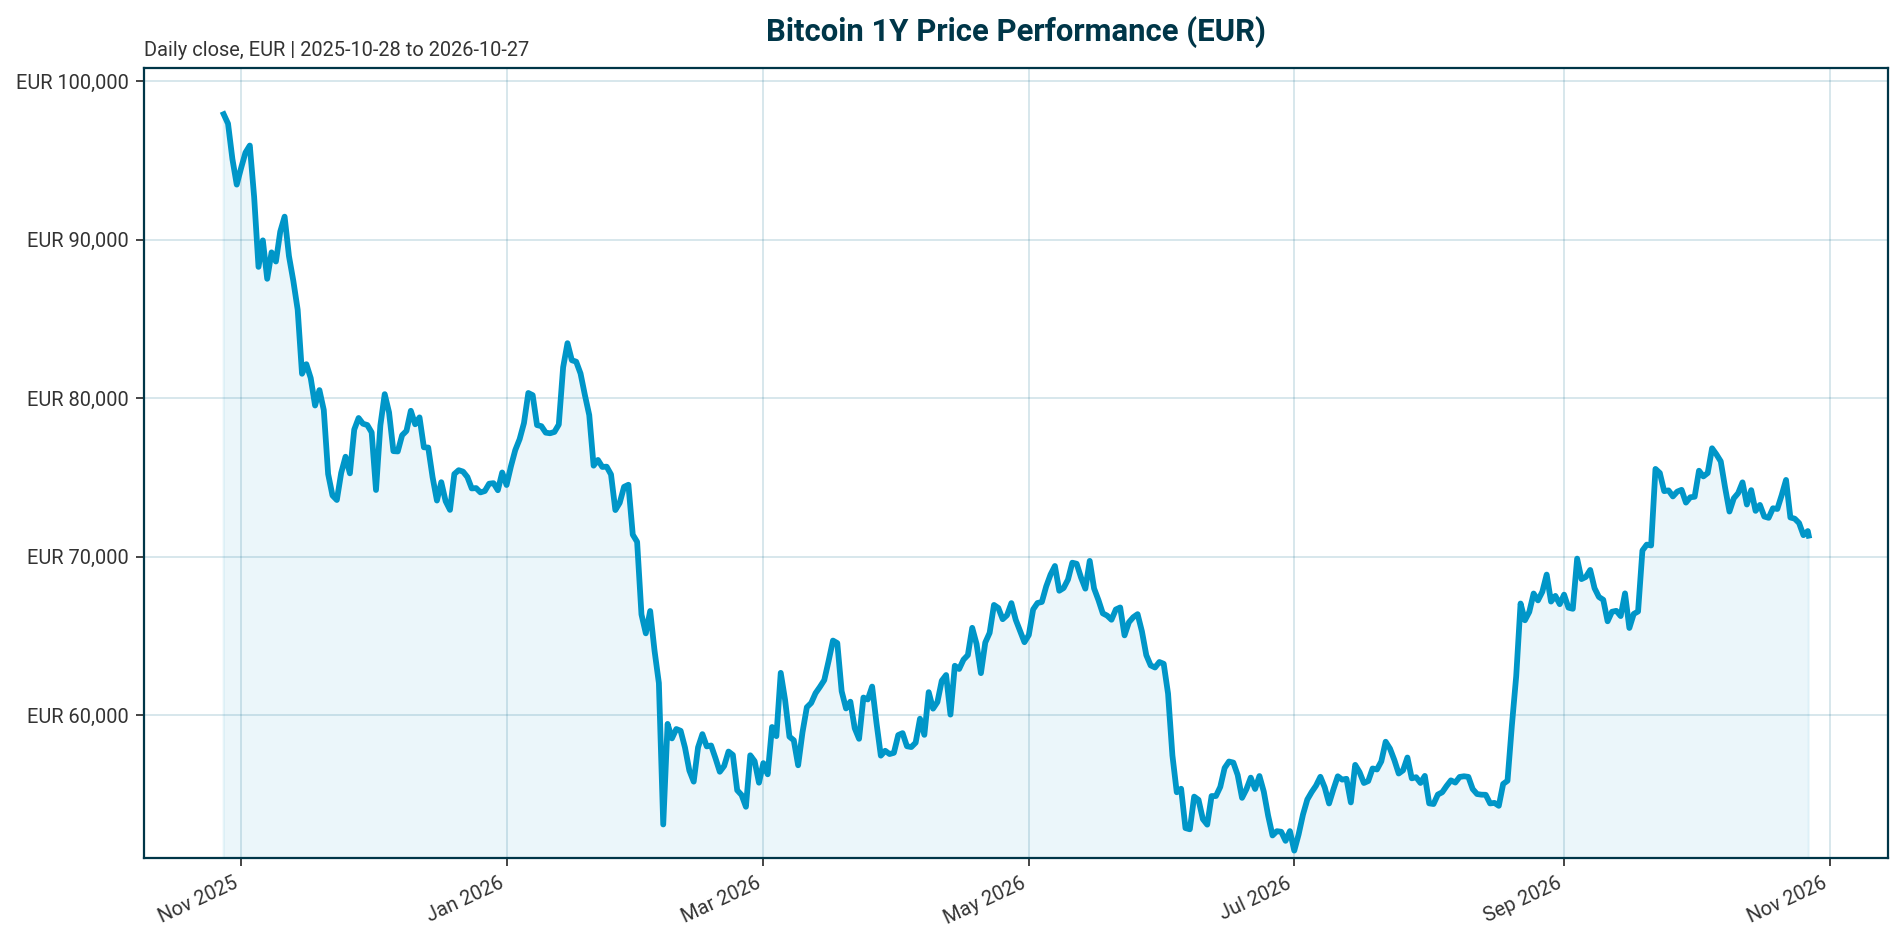
All data as of 2026-10-27, 05:15 UTC, quoted in EUR unless stated otherwise.
| Metric | Value |
|---|---|
| Price | EUR 71,381 (24h range: EUR 71,118 to 72,245) |
| 24h / 7d / 14d / 30d change | +0.05% / -2.99% / -4.36% / -5.65% |
| 200d / 1y change | +11.45% / -30.75% |
| All-time high | EUR 107,662 (2025-10-06); current drawdown -33.70%, or EUR 36,281 below |
| Market cap / FDV | EUR 1.435 trillion / EUR 1.435 trillion (rank 1) |
| 24h volume | EUR 23.97 billion (market cap / volume ratio: ~59.9x) |
| Supply | 20,103,946 of 21,000,000 BTC circulating (95.3%); 896,054 BTC remaining, roughly 5.6 years of net issuance at ~160,000 BTC/year |
| BTC dominance | 59.41% of a EUR 2.412 trillion total crypto market cap |
| Fed funds target | 3.75% to 4.00% (as of 2026-10-26); last change: +25 bp hike, effective 2026-09-17 |
| ECB deposit facility rate | 2.50% (as of 2026-10-27); last change: +25 bp hike, effective 2026-09-16 |
| Euro area AAA 10Y yield | 3.37% (-10.0 bp over 5 days, as of 2026-10-23) |
| EUR/USD | 1.1209 (-0.10% over 5 days) |
Market Setup
The cross-asset backdrop is negative for risk. Overall risk sentiment reads negative, equity momentum is moderately negative, and DACH equities are broadly in line with global peers: DACH indicators average -1.61% over five days versus -1.46% for global equity indices. The DAX is the strongest five-day performer at +0.42% while the ATX is the weakest at -3.63%. The S&P 500 sits at 7,676.77 (-0.46% over five days) and the Nasdaq Composite at 26,169.38 (-0.97%), a soft tape into which BTC has been selling. Rates are mixed: the euro area AAA 10Y yield stands at 3.37% after a -10.0 bp five-day move, the AAA 2Y at 2.98%, with a 10Y-2Y spread of 38.6 bp (yield data as of 2026-10-23, four days older than the equity prints). FX is mixed, with EUR/USD at 1.1209 (-0.10% over five days, -1.67% over one month) and EUR/CHF the strongest five-day mover at +0.17%. Policy is the binding constraint: the Fed funds target range is 3.75% to 4.00% after a 25 bp hike effective 2026-09-17, and the ECB deposit rate is 2.50% after a 25 bp hike effective 2026-09-16. This is a restrictive setting for a high-beta, flow-driven asset like BTC, and the EUR quote means EUR/USD materially shapes reported performance independently of USD-denominated BTC price action.
Investment Thesis
Bitcoin has become a flow-driven macro asset, not a narrative-driven one. ETF flows now act as its primary marginal demand channel and de facto macro indicator: per the 2025 year-end review [T1], record Q4 outflows from US-listed BTC and ETH ETFs coincided with BTC breaking support around USD 98,000 (about EUR 87,429 at today’s cross) and retesting the low USD 90,000s. The structural case rests on institutionalised access: 6.7 million BTC sat across ETFs, exchanges, and treasuries at end-2025, which Glassnode called the “institutional supply era” [T1], and BTC volatility compressed from 84% to 43% per the Glassnode x Fasanara 2025 report [T1], improving allocability. Supply dynamics reinforce the point: net new mined supply of roughly 160,000 BTC per year is small against more than 1 million BTC held by ETFs, so holder reallocation matters more than mining [T4].
The tension is macro. With the Fed at 3.75% to 4.00% and the ECB at 2.50% following recent hikes, tight liquidity can flip the ETF channel from structural buyer to forced seller [T4]. Whale wallets of 1,000 BTC or more accumulated into late-year fear, suggesting a provisional floor but a future overhang if macro deteriorates [T4], and Strategy (formerly MicroStrategy) has reportedly slowed purchases amid weaker financing conditions [T8]. Base-case stance: neutral-to-constructive, but flow confirmation is required. One strong session does not make a trend; sustained multi-session inflows are the trigger for turning constructive at current levels.
Bullish Drivers
- Flow reversal evidence: US spot BTC ETFs recorded USD 526.7 million (about EUR 469.9 million) of net inflows on October 19, the strongest daily inflow since September 22, led by BlackRock’s IBIT at USD 665.2 million (about EUR 593.4 million) [T3]. That single session absorbed roughly 15 times the daily value of net mined supply (about 438 BTC/day, roughly EUR 31 million at current prices). The caveat stands: other funds saw withdrawals, so concentration tempers the signal [T3].
- Retirement-channel optionality: a 1% allocation of the USD 22 trillion US 401(k)/Defined Contribution system would generate USD 90 to 130 billion (about EUR 80 to 116 billion) of steady, rules-based inflows, on par with today’s entire spot BTC ETF market size [T4]. That equals roughly 5.6% to 8.1% of BTC’s current market cap, though adoption will unfold gradually [T4].
- Supply scarcity: ~160,000 BTC of annual net issuance versus more than 1 million BTC in ETFs; only 896,054 BTC remain to be mined, roughly 5.6 years of supply at current issuance [T4].
- Third-party forecasts (context only, not house views): per an undated analysis [T2], JPMorgan projects a USD 150,000 (about EUR 133,821) peak target on a flow-based model with 72% confidence targeting Q4 2026, and Ark Invest maintains USD 200,000 (about EUR 178,428) for 2026 and USD 1,000,000 by 2030. The same source cites daily ETF inflows at times exceeding USD 400 million; treat these promotional, undated figures with caution.
- Regulatory clarity: clearer stablecoin frameworks and market-structure rules could broaden institutional participation across the ecosystem [T7].
Relative Positioning vs Gold and Ethereum
Versus Ethereum: BTC holds the clear upper hand. Dominance stands at 59.41% of a EUR 2.412 trillion total crypto market cap (our check: 1,435.1 / 2,412.1 billion implies ~59.5%, consistent with the reported figure). While BTC ETFs attracted USD 526.7 million on October 19, Ether ETFs recorded USD 103.3 million (about EUR 92.2 million) of net outflows, their fourth consecutive session of withdrawals [T3]. Capital selectively favoured assets tied to institutional infrastructure, tokenisation, and stablecoin payments rather than broad altcoin speculation [T3]. This divergence supports BTC dominance holding or rising above 59% over the report horizon.
Versus gold: the comparison is a contest for the same store-of-value allocation, and the current rate regime favours yield-bearing alternatives. Higher government bond yields have made institutional buyers more selective because debt offers a stronger return profile [T5]. Ark Invest’s thesis frames BTC as capturing share from store-of-value assets like gold [T2], but that is a third-party view and a multi-year proposition. In a restrictive-rate regime, gold’s zero-yield argument weakens BTC’s near-term catch-up trade, while BTC retains a higher-beta optionality premium. Note: the current gold spot price is not in the dataset, so the gold comparison remains qualitative and flow-based rather than performance-based.
Scenario Framework
All USD levels converted at EUR/USD 1.1209; converted figures labelled as such.
- Bull scenario (assumption): sustained multi-week ETF inflows plus any dovish repricing of the Fed path from the 3.75% to 4.00% range. BTC reclaims the USD 84,000 confirmation level (about EUR 74,940) with flow support and moves toward the USD 100,000 to 150,000 range (about EUR 89,214 to 133,821) cited by third-party forecasts [T2]. Trigger: weekly inflows persistently above the USD 400 million (about EUR 357 million) pace.
- Base scenario (assumption): restrictive policy (Fed 3.75% to 4.00%, ECB 2.50%) and choppy two-sided flows keep BTC range-bound. The USD 82,000 resistance (about EUR 73,156) and the 200-day moving average [T5] cap the upside; whale accumulation provides a provisional floor [T4]. Current price of EUR 71,381 sits just below the converted resistance, consistent with this range.
- Bear scenario (assumption): renewed weekly outflows at the USD 700 million (about EUR 624.5 million) pace, the largest weekly retreat since late January [T5], plus rising yields push BTC through support. ETFs become forced sellers [T4], the whale overhang accelerates the decline [T4], and the drawdown from ATH extends beyond the current -33.70%.
The flow triggers are asymmetric and well defined: a single USD 526.7 million inflow day [T3] versus a USD 700 million weekly outflow pace [T5]. Watch the weekly aggregate, not the daily headline.
Valuation Discussion
Traditional valuation metrics do not apply to BTC; cash flows do not exist. The relevant reference points are scarcity and flow. On scarcity: the fully diluted valuation of EUR 1.435 trillion is essentially identical to market cap (a premium of roughly 0.001%) because 95.3% of the 21 million max supply already circulates. Scarcity is codified, not prospective, and 896,054 BTC remain to be mined over roughly 5.6 years. On flow: per 21Shares’ 2026 outlook, BTC’s fair value is determined by the tension between expanding distribution into wealth and retirement platforms and the macro forces governing risk appetite and real rates, not by issuance curves or ideology [T4]. JPMorgan’s USD 150,000 target (about EUR 133,821) rests on exactly this flow-based logic [T2].
The market cap to 24h volume ratio of roughly 59.9x indicates deep liquidity but also confirms that marginal flow, not stock, sets price. Volatility compression from 84% to 43% [T1] supports a higher institutional allocation multiple but cuts both ways: it signals increased macro sensitivity, and using 43% as a stable sizing input would be a scenario error if stress reverses the compression. Currency caveat: all USD-denominated forecasts and levels here are converted at EUR/USD 1.1209. Note also a data discrepancy: news sources quote BTC in the USD 81,000 to 83,000 range [T3], which implies a EUR/USD cross inconsistent with the observed 1.1209 and today’s EUR 71,381 price. This suggests those news items predate the current market; we flag the gap rather than reconcile it silently.
Risks
- Liquidity and rates risk: surging US Treasury yields and tightening liquidity pushed BTC back below USD 82,000 resistance (about EUR 73,156); higher yields make institutional buyers more selective [T5]. With the Fed at 3.75% to 4.00% and the ECB at 2.50% after recent hikes, sustained higher-for-longer rates pressure high-beta valuations [T7]. A hawkish surprise extending the hiking stance at either central bank is the single highest-impact downside trigger, given BTC’s documented sensitivity to Fed repricing [T1].
- Flow reversal asymmetry: the same ETF channel that anchors demand becomes a forced-seller channel in tight liquidity [T4]. Weekly outflows exceeded a USD 700 million pace in the largest retreat since late January [T5]. A repeat of the Q4 2025 record outflow episode [T1] against today’s lower price base implies a deeper percentage drawdown than the current -33.70%.
- Concentration risk: the October 19 inflow was concentrated in IBIT (USD 665.2 million) while other funds saw withdrawals; one strong session does not establish a durable trend [T3].
- Treasury and whale overhang: whale wallets holding 1,000 BTC or more represent future supply if macro deteriorates [T4]; Strategy has slowed purchases amid weaker financing conditions [T8].
- Amplification risk: institutional participation can amplify volatility in both directions [T8]; crypto proxies carry beta well above 2 versus the S&P 500 [T7].
- Data risk: most news items are undated; current-week ETF flow data is unavailable in the dataset, so the present flow regime is uncertain. No on-chain data (realized price, MVRV, exchange balances) is available to verify whale accumulation claims.
Appendix
Methodology and Conventions
- Market data retrieved 2026-10-27T05:15 UTC. Equity and FX data as of 2026-10-26/27; euro area yield curve data as of 2026-10-23, a four-day timestamp mismatch we flag explicitly.
- Currency convention: BTC is quoted in EUR. All USD-denominated news levels and forecasts are converted at EUR/USD 1.1209 and labelled as converted figures.
- Policy rate sourcing: Fed funds target range 3.75% to 4.00% (as of 2026-10-26; last change +25 bp hike effective 2026-09-17); ECB deposit facility rate 2.50% (as of 2026-10-27; last change +25 bp hike effective 2026-09-16). No other central bank policy rates are in the dataset.
- Several Tavily items lack publication dates; figures from those items are cited with their source identifier and flagged as undated where relevant.
- Benchmark assets per configuration are gold and ethereum. Gold spot price data is not in the dataset and is flagged as a gap; the gold comparison is therefore qualitative.
- Key calculations shown: drawdown from ATH = 71,381 / 107,662 – 1 = -33.70% (EUR 36,281 below ATH); market cap / 24h volume = 1,435,051,896,395 / 23,968,232,962 = ~59.9x; remaining supply = 21,000,000 – 20,103,946 = 896,054 BTC (~5.6 years at ~160,000 BTC/year); 200d vs 1y return spread = +11.45% – (-30.75%) = 42.2 percentage points; 1% US 401(k)/DC allocation = USD 90-130 billion = about EUR 80-116 billion = ~5.6% to 8.1% of current market cap.
Sources
- [T1] Crypto Market 2025: Year-End Review & Expert Insights, TradingView News (undated)
- [T2] Bitcoin Price Prediction 2026: Institutional Adoption & ETF Impact Analysis, Intellectia (undated; promotional content, used only as labelled third-party forecasts)
- [T3] Bitcoin Holds the Line, Altcoins Falter as Crypto Enters a New Institutional Cycle, MarinaTimes NG (references October 19 flow data)
- [T4] Bitcoin 2026 outlook: ETF gravity vs. Macro ceiling, 21Shares (undated)
- [T5] US Treasury yields surge to new highs as liquidity tightens, pushing Bitcoin back below $82,000 resistance, CryptoSlate (undated)
- [T6] Bitcoin ETFs Absorb $134.4M as Macro Backdrop Improves, Elevano Capital via LinkedIn (undated)
- [T7] Amplify Transformational Data Sharing ETF (BLOK): Blockchain Exposure Amid Regulatory and Macro Shifts, Tickeron (undated)
- [T8] Bitcoin Outlook: ETF Outflows, Institutional Adoption & Price Forecast 2026, IG South Africa (undated)
Disclaimer
This report is AI-generated and provided for informational purposes only. It does not constitute investment advice, a recommendation, or an offer to buy or sell any financial instrument. Figures, forecasts, and scenario assumptions are drawn from the cited sources and the referenced dataset as of the stated timestamps; they may be incomplete, undated, or stale, and no warranty is given as to their accuracy or completeness. Readers should conduct their own due diligence and consult a licensed financial advisor before making any investment decision.
Important Note / Wichtiger Hinweis:
EN: This report may have been generated using AI. It processes data from publicly available sources. The content is provided for informational purposes only.DE: Dieser Bericht kann mithilfe von KI erstellt worden sein. Dabei werden Daten aus öffentlich zugänglichen Quellen verarbeitet. Die Inhalte dienen ausschließlich Informationszwecken.
* DE: Die ergänzenden Inhalte können KI-generiert sein. EN: The additional content may be AI-generated.