
The altii-BTC-Report: Bitcoin in EUR
Date: 4 November 2026 | Asset: Bitcoin (BTC) quoted in EUR | Profile: Institutional
Watch the video
This player shows only the Bitcoin chapter of the daily altii market briefing. Watch the full video on tube.altii.de.
Key Data Snapshot
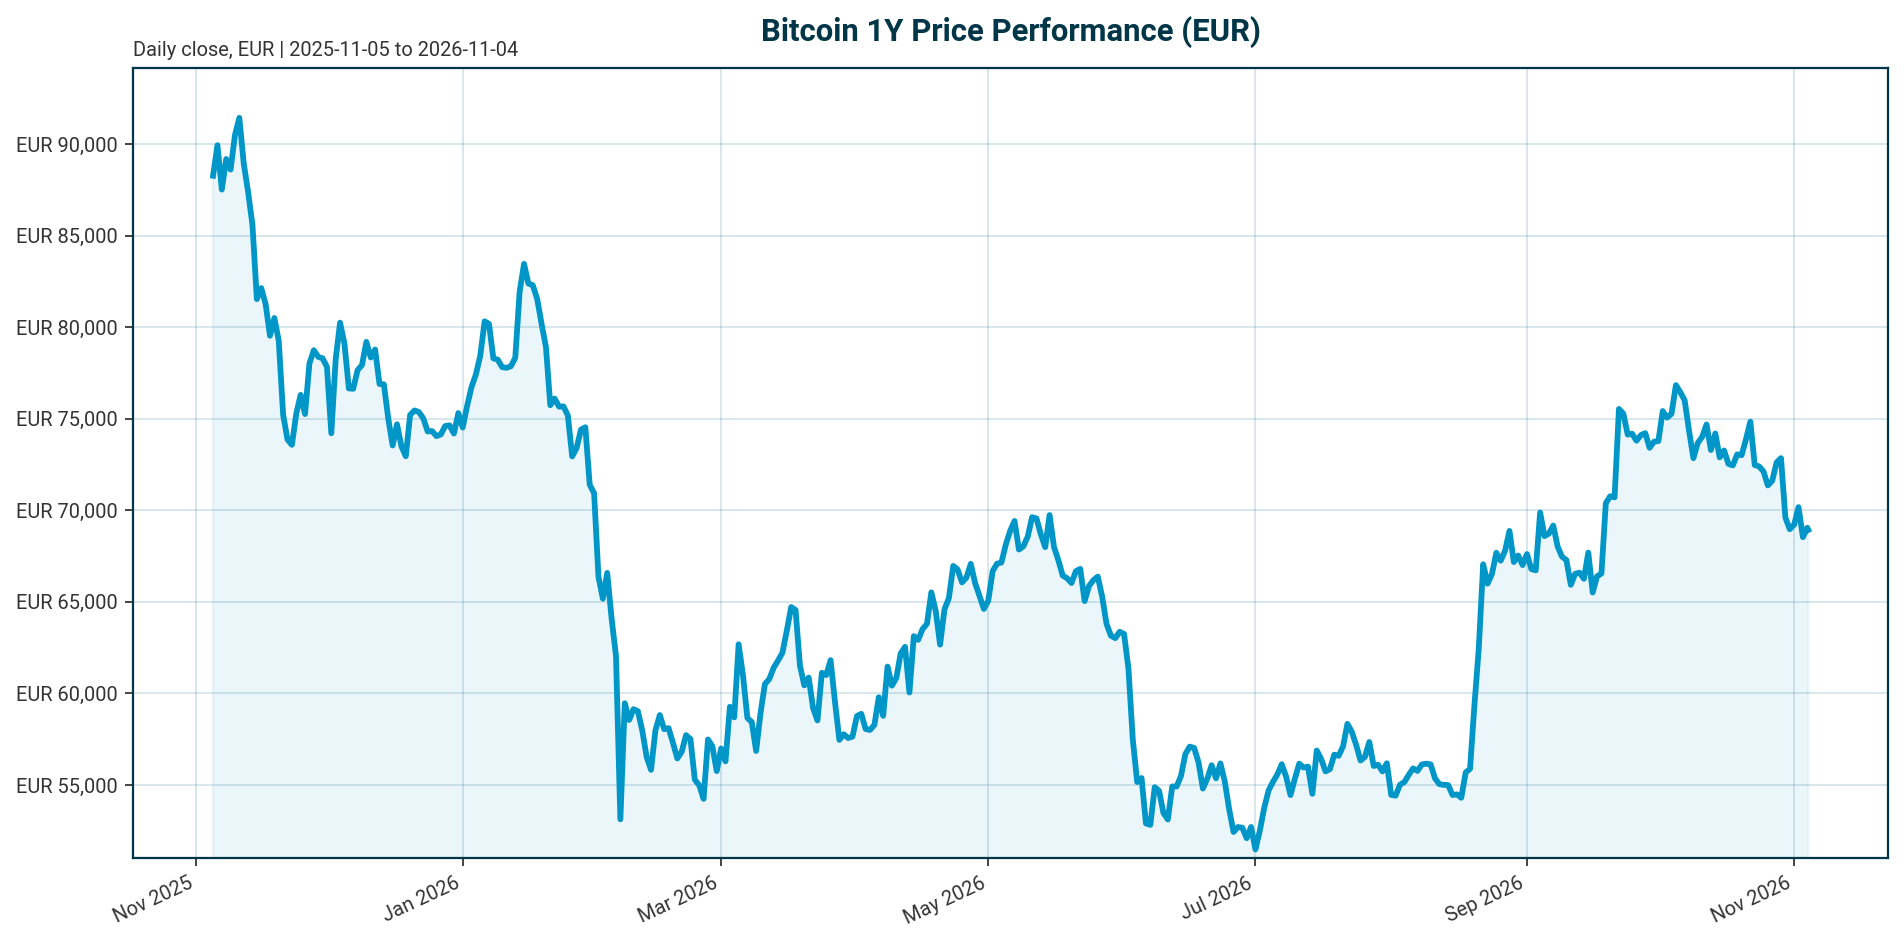
| Metric | Value |
|---|---|
| Price (EUR) | 68,796 |
| 24h range (EUR) | 67,410 to 69,432 |
| Change 1h / 24h | +1.21% / +0.40% |
| Change 7d / 14d / 30d | -4.54% / -6.44% / -10.15% |
| Change 200d / 1y | +0.43% / -27.82% |
| Market cap (EUR) | 1.384 trillion (rank 1) |
| 24h volume (EUR) | 25.43 billion (~1.84% of market cap) |
| Fully diluted valuation (EUR) | 1.384 trillion (equals market cap) |
| All-time high (EUR) | 107,662 on 2025-10-06; current price -36.10% below |
| Circulating / max supply | 20,105,365 / 21,000,000 (~95.74% issued) |
| BTC dominance | 59.32% of EUR 2.332 trillion total crypto market cap |
| Fed funds target range | 3.75% to 4.00% (as of 2026-11-03); last change: hike of 25 bp, effective 2026-09-17 |
| ECB deposit facility rate | 2.50% (as of 2026-11-04); last change: hike of 25 bp, effective 2026-09-16 |
| Data retrieved | 2026-11-04 05:15 UTC |
Key calculations: drawdown from ATH = (68,796 – 107,662) / 107,662 = -36.10%. Recovery to ATH requires +56.5% from the current level. Annual mining issuance of roughly 160,000 BTC [T5] equals about 0.80% of circulating supply per year.
Market Setup
The cross-asset backdrop is risk-off. Risk sentiment reads negative and equity momentum is moderately negative. Global equities are under pressure over five days, with the S&P 500 down 2.26% and the Nasdaq Composite down 4.44%, while the Nikkei 225 is the weakest performer at -4.61%. The DACH region is outperforming: DACH indicators average -0.03% over five days versus -2.11% for global equity indicators, and the DAX leads on a one-month basis at +2.51%. Rates are mixed: the Euro Area AAA 10Y yield stands at 3.33%, down 4.5 bp over five days and 13.7 bp over one month but up 37.8 bp year-to-date, with a 10Y-2Y spread of 33.3 bp. FX is mixed: EUR/USD at 1.1196 (+0.15% over five days, -4.71% YTD), EUR/JPY showing the strongest five-day move at +0.45%.
Policy is restrictive on both sides of the Atlantic. The Fed funds target range is 3.75% to 4.00% after a 25 bp hike effective 2026-09-17, and the ECB deposit facility rate is 2.50% after a 25 bp hike effective 2026-09-16. There is no easing impulse in the current data. For context, a July 2026 expectation that the Fed would hold rates through Q3 [T1] has been overtaken by the September hike; treat that view as historical, not current. This matters because Bitcoin now trades as a flow-driven macro asset whose fair value is set by the tension between expanding ETF distribution and the macro forces governing risk appetite and real rates [T5]. A restrictive policy stance and negative equity momentum transmit directly into BTC-EUR, which is down 10.15% over 30 days.
Investment Thesis
Bitcoin is an institutionally owned, flow-driven macro asset trading through a drawdown. The structural buildout continues, but the cyclical backdrop works against it. Three pillars define the thesis:
1. Flows set the price. ETF flows have become Bitcoin’s new macro indicator. According to market participants cited in [T2] from late 2025, every repricing of Fed policy expectations or spike in ETF redemptions showed up almost immediately in crypto prices during that ETF- and macro-led regime. By the end of 2025, 6.7 million BTC sat across ETFs, exchanges and treasuries according to Glassnode, a level described as Bitcoin’s “institutional supply era” [T2]. With net new mining supply of roughly 160,000 BTC per year small against ETF holdings of more than 1 million BTC equivalent, holder reallocation, not issuance, determines price [T5].
2. The institutional bid is real but selective. US spot Bitcoin ETFs attracted approximately $6.4 billion in net inflows since August 1, with corporate treasuries adding around $1.5 billion, according to Coinbase Institutional commentary cited by [T7] from October 2026. BlackRock’s IBIT accounted for roughly $6 billion of that, about 94% of the ETF total, showing demand is concentrated, not broad.
3. The structural ceiling depends on regulation and distribution. The US CLARITY Act would establish a federal market-structure framework and could unlock broader institutional participation if passed [T1] [T8]. The largest potential demand extension lies in the $22 trillion US 401(k) and Defined Contribution system: even a 1% allocation would generate $90 to 130 billion of steady, rules-based inflows, on par with today’s entire spot BTC ETF market [T5].
The tension: price at EUR 68,796 is 36.1% below the October 2025 ATH despite this buildout. The base case is a range-bound, flow-dependent market. Upside requires ETF inflow reacceleration and regulatory clarity; downside arises if tight liquidity turns ETFs into forced sellers [T5].
Bullish Drivers
- ETF-anchored demand architecture. Seven straight weeks of BTC ETF inflows were confirmed as of May 2026 reporting, during which Bitcoin moved from around $68,000 to above $80,000 in USD terms, a gain of roughly 17.6% [T4]. This showed institutional demand is cyclical and can return after lulls.
- Retirement channel potential. A 1% allocation of the $22 trillion US 401(k)/DC system implies $90 to 130 billion of long-duration, rules-based inflows, comparable to the entire current spot BTC ETF market [T5]. Adoption would unfold gradually but is structurally supportive.
- Whale accumulation. Wallets holding 1,000 BTC or more accumulated into the late-2026 fear, suggesting a provisional floor [T5].
- Declining volatility improves allocability. Bitcoin volatility fell from 84% to 43% according to the Glassnode x Fasanara 2025 report cited by [T2] from late 2025, supporting its use as an allocatable line item for registered investment advisors, private banks and institutions [T2].
- Deepening institutional integration. Spot BTC ETFs attracted tens of billions in net inflows through 2025, with AUM in the hundreds of billions by early 2026 [T6]. Pension participation is expanding slowly: US plans are adding ETF positions, UK and parts of Asia are evaluating direct allocations, and sovereign wealth funds and central banks have appeared in 13F filings, though positions remain modest [T3].
- Regulatory catalysts. The CLARITY Act in the US [T1] [T8] and Hong Kong’s Stablecoins Ordinance with full reserve backing and redemption rights [T1] could remove key institutional barriers.
- Dated bull reference. A February 2026 outlook forecast Bitcoin reaching $180,000 in 2026 on policy tailwinds and institutional demand [T6]. This predates the current drawdown and should be read as a historical bull-case reference, not a live target.
Relative Positioning vs Gold and Ethereum
Data gap disclosure: the dataset contains no live price or return data for gold or Ethereum. The comparison below is therefore qualitative and scenario-based, anchored on Bitcoin’s own metrics and the source material.
Versus gold: Bitcoin’s 1-year EUR return of -27.82% in a restrictive-rate environment contrasts with gold’s traditional role as a beneficiary of geopolitical and rate uncertainty. Near term, gold’s independence from ETF flow dynamics gives it a defensive edge while risk sentiment is negative. Bitcoin’s catch-up case requires ETF inflow reacceleration. The counterargument: Bitcoin’s volatility decline from 84% to 43% [T2] and its institutionalized liquidity support the long-run “digital gold” framing, and its 200-day return of +0.43% shows consolidation rather than collapse.
Versus Ethereum: Bitcoin’s 59.32% dominance of the EUR 2.332 trillion crypto market confirms it remains the core crypto allocation. However, the flow channel is shared: record outflows from US-listed BTC and ETH ETFs in Q4 2025 coincided with Bitcoin breaking key support around $98,000 in USD terms [T2], meaning BTC and ETH fall together when the institutional bid retreats. Institutional capital is rotating selectively, flowing into Bitcoin ETFs while also rotating into tokenized assets and broader blockchain infrastructure plays [T4]. The altcoin ETF pipeline is expanding beyond BTC and ETH toward Solana, XRP and others; strong altcoin ETF demand would confirm capital moving beyond the two largest assets [T8]. Two scenarios follow: regulatory clarity could rotate capital from pure BTC vehicles toward ETH and altcoin ETFs, compressing dominance from 59.3%; alternatively, BTC could retain the lion’s share given IBIT’s roughly 94% share of recent inflows [T7]. In Asia, pure bitcoin ETFs play a smaller strategic role than in North America and Europe, where tokenization and stablecoins are the institutional entry points [T1].
Scenario Framework
All scenarios are assumptions, not forecasts. Rate anchor: Fed funds target 3.75% to 4.00%; ECB deposit rate 2.50%. Flow anchor: approximately $6.4 billion of US spot BTC ETF net inflows since August 1 [T7].
- Bull scenario (assumption): the CLARITY Act passes, ETF inflows reaccelerate beyond the August-to-October 2026 pace, and 401(k) channel progress signals future structural demand. The structural bid overwhelms modest supply growth [T5], and BTC recovers toward prior consolidation levels. The dated $180,000 USD-quoted reference from February 2026 [T6] becomes relevant only in later periods if these conditions materialize.
- Base scenario (assumption): policy stays at current restrictive levels, ETF flows remain choppy and two-way as observed through 2026 [T4], and whale accumulation provides a provisional floor [T5]. BTC ranges between recent lows and the mid-70,000s EUR equivalent while structural adoption builds underneath. Current price EUR 68,796 with 30-day momentum of -10.15% keeps the burden of proof on buyers.
- Bear scenario (assumption): tight-liquidity conditions turn ETFs into forced sellers, repeating the Q4 2025 episode when record outflows coincided with BTC breaking $98,000 support in USD terms [T2]. Whale holdings become an overhang rather than a floor [T5], and the 30-day downtrend extends below recent support.
Valuation Discussion
Bitcoin has no cash flows, so DCF-style metrics do not apply. Valuation rests on supply-demand mechanics and flow-adjusted scarcity:
- Supply is effectively fixed. 20,105,365 of 21,000,000 BTC are issued (95.74%). Remaining issuable supply is 894,635 BTC, about 4.26% of the cap. Annual mining issuance of roughly 160,000 BTC is about 0.80% of circulating supply per year [T5]. Market cap equals fully diluted valuation at EUR 1.384 trillion, so dilution risk is minimal.
- Ownership concentration defines float dynamics. 6.7 million BTC, roughly 33% of circulating supply, sat across ETFs, exchanges and treasuries at end-2025 according to Glassnode [T2]. Reallocation among these holders, not mining, sets the marginal price.
- Flow-driven fair value. Per the 2026 outlook framing, fair value is determined by the tension between expanding distribution into wealth and retirement platforms and the macro forces governing risk appetite and real rates [T5]. With the Fed at 3.75% to 4.00%, real rates cap the valuation of a no-yield asset and keep its fair value flow-dependent and fragile.
- Drawdown positioning. At -36.10% from ATH with a 200-day change of +0.43%, BTC is in a multi-quarter consolidation, not a full cycle collapse. If the 401(k) channel opens, the marginal buyer shifts from volatility-sensitive to rules-based, which would justify a structurally lower risk premium and higher flow-supported fair value [T5].
- Volatility effect. The halving of volatility from 84% to 43% per the 2025 Glassnode x Fasanara report [T2] mechanically lowers risk-parity-style position sizing frictions, though institutional adoption has also tied BTC more closely to macro and credit cycles, complicating standalone valuation [T3].
Risks
- Policy risk. Fed funds at 3.75% to 4.00% and the ECB deposit rate at 2.50% after September 2026 hikes leave no easing support for risk assets. A further hike would extend the pressure.
- Flow reversal risk. Record Q4 2025 ETF outflows coincided with BTC breaking $98,000 support in USD terms [T2]. In tight liquidity, ETFs can become forced sellers [T5]. The latest weekly flow print is not in the dataset.
- Issuer concentration. ETF assets are concentrated in a handful of issuers, raising market-structure questions if any issuer experiences operational stress [T3]. IBIT’s roughly 94% share of recent inflows [T7] sharpens this concentration.
- Custody and operational risk. Custody remains a risk even with qualified custodians; hacks and internal exploits could put funds at risk [T3]. The dataset also references a Binance hack episode with recovery to $78K in USD terms [T7]; this source is undated, so treat it as an illustrative example with date uncertainty.
- Treasury leverage risk. Digital asset treasury equity strategies have shown amplified drawdowns relative to the underlying token [T3].
- Regulatory risk. Negative US legislative developments could significantly affect institutional allocation [T3]. Failure or indefinite delay of the CLARITY Act would remove the primary regulatory catalyst and keep investment committees on the sidelines [T8].
- Macro correlation risk. Institutional adoption has tied BTC more closely to traditional macro and credit cycles [T3]. Current negative risk sentiment and the Nasdaq’s -4.44% five-day move transmit directly into BTC.
- Whale overhang risk. Wallets of 1,000 BTC or more that accumulated as a floor represent a future overhang if macro deteriorates further [T5].
Appendix
Methodology and Data Provenance
Market data comes from CoinGecko, retrieved 2026-11-04 05:15 UTC. Market overview data comes from STOXX, Wiener Boerse, FMP, the ECB yield curve, Frankfurter FX and FRED, as of 2026-11-02 to 2026-11-04. Policy rates come from the authoritative Policy Rates block: the Fed funds target range from FRED as of 2026-11-03 and the ECB deposit facility rate from the ECB key rate as of 2026-11-04.
Source Dating and Reliability
News items lack reliable publication metadata; dates are inferred from content. T1 is a July 2026 Q2 review, T4 is from May 2026, T6 is from February 2026, T7 cites Coinbase Institutional commentary from October 2026, T8 is from September 2026, T2 covers late 2025 to early 2026, T3 is an undated educational explainer, and T5 is a 2026 outlook. All news-derived figures are cited with their source dates. The July 2026 expectation of a Fed hold through Q3 [T1] is stale and superseded by the September 2026 hike in the authoritative policy rate block.
Data Gaps
- No live gold or Ethereum prices or returns in the dataset; the relative-value section is qualitative and scenario-based.
- No current weekly ETF flow data; the most recent flow figure is from October 2026 commentary [T7].
- T7’s Binance hack reference is undated.
- Volatility figures (84% to 43%) come from a 2025 report [T2] and may not reflect current realized volatility.
- USD-quoted price levels in sources ($98,000, $80,000, $180,000) are not directly comparable to the EUR 68,796 current price. As an approximate decomposition, EUR/USD is down 4.71% YTD, so the 1-year EUR return of -27.82% implies a USD-quoted decline of roughly -24% over the same period; label as an estimate.
Glossary
- Spot ETF: an exchange-traded fund holding the underlying asset directly, the dominant institutional channel for Bitcoin exposure.
- DAT (Digital Asset Treasury): a corporate structure holding digital assets on its balance sheet, sometimes with leveraged equity strategies.
- CLARITY Act: proposed US legislation establishing a federal market-structure framework for digital assets [T1] [T8].
- BTC dominance: Bitcoin’s share of total crypto market capitalization, currently 59.32%.
- FDV: fully diluted valuation, price multiplied by maximum supply; equals market cap for Bitcoin since circulating equals total supply.
- DC/401(k) channel: the US defined contribution retirement system, a potential source of rules-based inflows [T5].
- Stablecoins Ordinance: Hong Kong legislation requiring full reserve backing, redemption rights and risk controls for stablecoins [T1].
Sources
- [T1] Q2 2026 Digital Asset Review, CoinDesk Indices: https://www.coindesk.com/coindesk-indices/2026/07/09/q2-2026-digital-asset-review
- [T2] Crypto Market 2025: Year-End Review & Expert Insights, TradingView News: https://www.tradingview.com/news/99Bitcoins:37c5f55d3094b:0-crypto-market-2025-year-end-review-expert-insights
- [T3] Institutional Bitcoin Adoption Explained: How Blackrock, Fidelity and Others Embraced BTC, The Block: https://www.theblock.co/learn/macro/institutional-bitcoin-adoption-explained-how-blackrock-fidelity-and-others-embraced-btc-407111
- [T4] Bitcoin (BTC) ETFs See 7 Weeks of Inflows: Is the Institutional Bid Back?, 24/7 Wall St.: https://247wallst.com/investing/2026/05/13/bitcoin-btc-etfs-see-7-weeks-of-inflows-is-the-institutional-bid-back
- [T5] Bitcoin 2026 outlook: ETF gravity vs. Macro ceiling, 21Shares: https://www.21shares.com/en-eu/insights/bitcoin-2026-outlook-etf-gravity-vs-macro-ceiling
- [T6] The Retail vs. Institutional Divide: How Trading Patterns Reveal Two Completely Different Markets, Blockhead: https://www.blockhead.co/2026/02/26/the-retail-vs-institutional-divide-how-trading-patterns-reveal-two-completely-different-markets
- [T7] Bitcoin Recovers to $78K After Binance Hack as Institutions Buy, Altcoin Buzz: https://www.altcoinbuzz.io/bitcoin-recovery-binance-hack-institutional-buying-election
- [T8] Crypto ETFs Enter a New Phase in September: Here’s What Investors Should Watch, Bitcoin Foundation: https://bitcoinfoundation.org/news/bitcoin/crypto-etfs-enter-a-new-phase-in-september-heres-what-investors-should-watch
Disclaimer
This report is AI-generated and for informational purposes only. It does not constitute investment advice, a recommendation, or an offer to buy or sell any financial instrument. Figures are drawn from the cited sources and may be incomplete, delayed, or inaccurate. Readers should conduct their own due diligence and consult a licensed financial advisor before making investment decisions.
Important Note / Wichtiger Hinweis:
EN: This report may have been generated using AI. It processes data from publicly available sources. The content is provided for informational purposes only.DE: Dieser Bericht kann mithilfe von KI erstellt worden sein. Dabei werden Daten aus öffentlich zugänglichen Quellen verarbeitet. Die Inhalte dienen ausschließlich Informationszwecken.
* DE: Die ergänzenden Inhalte können KI-generiert sein. EN: The additional content may be AI-generated.